Market History


The last major equity market downturn ended more than a decade ago, and today investors worry about slowing growth and worsening trade wars. Whether the next downturn is a few months away or a few years away, this is an excellent time to prepare portfolios to successfully navigate equity stress. We believe the best way to navigate an equity market downturn is to enter it with a plan in place. Thoughtful decisions—not rash actions—during these chaotic environments are what separate the top-performing investors from everyone else. In this series, we review five important topics that should inform any plan to manage portfolios through equity market downturns:
Horror must be the equivalent film genre for equity bear markets. Take any classic in that category and the mood inevitably shifts from relatively relaxed to panic-stricken, often in abrupt fashion. Few would deny that equity bear markets tend to follow this simple sequence. Sure, there may be a small cohort of investors that credibly claim they predicted the downturn in advance, but those investors’ outlook is not the market’s consensus view. More importantly, the decisions an investor—or a horror film’s protagonist—makes during difficult times can have an outsized impact on how he or she fares.
We believe the best way to navigate an equity market downturn is to enter it with a plan in place. For many investors, the plan may simply be to rely on a well-constructed asset allocation policy and to stick to their pre-determined rebalancing policy. Investors would be well served to periodically review their asset allocation policy to ensure it aligns well with the asset owner’s risk tolerance and serves his or her financial objectives. While the next downturn will no doubt vary from prior ones in ways we will not expect, a plan can help to prevent rash decisions.
This piece focuses on a key input into any plan—market history. We examine data from prior equity market downturns to understand how different asset classes have tended to perform. We also review how difficult it is to identify a market bottom during a downturn, highlighting the abysmal economic data that are common at bottoms and the limited utility of valuation data as a timing tool. Finally, we illustrate how cutting the size of a target equity allocation or holding a below-target weight allocation may undercut a portfolio’s performance. Ultimately, equity market downturns are chaotic environments that are rarely short-lived—the best advice is to be prepared.
Descent into Chaos
So, what do equity market downturns look like, and how do other asset markets perform in such environments? We examined periods over the last 50 years when the month-end price level of a prominent US equity benchmark declined by at least 20%. We chose to review the US equity market, given its large allocation in equity portfolios and its considerable influence on non-US equity markets. By our measurement, there have been five equity market downturns—also referred to as bear markets—during that time period, with one occurring roughly every decade. 1
Unsurprisingly, the data paint a bleak picture. The worst downturn across our study period overlapped with the global financial crisis (GFC), when US equities returned a heart-halting -50.9%. 2 Sadly, the median return across the five bear markets (-42.6%) is not much better. High levels of volatility were common to these periods—the annualized standard deviation of monthly US equity returns across all downturns was 17.7,% as compared to 13.6% in all other environments. And, unfortunately, the difficult return environment was rarely swift. Instead, investors had to rationalize their investment choices for a lengthy one to two years during most downturns.
US EQUITY MARKET DOWNTURNS
December 31, 1972 – June 30, 2019 • S&P 500 Price Index • Log Scale
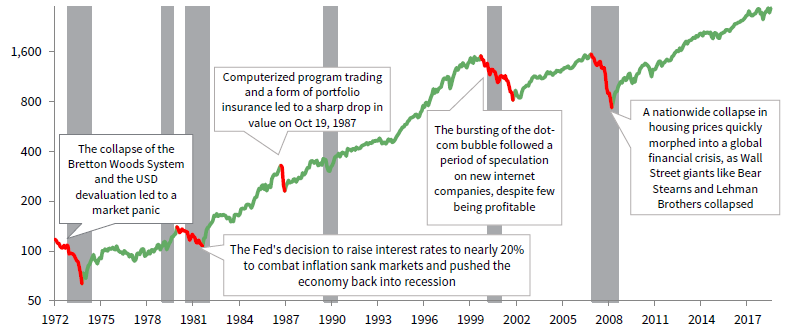
Sources: National Bureau of Economic Research (NBER), Standard & Poor’s, and Thomson Reuters Datastream.
Notes: Data are monthly, with red lines reflecting the five equity market downturns since the early 1970s. The gray bars represent NBER-defined US recessions.
Other equity markets displayed similar returns during downturns as US equities. The median USD total return for developed equity markets excluding the United States was -28.8%, which is a challenging result even if it is more than 10 percentage points better than the same measurement for US equities during the same period. But, in looking at just the last two downturns, which allows us to review emerging markets equity performance as well, we see all equity returns were quite similar. Given how interconnected global markets have become, it is reasonable to consider the equity market behavior witnessed more recently as the most applicable to future scenarios, all else equal.
Yet, not all asset classes performed poorly. The median returns for cash and US Treasuries during the five equity bear markets were 8.1% and 13.3%, respectively. Those investments no doubt benefited from investor desires for both quality and liquidity. While the median gold return (16.8%) was higher than US Treasuries’, the investment was more volatile, with gold’s return deeply negative during one of the five periods. Similarly, commodity futures and the dollar had mixed results across the different time periods, but both exhibit negative median returns.
Perhaps surprisingly, US equity market downturns and economic recessions do not always overlap. In fact, bear markets coincided with just four of the six US recessions across our study period (the 1973–75, 1981–82, 2001, and 2007–09 recessions), with bear markets typically leading recessions by roughly seven months. The equity market contractions experienced during the two other US recessions (the 1980 and 1990–91 recessions) were less severe, and the 1987 crash occurred as real GDP growth was positive and accelerating.
ASSET CLASS TOTAL RETURNS IN US EQUITY BEAR MARKETS
December 31, 1972 – June 30, 2019 • US Dollars
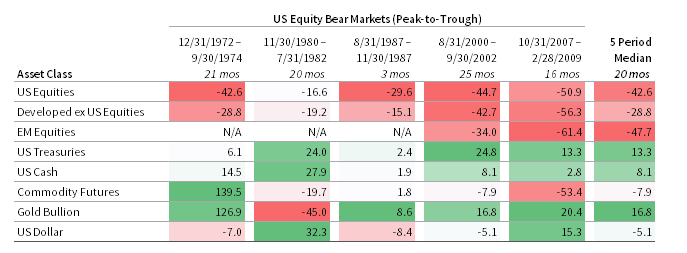
Sources: Bloomberg Index Services Limited, Intercontinental Exchange, Inc., LBMA, MSCI Inc., Standard & Poor’s, and Thomson Reuters Datastream. MSCI data provided “as is” without any express or implied warranties.
Notes: Asset classes represented as follows: S&P 500 Index (“US Equities”), MSCI World ex US Index (“Developed ex US Equities”), MSCI Emerging Markets Index (“EM Equities”), Bloomberg Barclays US Treasury Index (“US Treasuries”), ICE BofAML 91-Day Treasury Bill Index (“US Cash”), S&P GSCI™ Index (“Commodity Futures”), LBMA Gold Spot Price (“Gold Bullion”), and US Dollar Index (DXY, “US Dollar”). Data are monthly. Total returns are gross of dividend taxes.
An Ambiguous Bottom
Consider the following economic environment—real US GDP, industrial production, and retail sales are contracting rapidly; financial conditions are exceptionally tight; and price levels are teetering on the edge of deflation. As you might have guessed, that environment was not fictional. It reflected economic data known in early 2009 when equity markets hit a bottom during the GFC. To perfectly time equity markets during that downturn, an investor would have needed the resolve to rebalance into that dire economic backdrop. Obviously, that’s no easy task!
The challenge with identifying equity market bottoms is the lack of an obvious timing signal. For instance, while the popular cyclically adjusted price-earnings (CAPE) ratio contracted across all five equity market downturns, the magnitude of the decline varied widely from -26.1% to -53.2%. Moreover, the multiples at the various market bottoms also differed, ranging from 8.4 to 24.0. In fact, only two of the five multiples at market bottoms were even in the bottom quartile of historical observations. This is not to say that valuation data are not helpful; rather, they are ineffective timing tools.
False equity market bottoms also make it difficult to identify a true bottom. Two of the five downturns we reviewed (2000–02 and 2007–09 downturns) contained so-called “relief rallies” when equity markets pared back some of their losses. Both rallies were considerable, returning more than 20% to investors using daily data, and it would have been easy to confuse them with an end to the downturn, as many common momentum signals turned positive. But these rallies were eventually overtaken by the challenges that originally prompted the downturn, and equity prices eventually fell to lower lows.
VALUATION CHANGES DURING US EQUITY MARKET DOWNTURNS
Cyclically Adjusted Price-Earnings (CAPE) Ratio (x)
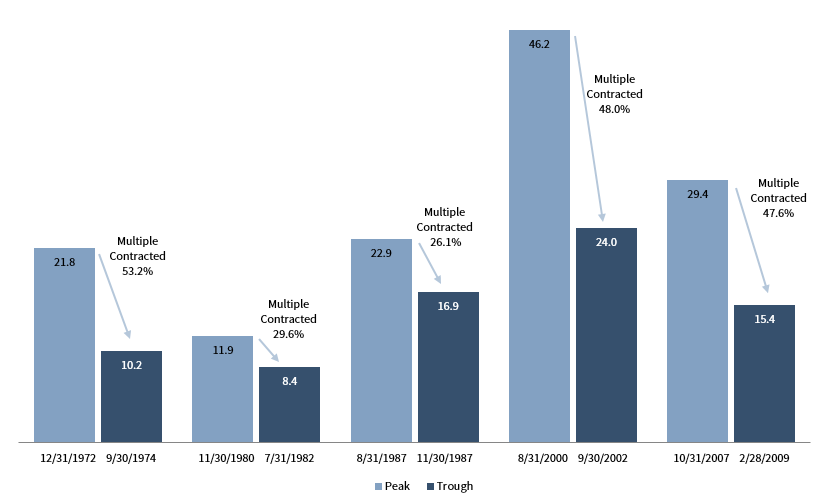
Sources: Robert J. Shiller, Standard & Poor’s, and Thomson Reuters Datastream.
Note: Multiples reflect Robert J. Shiller cyclically adjusted total return price-earnings ratios.
Not only is timing a market bottom a challenging endeavor, but poor decision making during a downturn could undercut a portfolio’s performance to a greater degree than in other environments. This stems from the market’s tendency to mean revert from extreme positions, which in this case means that abnormal performance in one direction is often followed by abnormal performance in the other. Take, for instance, our five equity market drawdowns—the one-year US equity return following market bottoms ranged from 23.2% to 59.0%, with a median of 38.0%. Investors that cut the size of their target equity allocation or that hold a below-target equity weight would have pocketed a smaller share of those rare chunky returns.
US EQUITY MARKET RECOVERIES
December 31, 1972 – June 30, 2019 • S&P 500 Total Return Index • Percent Change Since Trough (%)
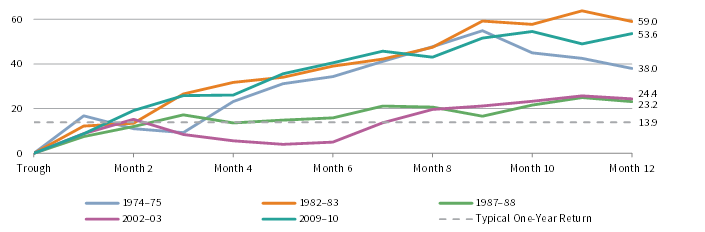
Sources: Standard & Poor’s and Thomson Reuters Datastream.
Notes: Data are monthly and reflect the one-year performance following each of the five equity market downturns since the early 1970s. The typical one-year return reflects the median one-year return on the index across the entire review period, or 1972 to present.
Lessons Learned
Equity market downturns are difficult environments to navigate. To maximize the probability of navigating one successfully, investors should have a well-constructed asset allocation policy in place that is meant to withstand the ups and downs of market cycles. This policy should be regularly reviewed to ensure its associated risks continue to align well with the asset owner’s risk tolerance. Investors should also devise a plan for responding to an equity market downturn and share it with other investment decision-making stakeholders. For many investors, the plan may be to rely on their asset allocation policy and follow their pre-determined rebalancing policy.
While a plan to manage a portfolio through an equity market downturn should be devised with an investor’s specific circumstances in mind, it should also be informed by market history. Specifically, downturns can be prolonged affairs with considerable bouts of volatility, and market bottoms have not been easy to identify. A plan should also be informed by an in-depth understanding of liquidity, diversification, behavioral biases, and what assets might perform well as a rebound occurs, all of which are explored in the companion pieces of this series. An investor with a plan rooted in these areas stands the best chance of being prepared for the next equity market downturn. ■
APPENDIX: ASSET CLASS TOTAL RETURNS IN DEVELOPED EQUITY BEAR MARKETS
February 28, 1973 – June 30, 2019 • US Dollars
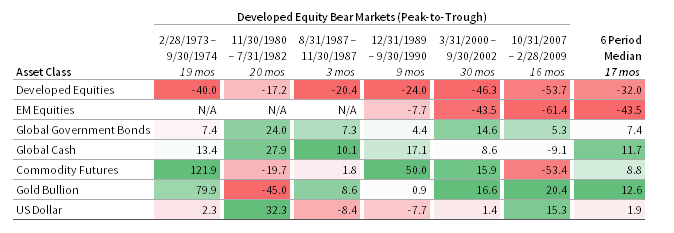
Sources: Bloomberg Index Services Limited, FTSE Fixed Income LLC, Intercontinental Exchange, Inc., J.P. Morgan Securities, Inc., LBMA, MSCI Inc., Standard & Poor’s, and Thomson Reuters Datastream. MSCI data provided “as is” without any express or implied warranties.
Notes: Asset classes represented as follows: MSCI World Index (“Developed Equities”), MSCI Emerging Markets Index (“EM Equities”), FTSE World Government Bond Index (“Global Government Bonds”), J.P. Morgan 3-Month Global Cash Index (“Global Cash”), S&P GSCI™ Index (“Commodity Futures”), LBMA Gold Spot Price (“Gold Bullion”), US Dollar Index (DXY, “US Dollar”). Global Government Bonds returns prior to February 1985 reflect the Bloomberg Barclays US Treasury Index. Global Cash returns prior to January 1986 reflect the ICE BofAML 91-Day Treasury Bills Index. Data are monthly. Total returns are gross of dividend taxes.
APPENDIX: ASSET CLASS TOTAL RETURNS IN UK EQUITY BEAR MARKETS
August 31, 1972 – June 30, 2019 • Pound Sterling
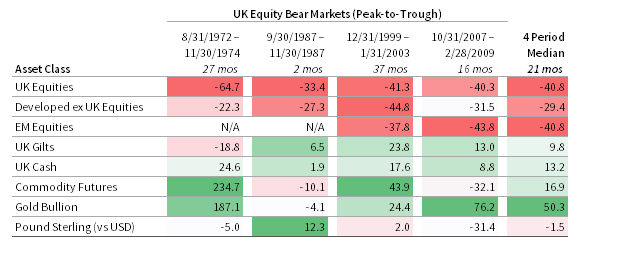
Sources: FTSE International Limited, Global Financial Data, Inc., J.P. Morgan Securities, Inc., LBMA, MSCI Inc., Standard & Poor’s, Thomson Reuters Datastream, and WM/Reuters. MSCI data provided “as is” without any express or implied warranties. Notes: Asset classes represented as follows: MSCI United Kingdom Index (“UK Equities”), MSCI World ex UK Index (“Developed ex UK Equities”), MSCI Emerging Markets Index (“EM Equities”), FTSE British Government All Stocks Index (“UK Gilts”), J.P. Morgan 3-Month UK Cash Index (“UK Cash”), S&P GSCI™ Index (“Commodity Futures”), LBMA Gold Spot Price (“Gold Bullion”), WM/Reutuers GBP/USD Exchange Rate (“Pound Sterling [vs USD]”). Developed ex UK Equities, EM Equities, and Commodity Futures are based on index returns in USD terms translated to UK sterling. UK Fixed Income returns prior to February 1976 reflect the Global Financial Data 10-Year UK Bond Index. UK Cash returns prior to January 1986 reflect the Global Financial Data 3-Month UK Cash Index. Data are monthly. Total returns are gross of dividend taxes.
APPENDIX: ASSET CLASS TOTAL RETURNS IN EMU EQUITY BEAR MARKETS
July 31, 1987 – June 30, 2019 • Euro
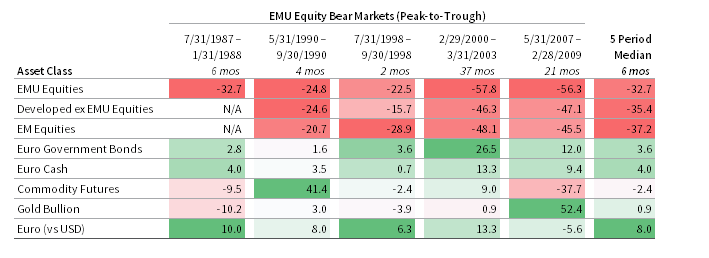
Sources: Bloomberg Index Services Limited, Global Financial Data, Inc., Intercontinental Exchange, Inc., J.P. Morgan Securities, Inc., LBMA, MSCI Inc., Standard & Poor’s, Stoxx, Thomson Reuters Datastream, and WM/Reuters. MSCI data provided “as is” without any express or implied warranties.
Notes: Asset classes represented as follows: Euro Stoxx Index (“EMU Equities”), MSCI World ex EMU Index (“Developed ex EMU Equities”), MSCI Emerging Markets Index (“EM Equities”), ICE BofAML Euro Government Bond Index (“Euro Government Bonds”), J.P. Morgan 3-Month Euro Cash Index (“Euro Cash”), S&P GSCI™ Index (“Commodity Futures”), LBMA Gold Spot Price (“Gold Bullion”), WM/Reuters EUR/USD Exchange Rate (“Euro (vs USD)”). Developed ex EMU Equities, EM Equities, Commodity Futures, and Gold Bullion are based on index returns in USD terms translated to euros. Data are monthly. Total returns are gross of dividend taxes.
Read part 2: Portfolio Liquidity.
Methodology Note
There are different ways to review US equity market downturns. For instance, an analyst could review daily equity price data and extend his or her analysis several decades prior to 1970. We opted to limit our review to month-end data and data since that year, as it allows us to compare US equity performance to a broad collection of asset classes and better understand valuation levels. We also defined US equity market downturns as price declines of at least 20% peak-to-trough.
Index Disclosures
BBG US Treasury Index
The Bloomberg Barclays US Treasury Index measures USD-denominated, fixed-rate, nominal debt issued by the US Treasury. Treasury bills are excluded by the maturity constraint, but are part of a separate Short Treasury Index.
Euro STOXX® Index
The EURO STOXX® Index is a Eurozone subset derived from the STOXX Europe 600, which represents large-, mid- and small-capitalization companies among 17 European countries, including the United Kingdom, France, Germany, Switzerland, Austria, Belgium, Denmark, Finland, Ireland, Italy, Luxembourg, the Netherlands, Norway, Poland, Portugal, Spain, and Sweden.
FTSE British Govt All Stocks Index
The FTSE Actuaries British Government-Linked All Stocks Index includes British Government Securities quoted on the London Stock Exchange. Prices used for index calculations are the official end-of-day reference prices produced by Tradeweb under the oversight of FTSE® Russell.
FTSE World Govt Bond Index
The FTSE World Government Bond Index (WGBI) measures the performance of fixed-rate, local currency, investment-grade sovereign bonds. The WGBI currently includes sovereign debt from more than 20 countries, denominated in a variety of currencies, and has more than 30 years of history available.
ICE BofAML 91-Day T Bill
Tracks the total return performance of the outstanding debt of European sovereign issuers. It is a market-capitalization weighted basket comprising bonds issued in their respective domestic markets and denominated in their local currency.
ICE BofAML Euro Government Bond Index
The ICE BofAML 91-Day Treasury Bills Index represents the return of a single 91-day Treasury bill purchased at the beginning of each month and held for a full month, at which time that issue is sold and rolled into a newly selected issue. The Treasury bill selected each month matures within the following 90 days. The performance shown for the index reflects reinvestment of dividends and, where applicable, capital gain distributions, and is not subject to fees and expenses to which the fund is subject.
J.P. Morgan 3M Euro Cash Index
The index measures the three-month performance of euro-denominated money market securities.
J.P. Morgan 3M Global Cash Index
The index measures the three-month performance of foreign currency–denominated money market securities.
J.P. Morgan 3M UK Cash Index
The index measures the three-month performance of money market securities denominated in UK pound sterling.
LBMA Gold Price
The LBMA Gold Price includes 15 accredited participants: Bank of China, Bank of Communications, Coins ‘N’Things, Goldman Sachs, HSBC Bank USA NA, Industrial and Commercial Bank of China (ICBC), INTL FCStone, Jane Street Global Trading LLC, JP Morgan Chase Bank N.A. London Branch, Koch Supply and Trading LP, Marex Financial Limited, Morgan Stanley, Standard Chartered Bank, The Bank of Nova Scotia, and The Toronto Dominion Bank. The price is set twice daily in USD terms.
MSCI Emerging Markets Index
The MSCI Emerging Markets Index represents a free float–adjusted market capitalization index that is designed to measure equity market performance of emerging markets. Emerging markets countries include: Argentina, Brazil, Chile, China, Colombia, Czech Republic, Egypt, Greece, Hungary, India, Indonesia, Korea, Malaysia, Mexico, Pakistan, Peru, the Philippines, Poland, Qatar, Russia, Saudi Arabia, South Africa, Taiwan, Thailand, Turkey, and the United Arab Emirates.
MSCI United Kingdom Index
The MSCI United Kingdom Index is designed to measure the performance of the large- and mid-cap segments of the UK market. With 97 constituents, the index covers approximately 85% of the free float–
adjusted market capitalization in the United Kingdom.
MSCI World Index
The MSCI World Index represents a free float–adjusted, market capitalization–weighted index that is designed to measure the equity market performance of developed markets. It includes 23 developed markets country indexes: Australia, Austria, Belgium, Canada, Denmark, Finland, France, Germany, Hong Kong, Ireland, Israel, Italy, Japan, the Netherlands, New Zealand, Norway, Portugal, Singapore, Spain, Sweden, Switzerland, the United Kingdom, and the United States.
MSCI World ex EMU Index
The MSCI World ex EMU Index captures large- and mid-cap representation across 13 of 23 developed markets countries (excluding those in the EMU): Australia, Canada, Denmark, Hong Kong, Israel, Japan, New Zealand, Norway, Singapore, Sweden, Switzerland, the United Kingdom, and the United States. With 1,373 constituents, the index covers approximately 85% of the free float–adjusted market capitalization in each country.
MSCI World ex UK Index
The MSCI World ex UK Index captures large- and mid-cap representation across 22 of 23 developed markets countries, excluding the United Kingdom. Developed markets countries include: Australia, Austria, Belgium, Canada, Denmark, Finland, France, Germany, Hong Kong, Ireland, Israel, Italy, Japan, the Netherlands, New Zealand, Norway, Portugal, Singapore, Spain, Sweden, Switzerland, and the United States.
MSCI World ex US Index
The MSCI World ex US Index captures large- and mid-cap representation across 22 of 23 developed markets countries, excluding the United States. Developed markets countries include: Australia, Austria, Belgium, Canada, Denmark, Finland, France, Germany, Hong Kong, Ireland, Israel, Italy, Japan, the Netherlands, New Zealand, Norway, Portugal, Singapore, Spain, Sweden, Switzerland, and the United Kingdom.
S&P 500 Index
The S&P 500 gauges large-cap US equities. The index includes 500 leading companies and captures approximately 80% coverage of available market capitalization.
S&P GSCI™ Index
The S&P GSCI™ is designed as a benchmark for investment in the commodity markets and as a measure of commodity market performance over time. The S&P GSCI™ is calculated primarily on a world production-weighted basis and comprises the principal physical commodities that are the subject of active, liquid futures markets. There is no limit on the number of contracts that may be included in the S&P GSCI™; any contract that satisfies the eligibility criteria and the other conditions specified in this methodology are included.
US Dollar Index
The US Dollar Index is used to measure the value of the dollar against a basket of six world currencies. The six currencies are the euro, Swiss franc, Japanese yen, Canadian dollar, British pound, and Swedish krona. The value of the index is indicative of the dollar’s value in global markets.
Footnotes
Kevin Rosenbaum, CFA, CAIA - Kevin Rosenbaum is Head of Global Capital Markets Research and Investment Communications at Cambridge Associates.
About Cambridge Associates
Cambridge Associates is a global investment firm with 50+ years of institutional investing experience. The firm aims to help pension plans, endowments & foundations, healthcare systems, and private clients achieve their investment goals and maximize their impact on the world. Cambridge Associates delivers a range of services, including outsourced CIO, non-discretionary portfolio management, staff extension and alternative asset class mandates. Contact us today.