Diversification Challenges


The last major equity market downturn ended more than a decade ago, and today investors worry about slowing growth and worsening trade wars. Whether the next downturn is a few months away or a few years away, this is an excellent time to prepare portfolios to successfully navigate equity stress. We believe the best way to navigate an equity market downturn is to enter it with a plan in place. Thoughtful decisions—not rash actions—during these chaotic environments are what separate the top-performing investors from everyone else. In this series, we review five important topics that should inform any plan to manage portfolios through equity market downturns:
- Market History
- Portfolio Liquidity
- DIVERSIFICATION CHALLENGES
- Behavioral Roadblocks
- Playing Offense
Diversification is a cornerstone of any investment program, but as bull markets become extended, investors may be tempted to concentrate portfolios on positions that have recently worked the best (today, US equities). Further, the global financial crisis (GFC) exposed the supposed failure of diversification, as many risk assets marched down together. Numerous academic studies have reviewed the pervasiveness of correlation spikes during crisis periods, even among risk assets that typically have low or negative correlations to one another. These issues prompt investors to question whether their portfolios can still benefit from diversification during an equity downturn. In our view, the answer is unequivocally yes.
In this piece, we discuss why investors should remain diversified and how they can avoid diversification pitfalls when preparing their portfolio for the next downturn, whenever it occurs. As part of this analysis, we examine the importance of diversification (especially for investors that spend from the portfolio), review the performance of safe-haven and alternative assets during crisis periods, discuss common misconceptions of correlations, and consider the significance of portfolio risk factors.
A Reminder of the Importance of Diversification
The late innings of a protracted bull market are as good a time as any to review the rationale for diversification. First, it is harder for investors to hit asset class home runs this late in the game. Asset class performance fluctuates over time. Investors don’t know which asset class will be the top performer next, but winners rarely persist, and consistently timing such bets perfectly is impracticable. Second, while diversification is not perfect, it dampens portfolio declines relative to a portfolio consisting entirely of equities. Holding a diversified portfolio means owning some assets that will lag while others lead—which means the diversified portfolio will inevitably underperform some simple portfolios over shorter windows–but provides a smoother ride and superior returns over the long term. And finally, diversification is especially helpful for investors that spend from the portfolio. Indeed, well implemented diversified portfolios protect on the downside without compromising upside returns during good periods, enabling higher spending than a simple stock/bond portfolio.
Controlling risk on the downside is imperative for institutions that rely on spending. For illustrative purposes, consider an institution that has 5% spending needs annually. If the institution held a 100% equity portfolio, it could be susceptible to a 50% decline in its portfolio value in the next major bear market (the S&P 500 Index declined by roughly half during the bursting of the dot-com bubble and the GFC). Assuming spending needs were subject to a floor of nominal spending prior to the crisis, then spending would jump from 5% to 10% of the total portfolio value after the decline. Such an erosion of portfolio value would make recovering prior high-water marks extremely challenging. By diversifying effectively, investors can diminish volatility and protect the portfolio on the downside, supporting spending needs and allowing for quicker recoveries than simple, concentrated portfolios.
Asset Class Movements in Crisis Periods
Many liquid risk assets show rising correlations during stock sell-offs. Intuitively, investors might expect correlations to rise incrementally during times of panic, but in some cases risk assets have become almost perfectly correlated with equities and each other. In particular, risk assets that have historically shown a low or negative correlation with equities—such as real estate, commodities, and emerging markets bonds—move to positive correlations with equities during downturns, as investors seek to offload risk assets in tandem. Hedge funds, which generally have lower correlations with equities than other risk assets, often sync up with equities in stress periods.
Private equity investments have a unique relationship with listed equities; they can look defensive during public equity drawdown periods due primarily to infrequent, appraisal-based pricing, which creates a smoothing effect on reported returns. For instance, during the GFC for the five quarters from March 2008 through March 2009, private equity substantially outperformed public equities. In the initial market recovery over the subsequent two years, public equities bounced sharply off lows and outperformed private equity funds, which were not marked down as much and didn’t have as far to bounce back. Yet, for the full period from March 2008 through March 2011, public equities declined 3%, while private equity gained 11%. Private equity funds tend to show a shallower decline during public equity drawdowns because they are not marked to market on a frequent basis, which will reduce overall portfolio volatility. Some investors consider the illiquidity of private investments to be a benefit to investors during crisis periods, as it can help prevent some of the unhelpful behavioral tendencies identified by Michael Salerno in the companion piece “Behavioral Challenges” and their related outcomes (such as selling at market troughs, or being reluctant to rebalance during a crisis). Other categories of private investments can reduce reliance on economic growth, while still targeting returns commensurate with equities. Certain strategies—life settlements, royalty investments, and infrastructure investments—have offered healthy returns that are uncorrelated with typical portfolio exposures and less sensitive to economic conditions. However, such strategies have lower long-term expected returns than venture capital, buyouts, and growth equity.
Hedge funds are quite heterogeneous, and certain styles can offer protective features during downside environments. For instance, trend-following strategies have historically outperformed during equity drawdown periods. Yet, these strategies have faced scrutiny in the recent years as performance has lagged, raising questions about whether the benefits of trend following have waned. Rapid market reversals are a challenge for the trend-following strategies, and these reversals have occurred frequently over the past five years as central bank policy tweaks, geopolitics, and trade frictions have dominated market news. Still, these strategies can offer diversification appeal over a prolonged bear market period, where funds would be expected to incrementally adopt net short equity and long bond positioning as the signals turn.
“Safe-haven” assets can provide portfolio ballast during periods of market turbulence, sometimes at the cost of poor returns in other periods. An examination of various asset classes during downturns clearly shows the defensive benefits of such assets. In the nearly 30 years since 1990, there have been seven periods where the S&P 500 declined more than 15% from peak-to-trough on a daily basis. The median nominal returns of gold, US Treasury bonds, and US T-bills were 7.5%, 3.6%, and 0.6%, respectively. These safe-haven assets were rarely negative during those periods, while major equity regions had similar drawdowns across all periods. Hedge funds held up better than other risk assets, given their defensive characteristics, with a median decline of 5.0%. Trend-following strategies posted median nominal returns of 5.5%, outperforming US Treasury bonds during drawdown periods. Indeed, safe havens and hedge funds outperformed equities in every downturn over the past 30 years.
PERFORMANCE DURING S&P 500 DRAWDOWNS OF 15% OR MORE
Percent (%) • Based on seven (7) S&P Drawdowns Since 1990 • Bold Marker Represents Median
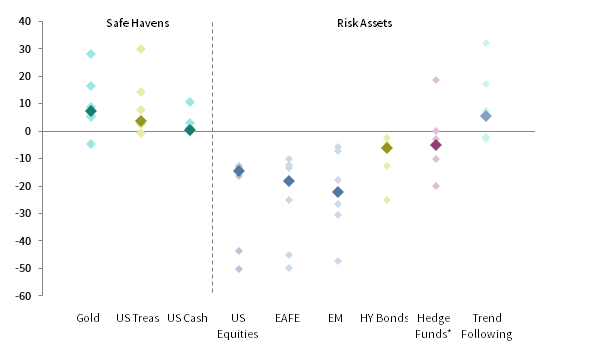
* Hedge fund data begin on January 31, 1998 and captures six of seven drawdown periods.
Sources: Barclay Trading Group, Bloomberg Index Services Limited, Hedge Fund Research, Inc., Intercontinental Exchange, MSCI Inc., Standard & Poor’s, and Thomson Reuters Datastream. MSCI data provided “as is” without any express or implied warranties.
Notes: Observations are based S&P declines of 15% or more, calculated from daily data. Data are based on monthly returns, calculated from closest month-end to S&P daily peak and trough. All returns are total returns, except gold, for which returns are based on changes in the spot price. Asset classes represented by the following: Gold Bullion Prices (“Gold”), Bloomberg Barclays US Treasury Bond Index (“US Treas”), ICE BofAML 91-Day Treasury Bill Index (“Cash”), S&P 500 Index (“US Equities”), MSCI EAFE Index (“EAFE”), MSCI EM Index (“EM”), Bloomberg Barclays US Corporate High-Yield Index (“HY Bonds”), and Barclay BTOP50 Index (“Trend Following”). Hedge fund data are represented by a proxy blend of 50% Hedge Fund Research (HFRX) Absolute Return Index and 50% Hedge Fund Research (HFRX) Equity Hedge Index. Trend following data are through June 30, 2019.
Intuitively, safe-haven assets are characterized as such because they have historically offered stability in market downturns, but investors lacking crystal balls must also consider the opportunity costs (i.e., trade-offs) of owning these assets in lieu of riskier assets in more sanguine market environments. Equity drawdown periods are a small portion of the history; since 1990, the seven S&P drawdown periods of 15% or more occurred across a combined 67 months out of the 355-month period. While the returns of safe havens look stable and defensive during drawdowns, the returns look much less attractive during all other periods. The resulting returns during non-drawdown periods have been slightly positive in nominal terms, but real returns are paltry or negative. A non-income-producing asset like gold has historically had a high opportunity cost during non-drawdown periods, and its volatile returns have looked poor even in relation to cash. However, given paltry yields today, expected returns on fixed income are muted, and the opportunity cost of holding gold in favor of cash is low.
ANNUALIZED PERFORMANCE
January 1, 1990 – July 31, 2019 • Percent (%) • Geometrically Linked AACRs
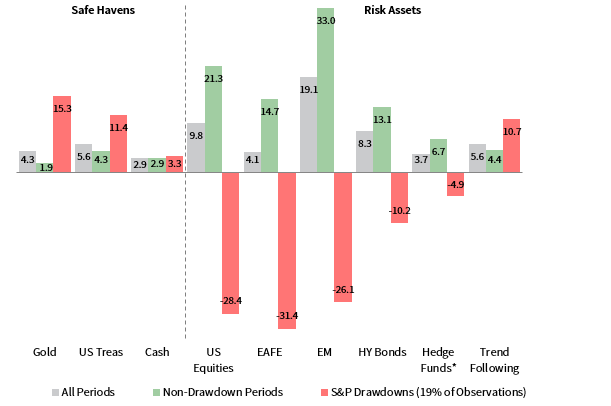
* Hedge Fund data begin on January 31, 1998 and captures six of seven drawdown periods.
Sources: Barclay Trading Group, Bloomberg Index Services Limited, Hedge Fund Research, Inc., Intercontinental Exchange, MSCI Inc., Standard & Poor’s, and Thomson Reuters Datastream. MSCI data provided “as is” without any express or implied warranties.
Notes: S&P drawdowns represent price declines of greater than 15%. All returns are total returns, except gold, for which returns are based on changes in the spot price. Asset classes represented by the following: Gold Bullion Prices (“Gold”), Bloomberg Barclays US Treasury Bond Index (“US Treas”), ICE BofAML 91-Day Treasury Bill Index (“Cash”), S&P 500 Index (“US Equities”), MSCI EAFE Index (“EAFE”), MSCI EM Index (“EM”), Bloomberg Barclays US Corporate High-Yield Index (“HY Bonds”), and Barclay BTOP50 Index (“Trend Following”). Hedge fund data are represented by a proxy blend of 50% Hedge Fund Research (HFRX) Absolute Return Index and 50% Hedge Fund Research (HFRX) Equity Hedge Index. Trend following data are through June 30, 2019.
Correlation Misconceptions
Correlations can be an important input to assess diversification in the portfolio, but are commonly misinterpreted. They measure the linear relationship between two random variables and indicate the tendency of those variables to move together. However, asset classes can move in the same direction but with varying degrees of magnitude, particularly over long-term periods. For example, for the ten years ended October 31, 2010, EM equities had a strong correlation with US equities: 0.80. Yet, EM equities trounced US equities by 14% per year during this ten-year period. This trend has since reversed, and for the ten-year period through July 31, 2019, US equities have topped EM equities by 8% per year—the widest gap on record. Equities in one region or country can outperform over many years, but leadership ultimately changes. Simply assessing directionality without magnitude is insufficient to understanding the long-term benefits of diversification.
In shorter-term crisis periods, correlations can be unstable and can spike as assets decline in tandem. Asset allocation models tend to rely on static inputs, which aim to capture long-term correlations, but do not reflect the reality of short-term deviations in correlations. For example, in Cambridge Associates’ equilibrium assumptions, we estimate a correlation of 0.69 between US and non-US equity market returns, and 0.62 between US and EM market returns. However, correlations observed during equity sell-offs are much higher, near 0.9 and 0.8, respectively, as sentiment and supply/demand drivers can cause risk assets to simultaneously crash. For this reason, having alternative assets and safe havens with a variety of economic exposures can serve as ballast to the portfolio during such periods. Diversifying globally may not provide a short-term benefit during drawdown periods, but over longer periods, regional markets are more likely to exhibit meaningful performance dispersion.
The Importance of Risk Factors
Many investors recognize that the sharp rise in correlations during crisis periods can mitigate the volatility-reducing benefits of traditional diversification across asset classes. Thus, investors should understand risk diversification ahead of a downturn. For investors that employ alternative-beta strategies or whose managers have persistent exposures to certain factors, understanding how those factors perform and interact during downturns is crucial. Among well-known equity style factors, quality and minimum volatility strategies posted strong excess returns during the GFC, and we would typically expect them to outperform broad indexes in times of crisis. Size and value lagged during the crisis, as smaller stocks tend to have higher equity betas versus large-cap stocks, and value tends to be cyclical. Yet today, value is quite cheap relative to growth, and may be cheap enough to outperform growth again during the next crisis period, as it did in the downturns from 1980 to 1982 and the early 2000s. Correlations of excess returns across various factor strategies have been low to negative in the past 20 years, and combining such strategies can offer investors a more transparent way to diversify risk factors. For example, value and momentum strategies are a promising combination. During the past ten S&P drawdowns, these factors complemented each other on an excess return basis. While exposures to multi-factor combinations can have attractive diversification properties, individual style factors can be highly cyclical, and concentrated risk exposure to any single risk factor can present unintended risks.
DRAWDOWNS AND FACTORS
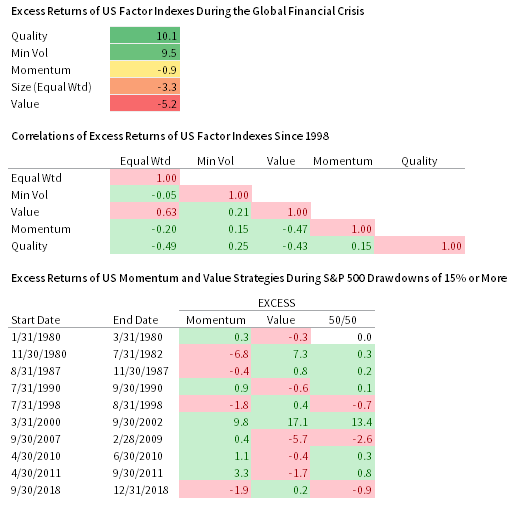
Sources: MSCI Inc., Ned Davis Research, Inc., Standard & Poor’s, and Thomson Reuters Datastream. MSCI data provided “as is” without any express or implied warranties.
Notes: S&P 500 drawdowns of 15% or more are based on daily price levels. Due to data availability, start and end dates for these drawdown periods are based on the nearest month-end data. Returns shown are total returns net of dividend taxes.
Conclusion
As investors prepare for the next equity market downturn (whenever it occurs), they should take a closer look at the benefits and limits of diversification. The commonly used adage that “all correlations go to one in a crisis” may be an exaggeration, but it still serves as a reminder that traditional diversification across risk assets has little short-term efficacy in times of market turbulence. To ensure adequate diversification for the next downturn, investors should reexamine the merits and trade-offs of holding safe-haven assets, consider the benefits of alternative assets strategies as a way to diversify dependence on economic growth, and evaluate the downturn performance of any persistent factor exposures employed by equity managers (such as value or quality tilts). While traditional safe-haven assets provide stability during drawdowns, opportunity costs of holding such assets across cycles can be high, particularly in the case of gold—but also in the cases of cash and Treasury bonds, which offer paltry rates. Private equity strategies can help investors avoid behavioral mistakes during prolonged market drawdowns, and certain other private investment categories offer attractive characteristics uncorrelated to economic growth. Trend-following hedge fund strategies have historically offered strong diversification properties in market drawdown periods. Factor tilts can offer diversification benefits to the portfolio, but investors must consider that factors can be cyclical through downturns, and should beware of excessive exposure to any single factor. Correlations spike over short-term horizons during downturns, but over the longer term, the magnitude or performance dispersion of asset classes plays a key role in portfolio diversification. Perhaps the biggest mistake that investors could make is abandoning diversification in the late innings of one of the longest bull markets on record.
Read part 4: Behavioral Roadblocks.
Index Disclosures
Barclay BTOP50 Index
The BTOP50 Index seeks to replicate the overall composition of the managed futures industry with regard to trading style and overall market exposure.
BBG US Corporate High Yield Index
The Bloomberg Barclays US Corporate High Yield Bond Index is composed of fixed-rate, publicly issued, non-investment grade debt, is unmanaged, with dividends reinvested.
BBG US Treasury Index
The Bloomberg Barclays US Treasury Index measures USD-denominated, fixed-rate, nominal debt issued by the US Treasury. Treasury bills are excluded by the maturity constraint, but are part of a separate Short Treasury Index.
Hedge Fund Research Absolute Return Index
The HFRX Absolute Return Index is designed to be representative of the overall composition of the hedge fund universe.
ICE BofAML 91-Day T Bill
The ICE BofAML 91-Day Treasury Bills Index represents the return of a single 91-day Treasury bill purchased at the beginning of each month and held for a full month, at which time that issue is sold and rolled into a newly selected issue. The Treasury bill selected each month matures within the following 90 days. The performance shown for the index reflects reinvestment of dividends and, where applicable, capital gain distributions, and is not subject to fees and expenses to which the fund is subject.
MSCI EAFE Index
The MSCI EAFE Index is designed to represent the performance of large and mid-cap securities across 21 developed markets, including countries in Europe, Australasia and the Far East, excluding the United States and Canada.
MSCI Emerging Markets Index
The MSCI Emerging Markets Index represents a free float–adjusted market capitalization index that is designed to measure equity market performance of emerging markets. Emerging markets countries include: Argentina, Brazil, Chile, China, Colombia, Czech Republic, Egypt, Greece, Hungary, India, Indonesia, Korea, Malaysia, Mexico, Pakistan, Peru, the Philippines, Poland, Qatar, Russia, Saudi Arabia, South Africa, Taiwan, Thailand, Turkey, and the United Arab Emirates.
S&P 500 Index
The S&P 500 gauges large-cap US equities. The index includes 500 leading companies and captures approximately 80% coverage of available market capitalization.
Sean Duffin - Sean Duffin is a Senior Investment Director for the Capital Markets Research Team at Cambridge Associates.
About Cambridge Associates
Cambridge Associates is a global investment firm with 50+ years of institutional investing experience. The firm aims to help pension plans, endowments & foundations, healthcare systems, and private clients achieve their investment goals and maximize their impact on the world. Cambridge Associates delivers a range of services, including outsourced CIO, non-discretionary portfolio management, staff extension and alternative asset class mandates. Contact us today.