Long Bond Performance Does Not Signify an Impending Debt Crisis

Long-dated government bonds have come under pressure in recent months, at least on a relative basis. Sections of the financial media have interpreted this as evidence of an impending fiscal crisis and a resurgence of so-called bond market vigilantes seeking to impose fiscal discipline on governments. In this research note, we aim to separate signal from noise in these moves, drawing on market data and institutional trends. We examine evolving supply/demand dynamics, structural changes among key investors, regulatory and demographic shifts, and country-specific developments. Given this context, we attribute most long-dated bond performance to unique supply/demand dynamics within that segment of the yield curve, rather than to episodes of acute fiscal panic. While secular macro drivers, such as demographics, could place further upward pressure on government bond yields – especially at the long end – we believe they will continue to behave defensively during deflationary shocks.
The case of the United States
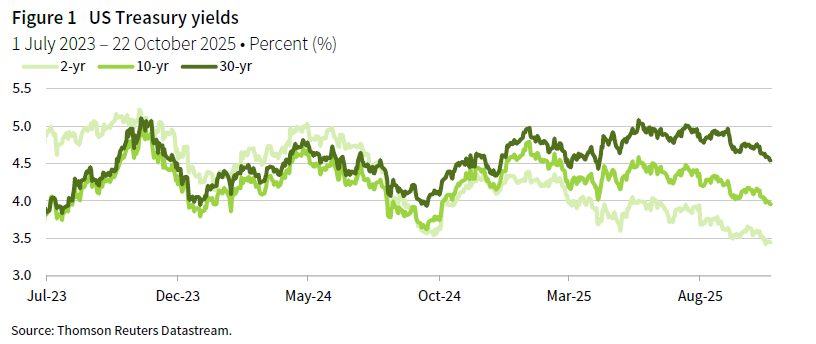
To begin, we focus on the United States, the largest market globally with significant global spillovers. The US yield curve has been steepening for some time, having bottomed out midway through 2023. Since then, most of the steepening has occurred between the two-year and ten-year segments, but in 2025, the more notable steepening has taken place between the ten-year and 30-year parts of the curve (Figure 1). To put these moves in perspective, it is useful to examine how these yield curve segments have behaved historically.
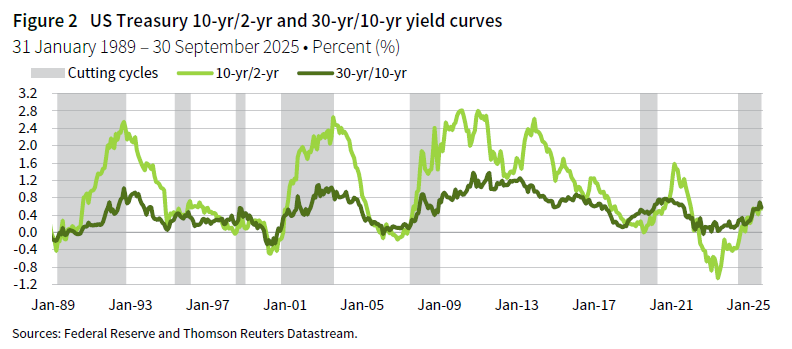
Historically, both portions of the yield curve have tended to follow a somewhat consistent path during monetary policy cycles, steepening into and during rate cutting cycles before flattening as the expansion matures. In the current cycle, the yield curve’s behaviour has been broadly consistent with past episodes (Figure 2). The ten-year/two-year curve remains at untroubling levels and is not indicative of fiscal stress. From the perspective of those who harbour fiscal concerns, the 30-year/ten-year segment has arguably steepened a little more than is typical at this stage of the cutting cycle, and at a slightly speedier rate than during the COVID-19 cycle. Still, the speed of the recent steepening is more in line with the two prior cycles.
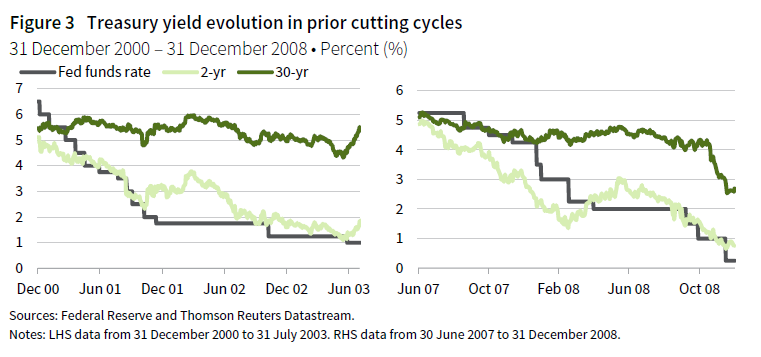
Much of the recent concern about long-dated bonds stems from the fact that, until last month, the 30-year yield had not been very responsive to increased easing priced in at the short end, especially compared to the last cutting cycle. However, the previous cycle was unique: the economic deterioration caused by the COVID-19 pandemic was atypical, with an almost complete hiatus in economic activity and significant uncertainty about normalisation. As a result, 30-year yields declined much more in sympathy with short yields during the steep portion of the rate cutting cycle, aided by quantitative easing (QE). Historically, though, it is normal for 30-year yields to react little as cuts are priced in during more typical cycles, since many economic cycles will occur over a 30-year bond’s life, reducing sensitivity to any single cycle (Figure 3).
Drivers of recent 30-year performance
To the extent that there has been some moderate excess underperformance at the 30-year point, what explains it? One hypothesis is that inflation expectations are rising in response to recent economic or political developments. Tariffs are indeed putting some upward pressure on US inflation. The probability that Federal Reserve independence could be undermined appears to be rising, potentially leading to unjustified easing and higher future inflation. A final supposition – itself related to debt load concerns – is that central banks may target higher inflation rates over time, whether implicitly or explicitly, to reduce debt burdens in real terms (Figure 4).
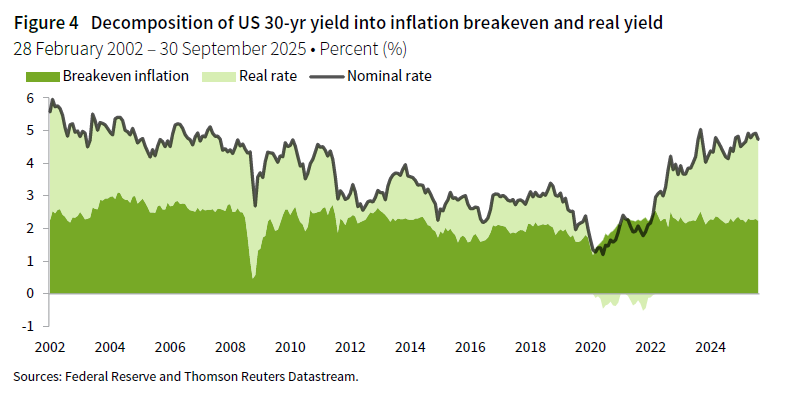
All these conjectures are plausible, but recent market action does not support them. Thirty-year breakeven inflation rates have traded in a band between 2.1% and 2.5% for the past three years. At a current level of 2.21%, they are firmly in line with their historical median. Instead, the recent rise in long-dated yields has been driven by a rise in real rates.
Relative supply/demand dynamics have played a significant role. On the supply side, it is politically difficult for governments to engage in meaningful fiscal consolidation. Indeed, the inability to do so has led to the fall of four governments in France in just over a year. As a result of this dynamic, expectations for more consistently elevated budget deficits and greater government bond supply have grown in recent quarters. In the United States, for instance, the International Monetary Fund (IMF) expects the fiscal deficit to remain at or above 5.5% through 2030.
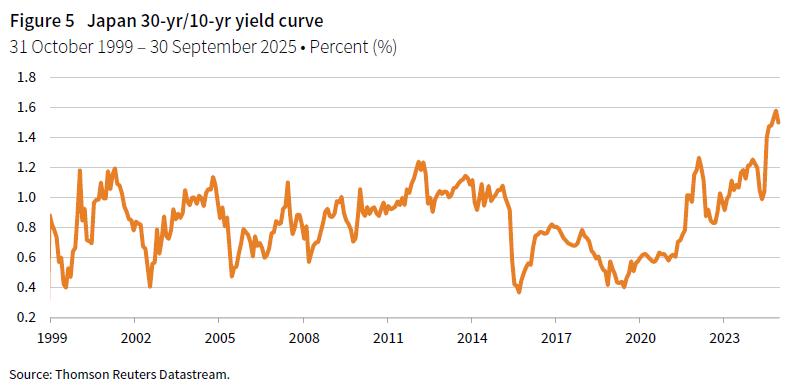
On the demand side, buyers of long-dated bonds typically differ from those of shorter-dated debt, with pension funds and insurers being notable examples. Regulatory reforms in these industries have significantly influenced long-dated bond performance. Japanese insurers, for example, had been increasing their holdings of long-term Japanese government bonds (JGBs) to meet new solvency requirements. However, after meeting those targets, they have recently become net sellers, contributing to record-high 30-year JGB yields (Figure 5). In the Netherlands, the €1.5 trillion Dutch pension industry is transitioning from a defined benefit to a defined contribution system, leading to asset allocation changes and the sale of, according to Rabobank estimates, about €127 billion in long-dated sovereign debt to increase allocations to higher-returning assets. In the United Kingdom, defined benefit pension schemes’ aggregate funded status has been in surplus long enough that de-risking (increasing allocations to long-dated debt to match liabilities) has decelerated. While these developments are most impactful domestically, they have global spillover effects.
A final factor is that central banks are no longer price-insensitive buyers of government debt. Through QE, they built up large portfolios of domestic government debt to improve monetary policy transmission when policy rates were low. Once further easing was no longer required, they shifted to rolling over maturing debt. More recently, central banks have been shrinking their balance sheets. In the United States, up to $5 billion worth of Treasurys roll off the balance sheet each month. The Eurozone, Japan, and the United Kingdom, have been more aggressive: the Eurozone allows a greater proportion of debt to roll off, while the Bank of Japan and the Bank of England (BOE) have been actively selling down their portfolios.
Lower liquidity at the long end of the curve means these policy decisions have likely had a disproportionate impact on long-dated yields, especially given simultaneous demand-side changes. However, these policies are not set in stone, and policymakers can adjust both the quantity and distribution of bond sales and reinvestments in response to market conditions 1 .
Focus on the United Kingdom
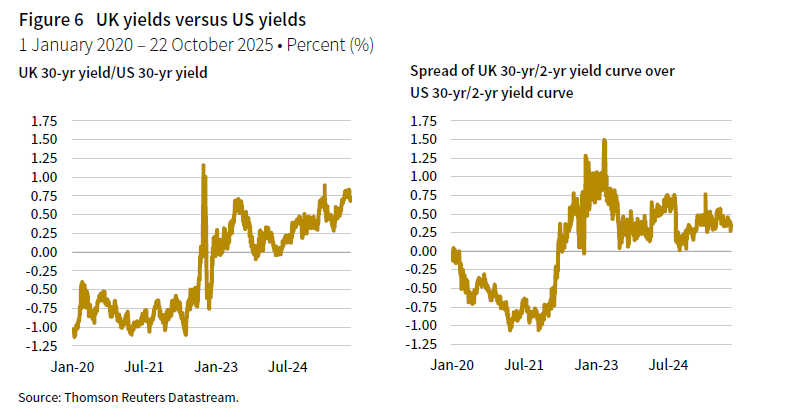
Rising long-dated bond yields are an international phenomenon, not one confined to the United States. Long yields are rising and yield curves are steepening in all major bond markets. However, discussions of potential fiscal crises have focused most prominently on the United Kingdom. Superficially, this is understandable: the 30-year yield in the United Kingdom recently reached levels not seen since the late 1990s, and the UK 30-year yield spread versus the United States has also been rising (Figure 6). However, this overlooks the diverging path of short rates in both markets. Normalising for this by looking at the relative shape of the yield curves shows that the UK yield curve is in the middle of its range relative to the United States for the past 3.5 years. UK two-year yields have been stable to marginally declining in recent months, rather than spiking as they did after the September 2022 budget.
This suggests the United Kingdom is not in an acute market funding crisis, further evidenced by the recent ten-year gilt syndication being ten times oversubscribed and the resilience of sterling during these moves. This is less surprising when considering that UK government debt, while elevated at around 100% of GDP, is below all G7 peers except Germany. By 2030, the UK budget deficit is forecast to be lower than all G7 nations except Canada, according to IMF projections. While there is risk of fiscal slippage, this applies to most peers. Year-to-date GDP growth in the United Kingdom has also outstripped all G7 peers.
Despite these relatively positive metrics, the United Kingdom faces issues that cast a shadow on debt sustainability, foremost among them are supply-side constraints. Strong relative growth notwithstanding, potential growth is being crimped by underinvestment (especially post-Brexit), labour market rigidities (post-Brexit and aggravated by COVID-19), and elevated housing and energy costs. Progress on these supply-side issues would have a twofold payoff: boosting growth (improving debt sustainability via both lower deficits and a higher GDP denominator) and lowering inflation, which is currently sticky due to these bottlenecks. This would allow the BOE to cut rates more aggressively, reducing gilt interest rates.
Holding two fiscal events each year draws unnecessary focus to UK fiscal issues, which are not necessarily worse than peers on many metrics. The memory of the September 2022 budget debacle also plays a role. Negative perception is aggravated by the fiscal juggling act required to meet self-imposed fiscal rules, resulting in policy uncertainty and constraining the ability to draw up a compelling growth plan. Perception of stability is important for a current account deficit country like the United Kingdom, which relies on foreign capital inflows. All told, the United Kingdom is not in a debt crisis, and the flexibility of the BOE and Debt Management Office to moderate the size and distribution of bond sales should help smooth over any demand indigestion for long-dated bonds. Nonetheless, the upcoming Autumn Budget could engender fresh rate volatility, and markets will look for a credible deficit reduction plan.
Conclusion
Rising issuance, elevated debt levels, and cyclically rising interest rate burdens have understandably brought debt sustainability to the forefront of market participants’ minds. However, any even moderately disorderly moves in yields have been restricted to the very long end of the yield curve, not further down at the ten-year point, for instance. This suggests the drivers are more idiosyncratic to the long end, rather than a generalised debt-sustainability trade. The fact that the 30-year performance has not discriminated against Germany further indicates that imminent fiscal fears are not the primary driver. Though Bund issuance will increase in coming years, German debt sustainability is not in question in the manner of other markets.
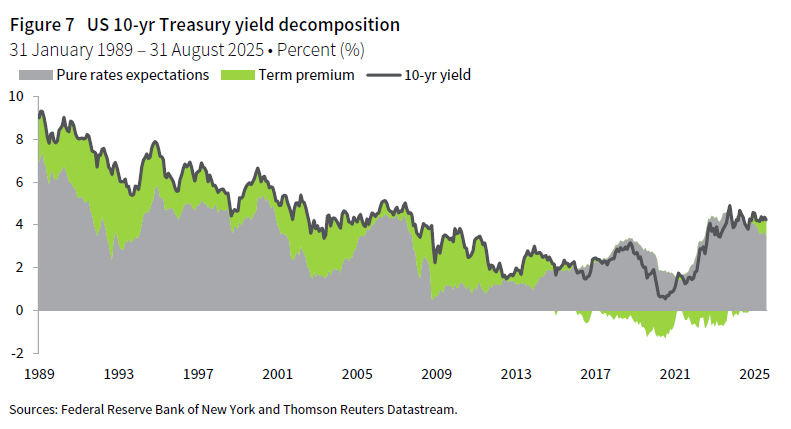
While markets are not being driven by fiscal crisis fears, secular shifts are occurring in bond markets. We have moved from a period of consistently negative term premium (the extra return demanded to hold a long-term bond rather than rolling short-term bonds) to the return of positive term premium (Figure 7). This likely reflects a combination of factors: diminished deflationary tail risks, a more volatile inflationary profile, shifts in the supply/demand balance (increased issuance versus quantitative tightening and demographic shifts), and increased political and geopolitical volatility. These trends may prove durable. It is also possible that neutral interest rates will rise should AI deliver the productivity gains its proponents suggest. These secular changes could eventually aggravate debt load concerns in developed markets, given their already unsustainable trajectory.
While investors should remain vigilant regarding debt sustainability, markets are not beginning to price in a fiscal crisis in our view. Furthermore, given how well telegraphed many of the risk factors listed above have been for some time, it would be premature, we think, to forecast that such a crisis will unfold imminently. Indeed, this month and last, bonds across the yield curve have shown they retain the propensity to rally on the back of slowing macroeconomic data. This quality remains highly valued and underpins our conviction that high-quality fixed income should continue to play a core role in portfolios. At present, with valuations broadly in a fair-value range, we recommend maintaining a neutral duration stance and waiting for yields to become more attractive relative to fundamentals before considering an extension of duration.
Mark Sintetos also contributed to this publication.
Footnotes
Thomas O’Mahony, CFA - Tom O’Mahony is a Senior Investment Director at Cambridge Associates.
About Cambridge Associates
Cambridge Associates is a global investment firm with 50+ years of institutional investing experience. The firm aims to help pension plans, endowments & foundations, healthcare systems, and private clients achieve their investment goals and maximize their impact on the world. Cambridge Associates delivers a range of services, including outsourced CIO, non-discretionary portfolio management, staff extension and alternative asset class mandates. Contact us today.