Higher Rates Are a Headwind, but US Housing Rests on Solid Foundations


The US housing market has been on a tear in recent years, supported by low interest rates, favorable supply/demand dynamics, and a recent boost from the pandemic-related demand for more space. Investors interested in gaining exposure to the asset class are seeing their choices expand. This publication provides an update on some of the macro forces supporting housing and describes different asset classes that offer exposure to US housing. In preview, some of the liquid options to invest in US housing offer reasonable valuations, but investors face implementation challenges including the limited number of REITs focused on the space, as well as the lack of passive equity products directly focused on the sector. In contrast, private markets offer larger dedicated funds from both an equity and debt perspective, though competition is heating up and may weigh on returns. Inflation hedging potential is an added benefit of these exposures, but rising mortgage rates are already curbing affordability and thus are likely to slow the current elevated pace of home price appreciation.
House Price Trends and Outlook
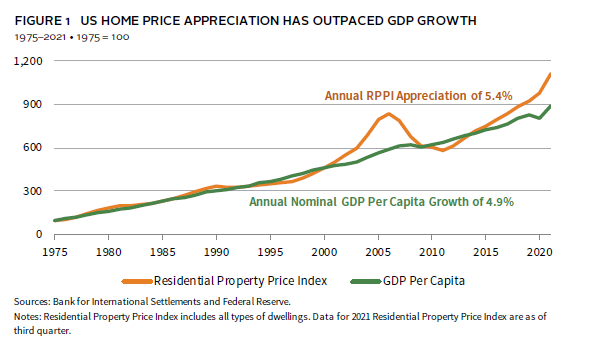
US home prices have risen around 19% over the past 12 months, well above their long-term trend, which historically has tracked economic growth. Low interest rates and thus elevated affordability supported demand, with the benchmark 30-year fixed rate mortgage hovering around 3% for most of 2021. While affordability can be measured in many ways, the National Association of Realtors’ (NAR) widely cited Housing Affordability Index metric indicates a median-income family (that put 20% down) had around 40% more income than required to comfortably cover the mortgage on a median-priced ($357k) single-family home in January. The caveat? This cushion has shrunk by around 40 percentage points over the last 12 months as rates have risen and home price appreciation has rapidly outpaced incomes (Figure 1).
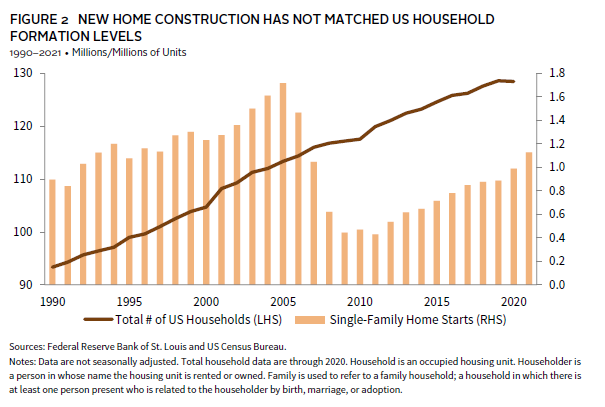
A shortage of newly built homes has fueled higher prices. As shown in Figure 2, while household formation levels quickly recovered after the Global Financial Crisis (GFC), new home construction did not. As risk aversion and tighter lending curbed both supply and demand, new home construction levels fell around 75% from 2005 to 2011; to this day supply remains below pre-GFC levels. While the housing market was oversupplied (at least in some cities before the crisis), the recent run-up in prices suggests undersupply may be causing shortages. Researchers at Freddie Mac and Realtor.com put the resulting shortage of single-family homes in the United States at somewhere around 4 to 5 million.
While these forces (elevated affordability and structural undersupply) had been in place for some time, the pandemic may have been the final ingredient to create the perfect storm for the recent melt-up in home prices. As more Americans worked from home their demand for space increased, especially among millennials who may have been postponing the move out of apartments (or even from their childhood homes).
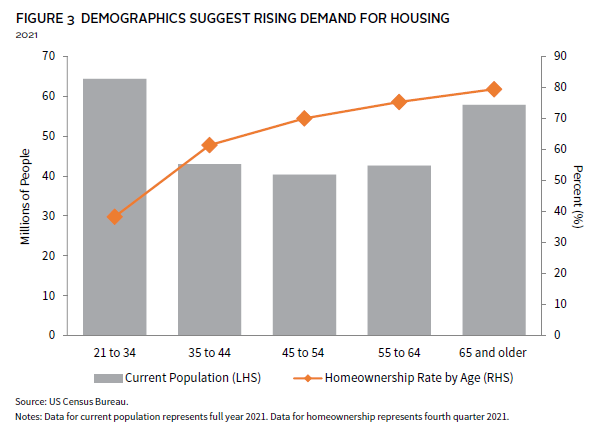
The ongoing lack of new construction and a historically low number of existing homes for sale may continue to support home prices for some time. Demographic patterns may also come into play (Figure 3). There are currently around 65 million Americans between ages 21 and 34, some of whom have postponed homebuying due to elevated debt levels or the decision to delay marriage. While trends can change, historically homeownership rates spike for this group as they enter their mid-30s and reach milestones like marriage.
However, worsening affordability is a headwind that may get worse before it gets better, given the Federal Reserve has embarked upon a tightening cycle in early 2022. The flipside is that overall household debt levels relative to GDP have dropped since the GFC and savings are elevated due to recent transfer payments and rising equity markets. Weighing all these dynamics, analysts are calling for continued but more muted appreciation, with economists at Fannie Mae, for example, calling for home prices to rise around 7% in 2022.
Housing-Related Investment Opportunities
Investors that believe US home prices will be well supported by favorable supply/demand dynamics have a variety of ways to gain exposure to the asset class. Liquid options include REITs that focus on single-family rentals (SFRs), equities of homebuilders, and credit instruments, such as residential-backed mortgage bonds. Private markets offer a variety of opportunities including dedicated SFR strategies, land-focused strategies that provide the raw material (land) to homebuilders, and credit funds specializing in everything from loans to developers to nonperforming home loans.
SFR funds are a “pure-play” way to get exposure to pools of single-family homes and allow investors to benefit from long-term trends in home price appreciation. This is a relatively new asset class that took shape out of the GFC as a handful of firms began to aggregate portfolios of foreclosed homes and bring an institutional approach to the property management function. Despite ramping up their purchases in recent years, the combined share of the fragmented US home rental market held by both public (REIT) and private SFR funds is fairly small. Of the estimated 17 million rental homes in the United States, less than 2% are estimated to be owned by institutional landlords. (The largest publicly traded SFR REIT (Invitation Homes) owns around 80,000 homes, while the largest private equity landlord (Progress) owns a similar amount.) Still, this share is growing as operators expand and realize operating synergies in areas like acquisitions, renovations, and tenant management.
The SFR model has several attractive attributes for investors. Occupancy rates are higher than in many commercial property markets, boosting landlord pricing power. Tenants in single-family homes tend to have higher renewal rates than those in apartments, reducing operating costs for SFR operators. One explanation is that SFR tenants are more likely to have children than multifamily tenants and often choose single-family homes based on proximity to good schools. Putting aside issues of monthly mortgage payment affordability, SFR operators are also seeing their opportunity set expand as individuals or families that might have been homebuyers in another cycle struggle to come up with large down payments now required to buy a home. Some tenants also prefer the flexibility of renting for career or other reasons. The flipside is that valuations for SFR landlords are getting more expensive; cap rates compressed around 200 basis points over the last six years as the industry demonstrated its scalability and investability.
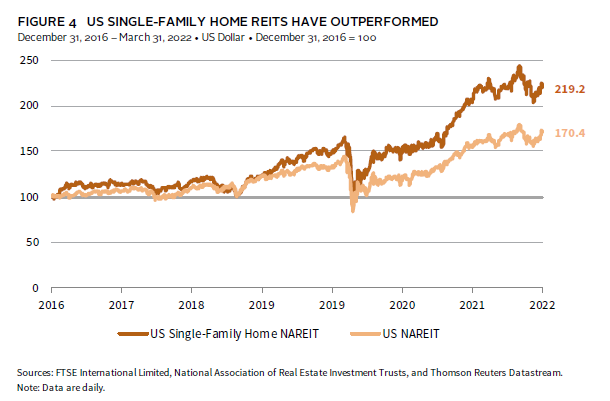
Still, investors concerned about inflation have been attracted by the exposure of SFR landlords to rising home prices, as well as their ability to push through annual rent increases. Shelter is the largest component of both US headline consumer price (33%) and core consumer price (42%) inflation; this statistic is derived from underlying components like actual- and owner-equivalent rents. Last year US single-family home rents rose around 12%, with even higher increases seen in some cities. For investors seeking more liquid exposure, the catch is that there are only a handful of publicly traded SFR REITs, and valuations (e.g., price to funds from operations) have risen as publicly traded SFR REITs have handily outperformed broader REIT industries in recent years (Figure 4).
For investors able to lock up capital, private funds specializing in SFR or diversified real estate funds that offer this as a sleeve may also be compelling. As with their publicly traded cousins, these funds have rapidly scaled operations and improved business models in recent years. In return, capital has poured into the sector, with an estimated $45 billion of fundraising in 2021 alone. While this raises inevitable questions around headwinds to returns, for context this inflow represents only around 1.5% of the estimated $3.4 trillion size of the SFR market. Landlords are constantly tweaking business models and expanding their opportunity set. Recognizing that some markets suffer from a shortage of existing homes to buy and rent out, in recent years many private SFR landlords have partnered with homebuilders to launch so-called build-to-rent (BTR) strategies. BTR represented around 5% of new single-family home starts from 2008–20, more than double its share in previous decades. Given home price appreciation may slow in the years ahead due to rising interest rates, one consideration around private funds is their requirement to lock up capital for multi-year commitments. However, the lock-up periods for these private funds are typically far shorter than for a traditional private equity fund.
Every investment has risks, and one potential headwind for both private and public SFR landlords is political/headline risk. Over the course of the pandemic, some tenants struggled to pay rent and politicians have been closely watching how SFR (as well as apartment) landlords have responded. Increased oversight could grow into a more serious headwind or at a minimum generate unwanted headline risk for investors. It is worth noting that rent control measures are being considered by a growing number of local governments. The flipside is that large SFR landlords have a greater incentive to maintain properties and handle tenant complaints fairly than smaller competitors and tend to run more efficient operating models, which in theory should translate into lower rents. The BTR model also is more insulated from these headwinds (at least in theory) as it serves to alleviate the housing shortage.
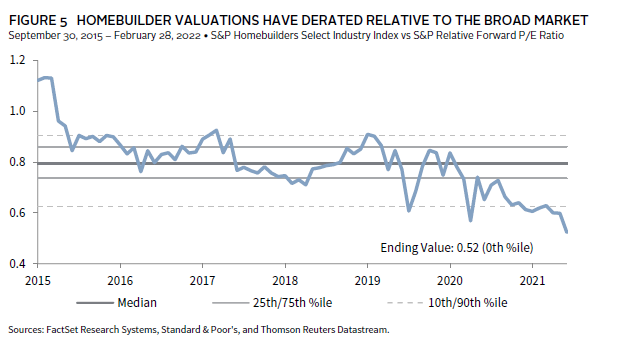
Publicly traded homebuilder shares are another way to gain exposure to the strong US housing market. Shares of these companies have slightly outpaced the broader equity market in recent years. The rebound in home supply has been a tailwind for margins, as have rising home prices. Despite this performance, the sector has derated compared to the broader market, with the S&P homebuilder index now offering a nearly 50% discount to that of the broader market.
The sector derating shown in Figure 5 may seem difficult to square with strong recent operating performance. Putting aside the increase in overall US stock valuations, one explanation may be investor concern over near-term headwinds facing the sector, including rising materials costs, labor shortages, and a lack of suitable land for development in some cities. There is also the issue of rising prices/mortgage rates and whether at some point would-be homeowners just decide to stay put in an existing home or rental accommodation. However, another explanation may simply be that the sector is highly cyclical, and some investors are wary of paying for peak earnings even if via a multiple, which is low on an absolute (and relative) basis.
Many homebuilder stocks are small- or mid-cap companies, which has led some custom index providers to blend them with related sectors to create liquid passive benchmarks. This can create challenges for investors attempting to create a targeted passive exposure. Using the S&P Homebuilders Select Industry Index as an example, only about 30% of its market cap consists of homebuilding companies, with the remainder composed of sub-sectors like building products and specialist retailers. Looked at another way, one could argue that higher home prices boost valuations and earnings for homebuilder stocks, but fail to benefit via a custom index if gains on actual homebuilder stocks are offset by weakness in other index buckets like retailers or home furnishing specialists.
Finally, credit markets also offer numerous opportunities to gain exposure to robust US housing fundamentals, through everything from agency mortgage-backed securities to private funds that specialize in segments such as fix and flip loans, lot financing for builders, and non-performing mortgage loans. The latter seems of particular interest, given rising home prices have reduced loan-to-value ratios and often provide strong incentives for homeowners to become current on overdue loans. Pools of nonperforming mortgage loans are regularly sold by both government-backed housing finance agencies, as well as commercial banks, offering credit funds a variety of ways to gain exposure. As with many other housing assets, investors can choose both from dedicated strategies and multi-strategy credit funds that will invest in these pools when the opportunity seems attractive.
Conclusion
Strong home price appreciation means many housing-related assets have performed well in recent years. Looking forward, we believe assets like homebuilder equities remain supported from a valuation and fundamentals perspective, though these assets can be difficult to access via indexed or passive exposures. SFR landlords should continue to see margin support from growing economies of scale and revisions to business models, which include the expanding BTR model. Exactly which housing-related asset will perform best in future years is hard to predict as unknowns include interest rates, economic growth, and risk premiums demanded by equity investors. Generally, SFR landlords are partially hedged against rising rates as the resulting drop in affordability can increase rental demand. Meanwhile, higher rates or ongoing commodity price pressures might work against the homebuilders if they curb new demand or depress margins. SFR landlords provide the most direct exposure to rising home prices (and rents) and thus offer the most robust inflation hedging potential, though none of these assets may be especially effective in hedging against recent increases in commodity prices.
Index Disclosures
FTSE Nareit All Equity REITs Index
The FTSE Nareit All Equity REITs Index is a free float–adjusted, market capitalization–weighted index of US equity REITs. Constituents of the index include all tax-qualified REITs with more than 50 percent of total assets in qualifying real estate assets other than mortgages secured by real property.
S&P 500 Index
The S&P 500 gauges large-cap US equities. The index includes 500 leading companies and captures approximately 80% coverage of available market capitalization.
S&P Homebuilders Select Industry Index
S&P Select Industry Indexes are designed to measure the performance of narrow GICS® sub-industries. This index comprises stocks in the S&P Total Market Index that are classified in the GICS homebuilding sub-industry.
Wade O’Brien - Wade O’Brien is a Managing Director for the Capital Markets Research team at Cambridge Associates.
About Cambridge Associates
Cambridge Associates is a global investment firm with 50+ years of institutional investing experience. The firm aims to help pension plans, endowments & foundations, healthcare systems, and private clients achieve their investment goals and maximize their impact on the world. Cambridge Associates delivers a range of services, including outsourced CIO, non-discretionary portfolio management, staff extension and alternative asset class mandates. Contact us today.