2026 Outlook: Public Equity Views


Investors should overweight global ex US equities in 2026
by Thomas O’Mahony
Global ex US equities have outperformed US equities by 4.4 percentage points (ppts) in local currency terms so far in 2025 and by 11.2 ppts in USD terms. We believe that conditions are in place to see that outperformance trend continue in 2026 and we recommend that most investors modestly overweight global ex US equities from US equities. This view is founded on attractive relative valuations, improving regional growth catalysts outside the United States, and rising concentration within US equities.
There are two facets to the valuation proposition of overweighting global ex US equities from US equities, the first of which is the still-elevated valuation of the US dollar. As detailed earlier in this outlook, we expect the dollar to decline further in 2026. Despite some depreciation in 2025, the dollar remains 32% above its median real valuation based on current equity weights. While a declining dollar does provide some earnings uplift for US equities via the translation impact on their non-US earnings, the overall net impact should still be a headwind for the performance of USD-denominated assets when translated into other base currencies.
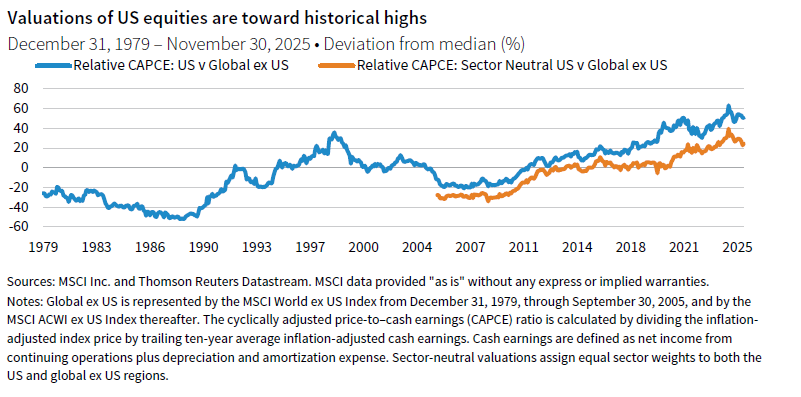
The second leg of the valuation argument rests on the historically rich relative valuation of US equities. As of the end of November, the cyclically adjusted price-to–cash earnings (CAPCE) ratio of the MSCI US Index was 2.2x greater than that of the MSCI ACWI ex US Index, representing a 50% premium above their long-run median relative valuation. Of course, a portion of this is attributable to the greater weight of more profitable tech stocks in the US index, which justifies a higher valuation. However, the broad valuation point remains valid even when looked at from an equal-sector weighted basis, whereupon the relative CAPCE is 25% higher than its median value. Valuations are powerful predictors of returns in the long run. Though their usefulness in forecasting short-run returns is weaker, they nonetheless succinctly express where pockets of both opportunity and risk may lie.
The global ex US category is not, of course, a monolith, but rather a diverse grouping of countries with distinct drivers. In Europe, while underweights to the high-performing IT and communications services sectors were a headwind to performance, financials—the region’s largest weighting—outperformed every sector of the ACWI. This outperformance was significantly aided by rate cuts delivered in the region and the resultant steepening of yield curves. Nonetheless, a significant valuation discount persists versus the United States. With lending data to both the household and corporate sectors picking up, this outperformance should have further to run in 2026. Indeed, the intention of Germany, Europe’s recent laggard, to materially increase fiscal spending should lift all boats to an extent in 2026, even as certain peripheral economies, such as Spain, have performed strongly.
Meanwhile, in Japan a coordinated push for enhanced corporate governance is ongoing, led by the Tokyo Stock Exchange (TSE). Its initiatives emphasize improving capital efficiency, pushing companies with low price-to-book ratios to disclose credible improvement strategies, and unwinding legacy cross-shareholdings. This has prompted an increase in shareholder returns through share buybacks and dividends. Concurrently, the nation appears to be emerging from its multi-decade disinflationary environment, with a virtuous wage/price dynamic gaining traction. This, alongside a tight labor market, is bolstering nominal wage growth, providing a tailwind for domestic consumption and nominal equity prices. Expectations of further fiscal easing from new Prime Minister Sanae Takaichi should also support these themes.
Emerging markets (EM) economies stand to particularly benefit from a continued decline in the dollar. A weaker greenback generally eases EM debt burdens, creating space for governments to use fiscal policy to support growth. Stronger local currencies also curtail imported inflation, allowing domestic central banks to run less restrictive monetary policy. Emerging markets should also benefit from a likely continued, if gradual, decline in trade tensions.
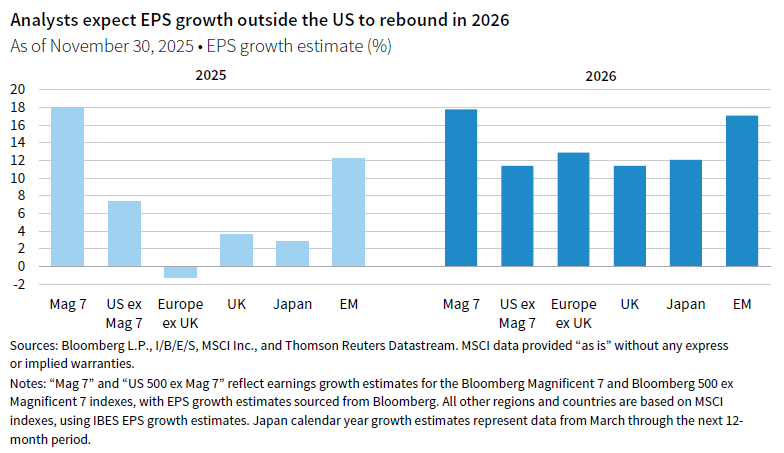
The earnings per share (EPS) growth of the US equity market is on course to thoroughly outstrip that of most other global equity markets in 2025, aided especially by the growth generated by the Magnificent 7 companies. It is perhaps unsurprising that a wide valuation differential can persist in such an environment. However, if the currently forecasted convergence in EPS growth rates across regions occurs in 2026, valuations outside the United States will look much more appealing by comparison and price pressures will emerge to narrow the value gap. EPS growth in 2025 also highlights the potential vulnerability of US equities to weakness in the tech sector (and tech-adjacent industries), with concentration risk having increased significantly, as discussed earlier in this outlook. As a result, earnings disappointment could result if headwinds impact just a handful of firms. Furthermore, the exposure of US equities to a narrow slate of sectoral drivers, particularly the AI story, increases the idiosyncratic vulnerability of the index to a dampening of enthusiasm toward that theme.
Of course there are risks surrounding this view. In the first instance, it could transpire that the US economy proves more resilient than we expect. Secondly, leading US companies in high-growth industries could maintain strong financial and competitive positions, particularly if optimistic projections regarding AI adoption are validated, attracting further investor capital. Nonetheless, we view the cumulative probability of these scenarios as being less likely than the alternatives. As a result, we expect global ex US equities to outperform US equities in 2026.
Investors should overweight developed markets small-cap equities in 2026
by Sean Duffin
Both US and non-US DM small-cap equities are positioned to outperform their larger-cap counterparts in 2026, supported by a convergence of attractive valuations, solid fundamentals, and favorable macro and policy dynamics—though the relative influence of these factors varies between the two blocs.
The outlook for small-cap equities is shaped by several key macroeconomic trends, most notably the ongoing realignment of the international trade order. The US tariff policy introduced in 2025 has primarily affected trade between the United States and other countries, rather than trade among non-US economies. The United States now runs an average effective tariff rate of 17%, compared with a rate around 2% at the start of 2025. With these barriers in place, small-cap companies in non-US markets may be better positioned to grow earnings, as their limited reliance on US consumers makes them less vulnerable to the potential negative effects of US tariffs than their large multinational counterparts.
Recent and ongoing policy actions further bolster the case for small-cap equities. In the United States, anticipated policy rate cuts could loosen credit conditions, benefiting small-cap companies that typically carry more debt than large caps. Newly enacted tax legislation—including more favorable interest expense deductions—could also support small-cap earnings. The 2025 One Big Beautiful Bill Act reverts the interest expense deduction calculation to EBITDA for all companies subject to the interest limitation rule, allowing most US small caps to deduct more interest expense. While the bill also raises the small business exemption threshold, this exemption applies only to the very smallest firms and does not affect the majority of US small-cap stocks, which are much larger by revenue. Efforts to revive domestic production may also favor small caps, depending on the success of these initiatives.
Outside the United States, recent policy initiatives also look supportive. In Europe, fiscal stimulus measures—such as those passed into law by Germany earlier in 2025—are expected to boost domestic demand and support smaller companies. Japan, which has a sizable number of small-cap companies, is implementing major industrial policy initiatives, including the Green Transformation plan and strategic support for semiconductors and supply chain resilience, and could also benefit from its shift to a more pro-business leadership regime.
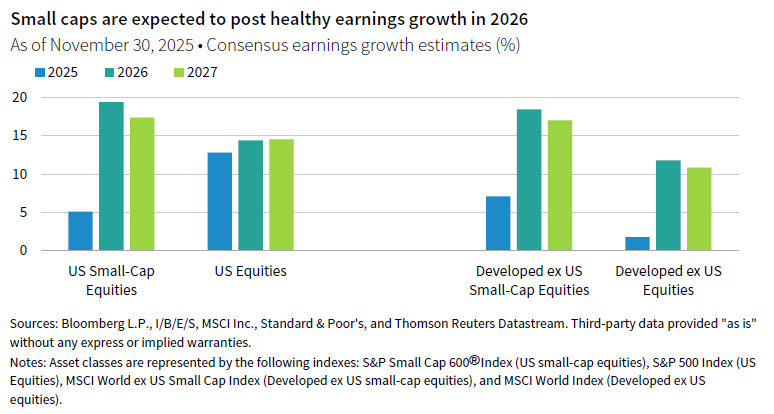
Small-cap equities in both the United States and developed markets outside the United States are also trading at multi-decade discounts relative to mid- and large-cap peers, based on normalized price-earnings ratios. Despite these steep discounts, small-cap companies have not experienced the kind of fundamental deterioration that would warrant such low valuations. In fact, small caps have delivered resilient earnings growth compared to large caps, particularly outside the United States. Looking ahead, consensus estimates point to a meaningful acceleration in small-cap earnings growth across regions in 2026 and 2027, outpacing their larger-cap counterparts. This robust outlook suggests that current valuation discounts are not justified by fundamentals.
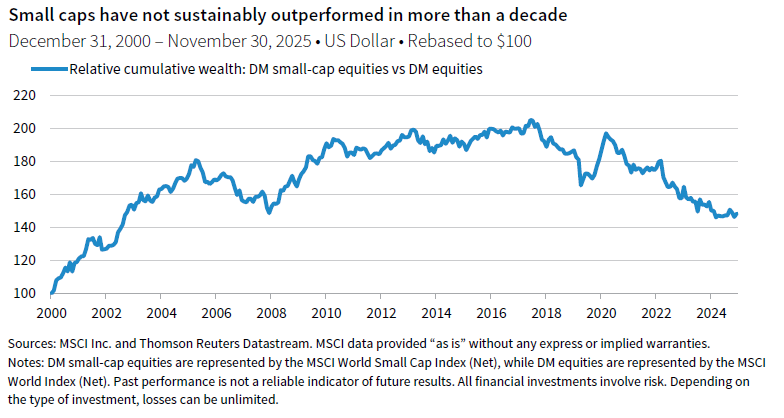
Over the past 25 years, in aggregate, DM small caps have delivered an average annual excess return of 1.7 ppts over large caps, primarily driven by strong performance from the end of the tech bubble in 1999 through 2011. This period was marked by robust performance in the industrials, materials, and financials sectors. After a prolonged era of mega-cap tech dominance, investor appetite could very well broaden. Small caps’ greater representation in sectors, such as industrials and materials, positions them to benefit from trends like reshoring, supply chain diversification, and industrial policy—particularly in Europe and Asia. The higher domestic revenue exposure of small caps, which previously insulated them from global trade frictions and currency volatility, remains a relevant advantage amid ongoing geopolitical uncertainty.
Taken together, the outlook for US and non-US DM small-cap equities is compelling. Wide and unjustified valuation discounts, prospects for stronger earnings growth and multiple expansion, supportive macro and policy tailwinds, and favorable sector dynamics all point to significant outperformance potential in the coming year.
Investors should overweight Latin American equities in 2026
by Capital Markets Research
EM equities have performed strongly in 2025 and are on track to outperform developed markets for the first time in five years. While gains have been broad-based, Latin America (LatAm) stands out, delivering a 53% year-to-date return and outpacing other major EM regions. We expect LatAm offers further outperformance potential, supported by deeply discounted equity and currency valuations, solid momentum, and improving macroeconomic conditions.
The broader EM equity outlook is more constructive than in recent years, driven by two key factors: a weakening US dollar and the Fed’s renewed rate-cutting cycle. Although the US economy is slowing and the labor market has softened, a recession is not our base case. Historically, non-recessionary rate-cutting cycles have provided a favorable backdrop for EM stocks. This environment supports our recommendation to overweight global ex US equities (including emerging markets) relative to the United States, with a particular preference for LatAm within emerging markets.
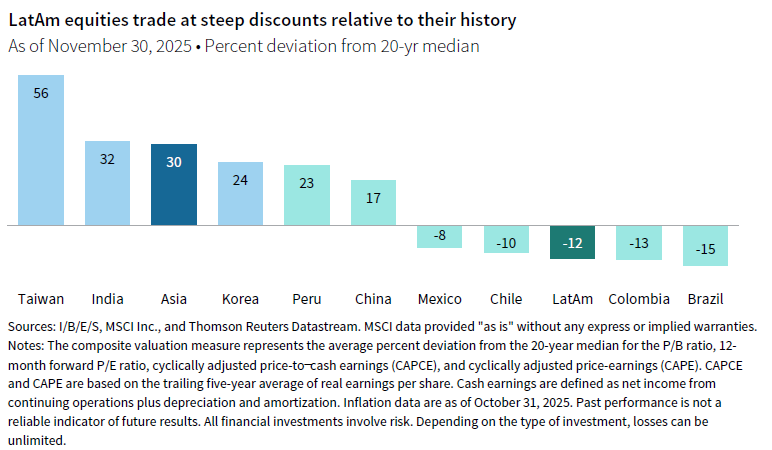
LatAm has been underappreciated for many years, with absolute valuations near 20-year lows. Relative to broader EM equities, LatAm now trades at a near record 51% discount, largely due to a sharp divergence from Asia, where valuations have climbed significantly. This de-rating in LatAm reflects factors such as currency depreciation, commodity price weakness, slower economic growth, and political volatility. However, improvements in these areas could set the stage for stronger performance in LatAm equities.
LatAm currencies are attractively valued, with real exchange rates versus the US dollar 11% below their 20-year median. This provides a potential tailwind as global capital seeks undervalued assets amid a weakening US dollar. Additionally, technological innovation—particularly the buildout of AI infrastructure—is likely to increase demand for raw materials, benefiting commodity exporters. As the most commodity export–oriented region within emerging markets, we believe LatAm stands to gain from this trend.
Regional policy dynamics further support economic activity. While interest rates remain elevated, inflation is moderating toward central bank targets, and leading indicators point to continued cooling. As the US Fed eases monetary policy, LatAm central banks may soon follow, which could further stimulate growth. Looking ahead, major elections in 2026—most notably Brazil’s presidential race—could bolster fiscal policy, as spending typically rises in election years.
Performance momentum also makes the region’s entry point compelling. Relative equity performance momentum has rebounded from oversold levels in late 2024, and since then, LatAm equities have outperformed broader EM equities by 11 ppts. Historically, in the six previous cycles of LatAm outperformance, the region has exceeded emerging markets by a median of 84 ppts cumulatively, with cycles typically lasting about three years. If this marks the start of a new cycle, further upside may lie ahead.
The balance of risks to the earnings outlook continues to favor LatAm. The region is relatively insulated from US trade policy, benefiting from some of the lowest effective US tariff rates, unlike EM Asia, where large trade surpluses have attracted scrutiny from the Trump administration. Additionally, LatAm companies generate a greater share of revenues from markets outside the United States compared to their Asian peers.
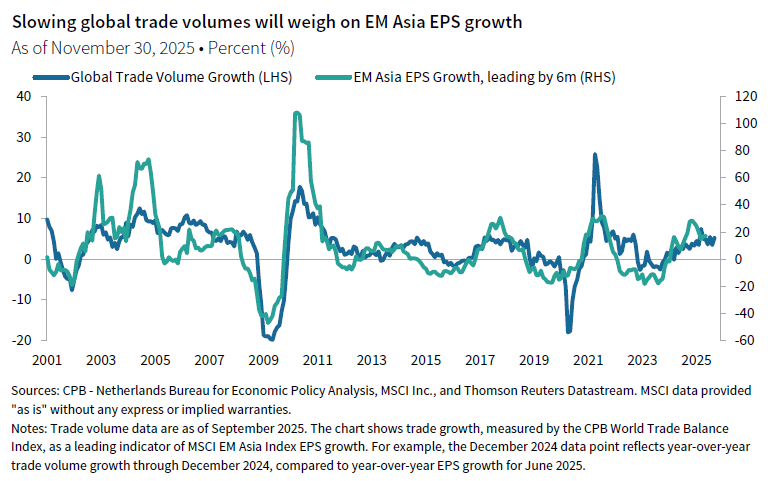
The tariff front-running tailwind that boosted global trade in 2025 is expected to fade, with the World Trade Organization projecting global merchandise volume growth to slow to just 0.5% in 2026. This poses a significant downside risk to Asia’s earnings outlook, where analyst expectations for EPS growth of 19% appear elevated. In contrast, the consensus for LatAm is more measured, with analysts forecasting EPS growth of 5%, compared to a 9% average annualized rate over the past decade. Increasing LatAm exposure within a broader EM allocation can help mitigate Asia’s vulnerability to policy-driven headwinds.
Risks remain, including political uncertainty, fiscal and debt pressures, limited exposure to technology and AI, and the potential for weaker remittances if US growth slows more than expected. However, shifts in some of the structural themes that have hampered LatAm equities in recent years suggest that current valuations offer a compelling margin of safety, already reflecting many of these concerns.
The Bloomberg 500 ex Mag 7 Index is a market capitalization–weighted equity index that tracks the performance of the largest 500 US companies, excluding the so-called “Magnificent 7” stocks (Alphabet, Amazon, Apple, Meta Platforms, Microsoft, Nvidia, and Tesla). The index is designed to provide a representation of the broader US equity market, while removing the outsized influence of these seven large-cap technology companies.
The Bloomberg Magnificent 7 Total Return Index is an equal dollar–weighted equity benchmark consisting of a fixed basket of seven widely traded companies classified in the United States and representing the communications, consumer discretionary, and technology sectors as defined by the Bloomberg Industry Classification System (BICS).
The MSCI ACWI ex US Index captures large- and mid-cap representation across 22 of 23 DM countries (excluding the United States) and 24 EM countries. With 1,966 constituents, the index covers approximately 85% of the global equity opportunity set outside the United States.
The MSCI Emerging Markets Asia Index captures large- and mid-cap representation across EM countries in Asia. The index provides broad exposure to Asian emerging economies by including securities from key markets such as China, India, Indonesia, Korea, Malaysia, the Philippines, Taiwan, and Thailand. It is designed to reflect the performance of the equity universe in this dynamic region, offering investors insights into the economic growth and market developments within Asian emerging markets.
The MSCI World Index represents a free float–adjusted, market capitalization–weighted index that is designed to measure the equity market performance of developed markets. It includes 23 DM country indexes.
The MSCI World ex US Index captures large- and mid-cap representation across 22 of 23 DM countries—excluding the United States. The index covers approximately 85% of the free float–adjusted market capitalization in each country.
The MSCI World Small Cap Index captures small-cap representation across DM countries. The index covers approximately 14% of the free float–adjusted market capitalization in each country.
The MSCI World ex USA Small Cap Index captures small-cap representation across 22 of 23 DM countries (excluding the United States). With 2,192 constituents, the index covers approximately 14% of the free float–adjusted market capitalization in each country.
The S&P 500 Index includes 500 leading companies and covers approximately 80% of available market capitalization.
The S&P SmallCap 600® Index seeks to measure the small-cap segment of the US equity market. The index is designed to track companies that meet specific inclusion criteria to ensure that they are liquid and financially viable.
Sean Duffin - Sean Duffin is a Senior Investment Director for the Capital Markets Research team at Cambridge Associates.
Thomas O’Mahony, CFA - Tom O’Mahony is a Senior Investment Director at Cambridge Associates.
About Cambridge Associates
Cambridge Associates is a global investment firm with 50+ years of institutional investing experience. The firm aims to help pension plans, endowments & foundations, healthcare systems, and private clients achieve their investment goals and maximize their impact on the world. Cambridge Associates delivers a range of services, including outsourced CIO, non-discretionary portfolio management, staff extension and alternative asset class mandates. Contact us today.