2026 Outlook: Diversifier Views
Investors should lean into hedge funds in 2026
by Sean Duffin
Hedge funds remain a vital part of diversified portfolios, and building resilience requires a thoughtful mix of strategies. In today’s environment—marked by elevated dispersion, low correlations, and ongoing policy uncertainty—equity long/short (ELS) managers are especially well positioned. Advances in AI and persistent tariff-related disruptions have driven pronounced outperformance in select sectors, notably technology and communication services, resulting in significant gaps between winners and laggards. Skilled ELS managers can exploit these market inefficiencies and others through both long and short positions, offering the potential for attractive risk-adjusted returns. Given these considerations, investors should consider leaning more than typical into ELS—either through portfolio rebalancing or by adding a new position—as part of a well-diversified hedge fund strategy mix.
The investment landscape is being shaped by a complex interplay of macroeconomic and geopolitical forces, including tariff-related uncertainty, sticky inflation, and evolving labor market dynamics. These crosscurrents are creating opportunities for nimble hedge fund managers. Global macro and other absolute return strategies are well positioned to navigate these challenges, given their flexibility across asset classes and regions. Yet, what distinguishes the current environment is the pronounced sector dispersion and volatility driven by technological innovation and policy shifts—conditions that are particularly favorable for ELS managers, who can capitalize on both broad market trends and stock-specific inefficiencies.
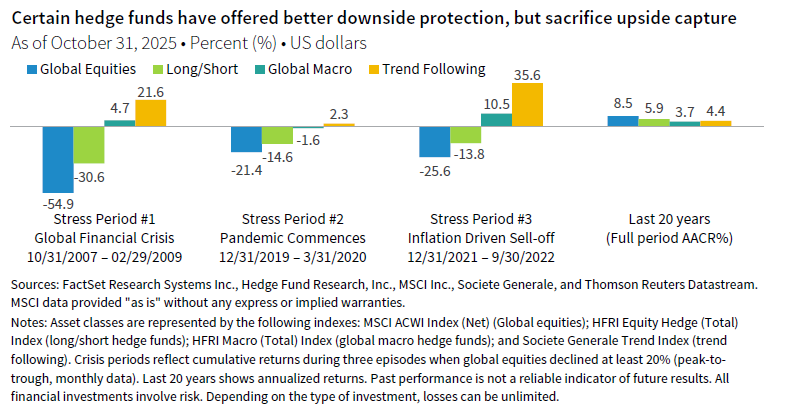
Hedge fund strategies offer distinct trade-offs for investors navigating the uncertainties of 2026. While a recession is not our base case scenario, the potential for episodic volatility and policy-driven market disruptions remains elevated. ELS approaches provide a practical way to position for this environment, offering reasonable defensiveness without sacrificing significant growth potential. Over the last 20 years, ELS strategies have captured about 70% of the equity market’s total gain but have lost roughly half as much as broader equity markets during major drawdowns. In contrast, more defensive hedge fund strategies such as trend-following and global macro have excelled during sustained market stress, providing diversification and crisis alpha, though these strategies have significantly lagged equity markets over the long term. By combining ELS with these and other defensively oriented strategies in a diversified hedge fund allocation, investors can position portfolios to participate in market upside, while maintaining robust protection against extended periods of volatility or unexpected downturns.
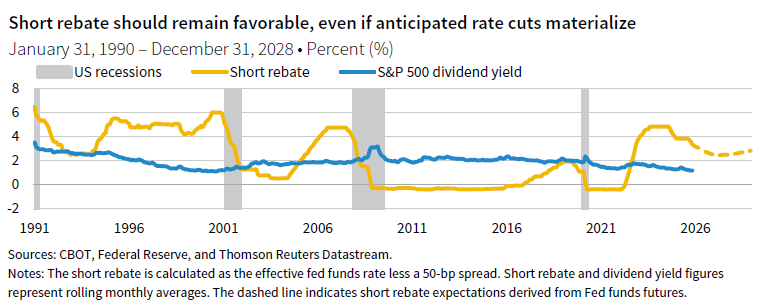
Another supportive factor for hedge funds that short securities is the current level of interest rates, which has increased the short rebate—the interest earned on cash collateral from short sales. While this is a structural feature of the strategy rather than a source of manager alpha, it does provide a tailwind for funds employing short positions, boosting baseline returns compared to the low or negative rate environment of 2010–21. As long as rates remain elevated, this dynamic should continue to benefit hedge funds with meaningful short exposure.
While we recommend leaning into ELS strategies, given current market dynamics, it remains essential to prioritize manager quality and ensure each allocation fits within the broader portfolio. Investors should avoid over-concentration in any single strategy or style and align allocations with overall portfolio risk and objectives—whether adding risk or protecting capital. For taxable clients, selecting managers that actively consider tax implications and demonstrate a track record of tax-aware trading can further enhance after-tax outcomes.
Leaning into hedge fund strategies in 2026 is prudent for investors seeking both performance and protection. ELS strategies are especially well positioned, given current market dynamics, but a diversified approach that includes other defensive hedge fund strategies remains critical for portfolio resilience. By focusing on high-quality managers and strategic fit, investors can harness the diversification benefits that hedge funds provide—helping portfolios remain resilient and adaptable amid today’s market uncertainties.
Investors should lean into real asset secular themes in 2026
by Wade O’Brien
In 2026, investors should favor real assets that benefit from secular themes like digitalization, decarbonization, and demographics. However, as competition for these assets has driven up pricing, choosing skilled value-add managers who can develop projects and look beyond traditional plays is essential to unlocking high returns. Secondaries funds in both infrastructure and real estate are also attractive given access to high-quality assets at often favorable pricing.
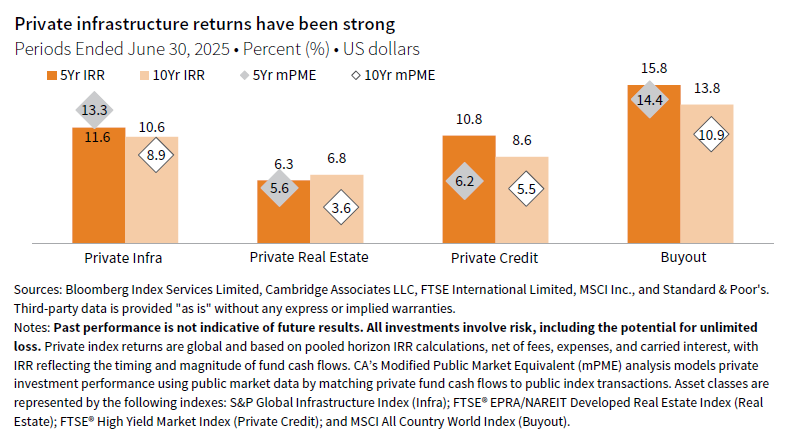
Recent returns for infrastructure funds underline the dual role they can play both in generating absolute returns as well as protecting against inflation. Private infrastructure funds have generated annualized internal rates of return (IRRs) of around 11% over the last five and ten years. Returns have been even higher for skilled managers who capitalized on these secular themes, with value-add funds investing in areas like energy transition and data centers often outperforming generalist infrastructure funds and even some buyout strategies.
Infrastructure valuations have risen for many assets, reflecting demand that has exceeded forecasts. For example, last year Grid Strategies predicted that US power demand could increase by 8% over the next five years, given surging data center demand, almost 3x the pace it had modeled just two years prior. Even when strong demand growth is well telegraphed, supply can struggle to respond. An aging US population will require between 35,000 and 45,000 new senior living units per year, but supply has fallen well short in recent years, given rising labor and financing costs.
Rising price tags for certain infrastructure assets favor funds developing new projects over those acquiring existing assets, though in some markets—such as US renewables—distressed sales will present opportunity. As partners in developing new projects, investors should carefully search for managers that bring specialized toolkits to the table. Developing complex assets like data centers requires navigating challenges like permitting, power supply, cooling, and scaling traditional designs to meet today’s massive compute needs. Underwriting tenant risk is also important, as long-term contracts with deep-pocketed hyperscalers may prove more secure than short-term rentals with more speculative players. Diversified private infrastructure funds also can have an edge in identifying related plays, for example in the case of data centers identifying companies that generate and store power or help upgrade grids to connect these assets.
Global infrastructure funds are an attractive choice, given the diverse opportunities and varying valuations across markets. For example, publicly traded utilities in the United States fetch higher valuations than those in other markets, reducing their attractiveness as take-private candidates. Also, while data center capacity is expected to experience almost uniformly rapid growth across the United States, Europe, and Asia in future years, renewable growth in the United States may be slower due to recent policy shifts.
In real estate, as in infrastructure, we favor value-add managers focused on secular themes. Elevated valuations for core real estate assets limit the potential for price appreciation and reduce the appeal to lock-up capital. Instead, value-add strategies targeting themes such as demographics (e.g., senior housing) and digitalization (e.g., cell towers) are more compelling.
For investors seeking to accelerate portfolio deployment, secondary funds are worth considering, though the rationale for doing so varies across asset classes. Infrastructure secondaries can provide immediate access to cash-flowing assets, though at modest discounts. In contrast, real estate secondary stakes can offer substantial discounts, offering a margin of safety for assets with deteriorating fundamentals.
Looking ahead to 2026, real asset investors should stick with secular winners. While valuations have risen for some of these assets, partnering with private infrastructure and real estate funds that add value through design and operation can enhance return potential. Should economic growth disappoint or inflation surprise to the upside, these strategies should be supported by strong long-term fundamentals.
Investors should overweight California Carbon Allowances in 2026
by Celia Dallas and Justin Hopfer
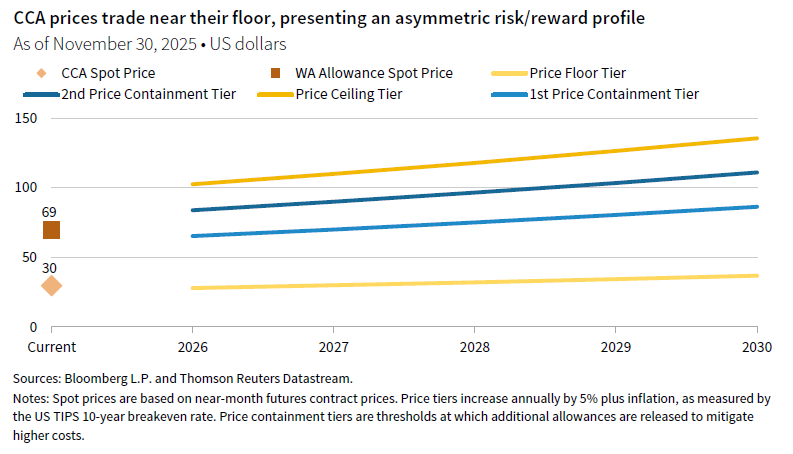
California’s Carbon Allowances (CCAs)—permits issued under the state’s cap-and-invest program—present an attractive investment opportunity relative to global equities. CCAs offer an asymmetric return profile: the program’s price floor limits downside risk, while tightening supply, linkage with Washington state, and regulatory changes create significant upside potential. As the market transitions from annual supply surpluses to persistent deficits, we believe CCA prices are poised for accelerated appreciation. Current pricing offers an attractive entry point, with prices near the price floor, whereas global equities remain constrained by elevated valuations and index concentration.
California’s cap-and-invest program, run by the California Air Resources Board (CARB), requires entities to surrender allowances equal to their emissions in three-year compliance cycles. Allowances are distributed through free allocation and quarterly auctions, with auction prices supported by a price floor and the Allowance Price Containment Reserve (APCR). The cap, a state-set limit on emissions, declines each year to meet climate targets by reducing free and auctioned allowances. Once prices reach containment tiers, CARB releases additional allowances from the APCR at set prices. After APCR units are depleted, CCAs can rise to the price ceiling. Price tiers rise annually by inflation plus 5%. Entities may “bank” allowances for future use and use carbon offsets, credits earned from emission-reduction projects, to meet part of their compliance.
Since 2019, the cap has decreased by 4% annually, while emissions have declined by 2%–3%, tightening supply relative to demand. Prices remain subdued, given the large bank of allowances, but as the cap tightens and these are depleted—projected by the early 2030s—prices should rise sharply. CARB’s proposal to accelerate the annual cap decline would remove 118 million allowances from 2027 to 2030. This would likely drive the market into persistent annual deficits starting in 2027, ultimately exhausting banked supply by 2031 and supporting higher prices. Even without accelerated cap declines, deficits are projected to emerge by 2034.
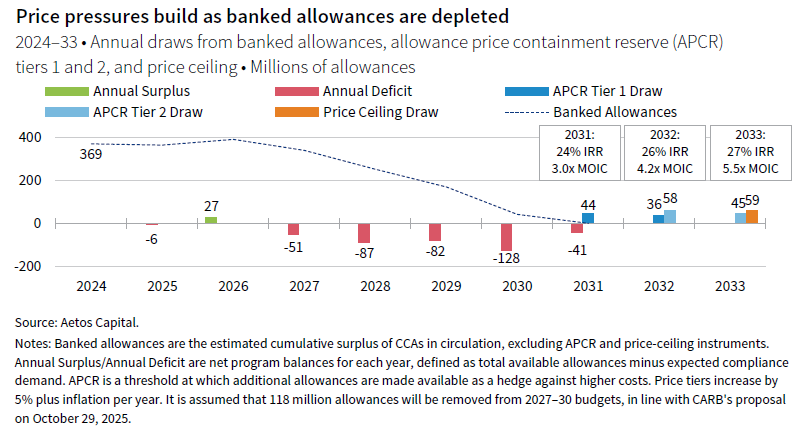
Asset manager Aetos’ base case scenario, with 118 million allowances removed through 2030, indicates the program could hit the first containment tier in 2031 and the second in 2032. Current CCA prices are $30, with Tier 1 and Tier 2 prices estimated at $96 and $134 in those years, implying annualized returns of 24% over the next six to seven years. Across four managers, expectations range from banked allowances being depleted from 2031 and 2034, with projected IRRs of 24% to 14%, respectively. Furthermore, the anticipated linkage with Washington state’s program, expected by 2027, would likely drive price convergence and support higher prices. Even in bearish scenarios, returns remain positive, as the price floor rises annually. This underscores CCAs’ attractive, asymmetric risk/reward profile, especially compared to global equities, which face subdued return expectations as outlined earlier. For US taxable investors, CCAs also benefit from long-term capital gains treatment, enhancing after-tax return potential.
Despite compelling return potential, the thesis faces regulatory, political, and market volatility risks. An immediate concern is further implementation delay, especially after the program extension to 2045 took longer than expected. Next steps—Initial Statement of Reasons (ISOR) publication and rulemaking—must be completed before the October 2026 issuance of free allowances to enable accelerated allowance removals and deplete banks allowances. Recent federal executive orders have also prompted legal challenges, creating ongoing litigation and regulatory uncertainty as a tail risk. Nevertheless, the program has withstood past legal challenges and enjoys strong state support, reinforced by its fiscal contributions—$33.7 billion since inception.
The investment case for overweighting CCAs remains strong as the market shift from surplus to persistent deficit. Prudent position sizing is essential, given political and regulatory risks, lower liquidity, and event-driven volatility. Overall, CCAs offer differentiated return and diversification potential, with significant upside relative to global equities if anticipated catalysts are realized.
The FTSE® EPRA/NAREIT Developed Real Estate Index is designed to measure the performance of listed real estate companies and REITs in developed markets worldwide. The index is jointly managed by FTSE, EPRA (European Public Real Estate Association), and NAREIT (National Association of Real Estate Investment Trusts), and is widely used as a benchmark for global listed real estate investments.
The FTSE® High Yield Index measures the performance of USD-denominated, non–investment-grade (high-yield) corporate bonds. The index is designed to provide a representative benchmark for the US high-yield corporate bond market.
Equity Hedge strategies maintain positions both long and short in primarily equity and equity derivative securities. A wide variety of investment processes can be employed to arrive at an investment decision, including both quantitative and fundamental techniques; strategies can be broadly diversified or narrowly focused on specific sectors and can range broadly in terms of levels of net exposure, leverage employed, holding period, concentrations of market capitalizations and valuation ranges of typical portfolios. Equity Hedge managers would typically maintain at least 50%, and may in some cases be substantially entirely invested in equities, both long and short.
The HFRI Macro (Total) Index includes macro investment managers, which trade a broad range of strategies in which the investment process is predicated on movements in underlying economic variables and the impact these have on equity, fixed income, hard currency, and commodity markets. Managers employ a variety of techniques, both discretionary and systematic analysis, combinations of top down and bottom-up theses, quantitative and fundamental approaches, and long- and short-term holding periods. Although some strategies employ RV techniques, macro strategies are distinct from RV strategies in that the primary investment thesis is predicated on predicted or future movements in the underlying instruments, rather than realization of a valuation discrepancy between securities.
The MSCI ACWI captures large- and mid-cap representation across 23 developed markets (DM) and 24 emerging markets (EM) countries. With 2,511 constituents, the index covers approximately 85% of the global investable equity opportunity set. DM countries include: Australia, Austria, Belgium, Canada, Denmark, Finland, France, Germany, Hong Kong, Ireland, Israel, Italy, Japan, the Netherlands, New Zealand, Norway, Portugal, Singapore, Spain, Sweden, Switzerland, the United Kingdom, and the United States. EM countries include: Brazil, Chile, China, Colombia, Czech Republic, Egypt, Greece, Hungary, India, Indonesia, Korea, Kuwait, Malaysia, Mexico, Peru, the Philippines, Poland, Qatar, Saudi Arabia, South Africa, Taiwan, Thailand, Turkey, and the United Arab Emirates.
The S&P Global Infrastructure Index is designed to track the performance of 75 companies from around the world that represent the listed infrastructure industry. The index includes companies from three distinct infrastructure clusters: utilities, transportation, and energy.
The Société Générale Trend Index is equal-weighted and reconstituted annually. The index calculates the net daily rate of return for a pool of trend following based hedge fund managers.
About Cambridge Associates
Cambridge Associates is a global investment firm with 50+ years of institutional investing experience. The firm aims to help pension plans, endowments & foundations, healthcare systems, and private clients achieve their investment goals and maximize their impact on the world. Cambridge Associates delivers a range of services, including outsourced CIO, non-discretionary portfolio management, staff extension and alternative asset class mandates. Contact us today.