Venture Capital Positively Disrupts Intergenerational Investing


Families of wealth face three key questions about intergenerational wealth planning: how best to invest to sustain future generations; how best to engage the next generation; and how best to ensure family unity endures. Often each question is addressed independently. We find that a conversation across generations about the impact of a meaningful venture capital (VC) allocation can help address all three questions in an integrated manner.
Venture capital offers the potential for attractive returns relative to public equity markets, often in a tax-advantaged manner, thus allowing the portfolio to generate more wealth to support current and future generations. Bringing the next generation into the conversation about the changing investing landscape also offers the opportunity for both generations to learn about the unique aspects of VC investing and the critical role it can play in the family’s portfolio. Furthermore, the vast potential that exists for making lasting impact through VC, both in terms of financial returns and contributions to society, may provide unifying experiences across generations. For many families, venture investing may provide a connection to the original roots of entrepreneurship that created the family wealth.
As VC spurs continued innovation and industry disruption, families should consider the potential positive disruption the inclusion of VC can bring to their intergenerational investment plans. This paper provides some context for considering such an inclusion by discussing the investment potential and implications for interested investors.
Venture, the Source of Future Returns
Whether it be cloud computing, machine learning, or artificial intelligence, emerging technologies are transforming many industries. Venture capital investing offers exposure to evolving industries, often at the ground level, hedging the risks associated with mature companies ripe for disruption. To be sure, plenty of public equity and hedge fund managers are evaluating structural market changes, looking to buy winners and sell losers; the pure-play opportunity to capture this value, however, is via VC.
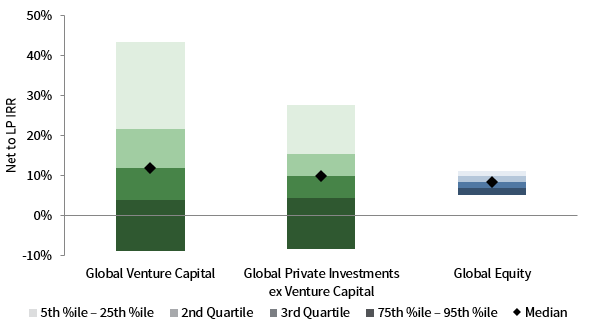
Venture capital has generated compelling returns relative to public markets, both in recent years and over long-term time periods (Figure 1). Looking ahead, we believe the environment will continue to support attractive returns. Technological advancements, strong entrepreneurial talent, availability of capital, and fund manager skill are creating intriguing investment opportunities across multiple dimensions.
FIGURE 1 THE CASE FOR VENTURE: RETURNS
As of June 30, 2019 • Global Venture Capital Periodic Rates of Return (%)
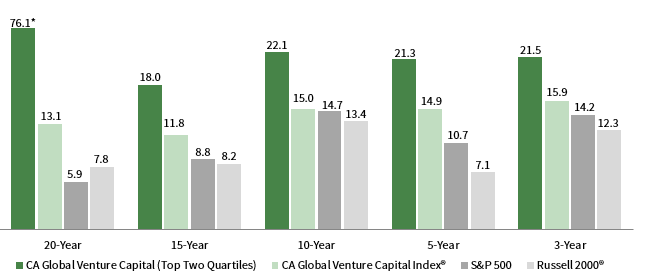
* Twenty-year CA Global Venture Capital (Top Two Quartiles) return capped for scaling purposes.
Sources: Cambridge Associates LLC Private Investments Database, Frank Russell Company, Standard & Poor’s, and Thomson Reuters Datastream.
Notes: Pooled private investment periodic returns are net of fees, expenses, and carried interest. Multi-year annualized returns are generated for time periods ended June 30, 2019. Top-performing institutional investors understand shifting industry dynamics and have prudently been increasing their VC allocations, with top-decile performers having a mean VC allocation of 15% (Figure 2). For many investors, we believe a greater allocation than 15% may be appropriate, and we believe this is particularly true for private investors.
FIGURE 2 VENTURE CAPITAL ALLOCATIONS CONTINUE TO GROW
Mean Venture Capital Allocation (%) • Years ended June 30
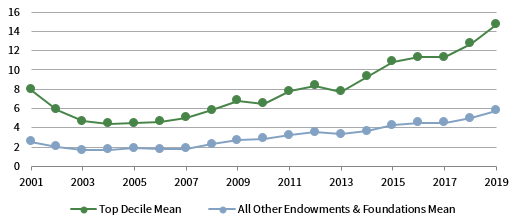
Source: Cambridge Associates LLC.
Notes: Analysis includes 155 institutions that provided asset allocation data for each of the June 30 periods listed. The top decile is based on the 20-year AACR rankings as of June 30, 2019, and includes 16 institutions.
While each family situation is unique, we advocate for families to consider allocating 40% or more to private investments. We also believe families should consider dedicating half of their private investment allocations to VC, provided these families have a long time horizon and the requisite liquidity provisions to meet their spending needs. Factoring in the potential tax advantages of VC investing—such as returns being taxed primarily as long-term capital gain; opportunities to discount interests for gift, estate, and inheritance tax purposes; and possible qualified small business stock tax treatment—a 20% allocation can nicely position a portfolio for future generations.
The Venture Investing Landscape Has Evolved
It is important for private investors to understand how the return and risk profiles of VC investing have changed, as today’s market is not the same as 20 years ago. Broad-based value creation across sectors, geographies, and funds means success is no longer limited to a handful of (often inaccessible) fund managers. Moreover, top returns are not confined to a few dozen companies. As Figure 3 shows, new and developing fund managers consistently rank as some of the best performers.
FIGURE 3 NEW AND DEVELOPING FUNDS ARE CONSISTENTLY AMONG TOP 10 PERFORMERS
Ranking, as of June 30, 2019 • US VC Funds by Vintage Year • Based on Net TVPI
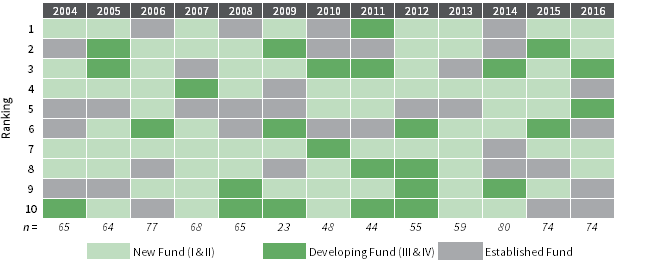
Source: Cambridge Associates LLC Private Investments Database.
Notes: Pooled total value to paid-in capital (TVPI) multiple is net of fees, expenses, and carried interest. Fund order is determined as funds raised under the same strategy and does not include friends and family funds. New fund is defined as the first or second fund, developing fund is the third or fourth fund, and established fund is the fifth fund and beyond. Vintage years formed since 2016 are too young to have produced meaningful returns. Vintage years with less than 40 funds in the sample have fewer than 10 funds in the first quartile; in 2009, the first six funds are top-quartile, the last four funds are second-quartile.
As Figure 4 shows, VC investors during the 2000 tech bubble experienced significantly varied results, with both big winners and big losers. Since then, the industry has evolved, and fund managers have learned valuable lessons that benefit today’s venture investors. What once was considered a bingo card approach to fund construction has been replaced with a more rigorous, risk-managed assembly of companies. VC funds are surrounding themselves with “incubator” forums and core communities of advisors, as well as setting aside capital for follow-on needs. These additional measures provide critical resources that enable start-up companies to find solid product market fit and to scale accordingly. This has had the dual effect of reducing return dispersion among managers and reducing the impairment and capital loss ratios of the underlying universe of companies. In the 1990s, the capital loss ratio was more than 50%. 1 This has dropped significantly to about 20%. Today, the time frame and capital required to determine viability is significantly lower than it was 20 years ago, allowing managers to trim the weeds and water the flowers more efficiently.
As of June 30, 2019
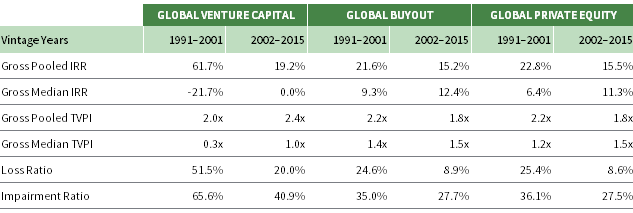
Source: Cambridge Associates LLC Private Investments Database.
Notes: Capital loss ratio is defined as the percentage of capital in deals realized below cost, net of any recovered proceeds, over total invested capital. Impairment ratio is defined as the percentage of invested capital realized or valued at less than cost.
In light of the historically higher loss and impairment ratios, VC is often met with skepticism and deemed too risky. Given many start-up companies fail to return capital, it is reasonable to assume the risk of capital loss is high with VC investing. The data suggest that VC has matured and today exhibits a closer risk/return profile to global PE (buyouts and growth) than it did in the 1990s. Investing in venture funds, which each have 20–30 investments, reduces the risk from any single start-up. Diversifying across multiple funds helps to mitigate the downside probability of overall loss.
Still, the goal in VC investing is not simply to break even. While narrower than 20 years ago, the range of manager returns is still wide and significant (Figure 5). The modest, but real, dispersion among public global equity fund returns underscores the ongoing debate over passive versus active management. In VC investing, there is no “passive” approach, and manager selection is the key to capturing attractive returns.
FIGURE 5 RETURN DISPERSION: PUBLIC VERSUS PRIVATE
Average Annual Manager Return • As of June 30, 2019 • Percent (%)
Source: Cambridge Associates LLC. Notes: Public data include public market returns from January 1, 2004. Private data includes inception-to-date IRR for vintage years 2004 to 2015. Returns for global equity managers are average annual compound returns (AACRs) for the period ended June 30, 2019, and only managers with performance available for the entire period are included. Returns for private investment managers are horizon internal rates of return (IRRs) calculated since inception to June 30, 2019. Time-weighted returns (AACRs) and money-weighted returns (IRRs) are not directly comparable. Cambridge Associates LLC’s (CA) equity manager universe statistics are derived from CA’s proprietary Investment Manager Database. Managers that do not report in US dollars, exclude cash reserves from reported total returns, or have less than $50 million in product assets are excluded. Performance of public equity managers is generally reported gross of investment management fees. CA derives its private benchmarks from the financial information contained in its proprietary database of private investment funds. The pooled returns represent the net end-to-end rates of return calculated on the aggregate of all cash flows and market values as reported to Cambridge Associates by the funds’ general partners in their quarterly and annual audited financial reports. These returns are net of management fees, expenses, and performance fees that take the form of a carried interest.
Further Considerations for Inclusion
Given muted return expectations for public equities over the next ten years, increasing allocations to VC may prove to be beneficial. Consider the following math: A properly constructed VC portfolio will target a 300% return over the life of the fund (typically ten years). By comparison, to earn a 200% return on a public stock over ten years, the stock would need to have an annualized return of about 7%.
The importance of allocating to VC is further marked by what looks to be a clear and sustainable trend of private markets replacing public markets, as seen in Figure 6. Over the past 20 years the number of publicly traded US equities has nearly halved, from 8,090 to 4,336. This compares to 8,352 unrealized and partially realized VC-backed companies in 2019. While not all these companies will survive, or prosper, many will generate significant returns for investors. As these companies stay private longer, the greater returns are increasingly reaped by early VC investors.
FIGURE 6 THE EVOLUTION OF PUBLIC AND PRIVATE MARKETS
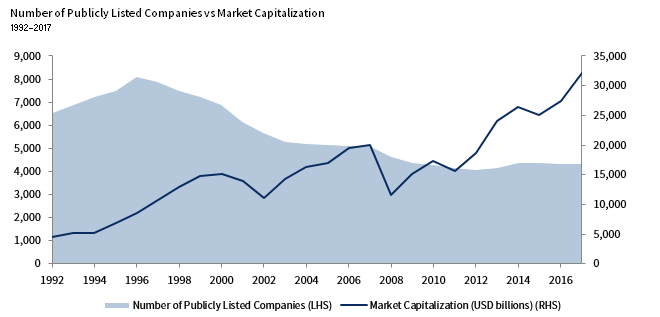

Sources: Cambridge Associates LLC, Global Financial Data Inc., New York Stock Exchange, PitchBook, and World Bank.
Notes: Market capitalization (also known as market value) is the share price times the number of shares outstanding. Listed domestic companies are the domestically incorporated companies listed on the country’s stock exchanges at the end of the year. Listed companies do not include investment companies, mutual funds, or other collective investment vehicles. Public equity market capitalization is taken from historical market capitalization of New York Stock Exchange. Private market valuation is recorded as post-money valuation for all private equity and venture-backed companies. Data are in current US dollars.
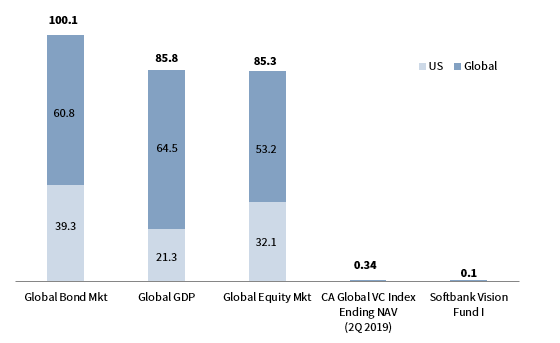
Fears of too much money being raised in the VC space are consistently based on historical levels, rather than future potential. When put into context, the amount of money raised in VC represents a fraction of the market value of the industries being disrupted by many venture-backed companies, and a fraction of the total addressable markets of emerging business categories being created by VC. As shown in Figure 7, VC at $340 billion net asset value (NAV) is less than 0.5% of the $85 trillion in global equity valuation.
FIGURE 7 RELATIVE MARKET SIZE: VENTURE IS A FRACTION OF THE GLOBAL MARKET
Size of Capital Markets (USD trillions)
Publicity around the proliferation of overpriced “unicorns” (companies valued at more than $1 billion) as a sign of too much money in the space needs context. Once aptly named, unicorns are no longer rare and elusive. While several later stage venture-backed (pre- and post-IPO) unicorn companies are now visibly being repriced down, valuations for early-stage and growth sectors of venture have remained more reasonably balanced (Figure 8). For investors in the early and growth stages, increased funding options at later stages offer the opportunity for liquidity for early-round investors while allowing companies to remain private.
FIGURE 8 VALUATION BY STAGE OF FINANCING
Median Pre-Money Valuations • 2004–19 • USD Millions
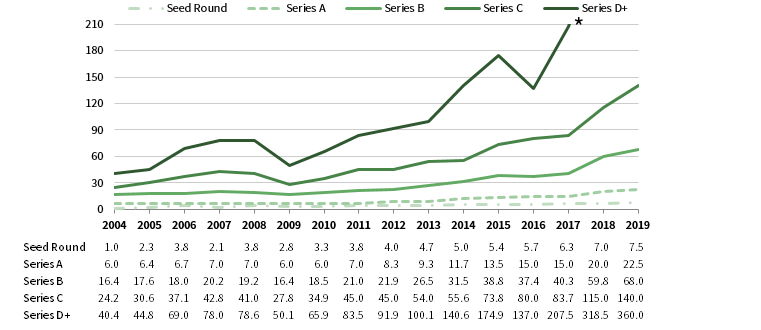
Source: PitchBook.
Note: Data for 2019 are through September 30.
Venture Capital’s Convergence with Family Values
At the heart of VC is the investment in an entrepreneur. Whether his or her vision is transforming the consumer buying experience or addressing climate change, the goal is to make a difference while making a return on capital. Tapping into the perspectives, insights, and experiences of all generations will facilitate decision making on how best to incorporate VC into the family’s long-term investment strategy. Generations can combine their expertise, insights, and interests to identify unique and compelling areas for investment. One generation, for instance, may be at the forefront as consumers for many of the new technologies, bringing a level of insight that complements the other generation’s experience and wisdom.
As technological advances have been made, the ability to have profitable paths to sustainability is creating a vast array of areas for potential impact investing (Figure 9). This convergence of profit and impact affords a unique advantage for families. Separate from pure philanthropic conversations, discussions around VC fund investments can focus on opportunities that can profitably address these issues, ensuring longevity of the solutions. Many families are considering ways to have more impact with their wealth via VC investments that focus on sustainable change related to social and environmental challenges. By accessing specific opportunities aligned with individual interests, each family member’s distinct perspective, passion, and personal values can be incorporated in the family’s investment choices, making the family’s investment program more personally meaningful and impactful to all participants.
FIGURE 9 DIVERSE IMPACT OPPORTUNITIES IN VENTURE CAPITAL
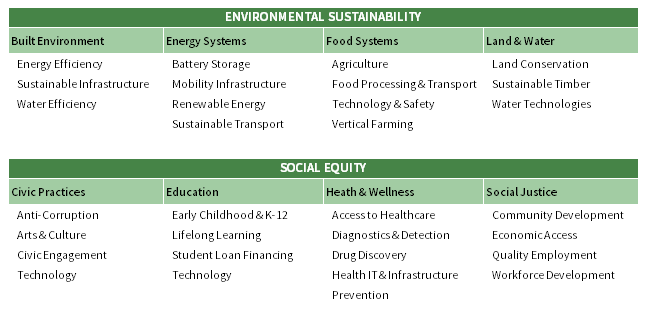
Source: Cambridge Associates LLC.
Conclusion
As technological advances are disrupting and transforming companies in every sector, the traditional investing landscape is also being disrupted. Venture capital is at the core of the transformation and has become a critical component of a long-term investment strategy. Institutional investors have understood this trend and have allocated accordingly. We encourage families to consider how their own intergenerational investing plans might best be positively disrupted by VC. With the potential for attractive returns and significant positive impact, VC presents a prime platform for cross-generational conversations about investing. ■
Index Disclosures
CA Global Venture Capital Index Cambridge Associates derives its Global ex US Developed Markets Private Equity and Venture Capital Index from the financial information contained in its proprietary database of global ex US private equity and venture capital funds. As of June 30, 2019, the database comprised 839 global ex US developed markets buyouts, growth equity, and venture capital funds formed from 1986 to 2019 with a value of about $266 billion. Ten years ago, as of June 30, 2009, the benchmark index included 535 global ex US developed markets funds, whose value was roughly $144 billion. The funds in this index invest primarily in developed markets in Australia, Canada, Israel, Japan, New Zealand, Singapore, and Western Europe.S&P 500 Composite Stock Price Index The S&P 500 Composite Stock Price Index is a capitalization-weighted index of 500 stocks intended to be a representative sample of leading companies in leading industries within the US economy. Stocks in the index are chosen for market size, liquidity, and industry group representation.Russell 2000® Index The Russell 2000® Index is a market capitalization–weighted index designed to measure the performance of the 2,000 smallest publicly traded US companies based on in market capitalization. The Index is a subset of the larger Russell 3000® Index.
Footnotes
David Thurston - David Thurston is a Managing Director at Cambridge Associates.
About Cambridge Associates
Cambridge Associates is a global investment firm with 50+ years of institutional investing experience. The firm aims to help pension plans, endowments & foundations, healthcare systems, and private clients achieve their investment goals and maximize their impact on the world. Cambridge Associates delivers a range of services, including outsourced CIO, non-discretionary portfolio management, staff extension and alternative asset class mandates. Contact us today.