VantagePoint: Can US Equity Dominance Be Sustained?


Since 2010, US equities have been unstoppable, outperforming developed markets equities outside the United States (DM ex US) by a whopping 5.5 percentage points (ppts) annually, with few periods of short-lived, intermittent underperformance. Recently, this outperformance has been led by a small set of US tech giants.
In this edition of VantagePoint, we review the drivers of US outperformance in the context of historical expansions, consider what markets are pricing in, and if stronger fundamentals for US equities justify higher valuations. We study past periods of concentrated market leadership to assess the likelihood that US and tech leadership will persist, and we review how the rapid deployment of technology in recent decades may have shifted the landscape to favor US technology companies more sustainably. Finally, we consider that US dollar strength has persisted and will need to turn to weakness for DM ex US equities to outperform.
We reckon that US equities have more room to run as conditions today are not as extreme as some past cycles. However, we would not chase the last mile by overweighting US equities. Tech giants are vulnerable to disappointment of the elevated expectations reflected in valuations. Even well-run tech giants that continue to dominate their sectors and maintain high profitability cannot deliver strong returns if their stock prices discount too much near-term optimism. Investors should maintain diversified global equity exposure that includes small-cap equities and value equities, which we regard as more attractive, particularly as we expect narrow market leadership to broaden out in the next year or so.
What Must Be True for US Equity Dominance to Continue?
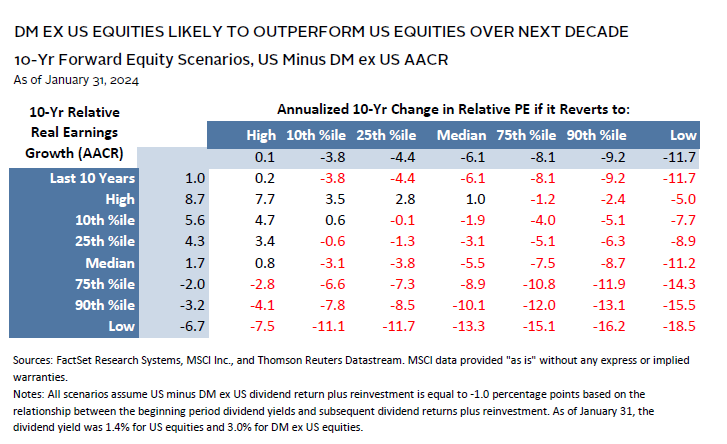
US equities have already seen significant multiple expansion relative to DM ex US equities, with current price-earnings (P/E) multiples based on 12-month trailing earnings ending January 31, 2024 at 25.4 for US and 15.3 for DM ex US equities. Given this valuation headwind, as well as a meaningfully lower dividend yield (1.4% for the United States versus 3.0% for DM ex US), what are the implications for relative returns over the next decade?
To assess this, we consider prospects for US outperformance under various scenarios for relative P/E multiples and earnings growth based on historical cycles. Over the post-1974 history of MSCI data, drivers of relative US/DM ex US equity performance have varied. Rolling ten-year performance of US equities minus DM ex US equities reveals that earnings growth and P/E multiples differentials tend to move in cycles, while dividend return differentials (including reinvestment) are more structural in nature. Further, as would be expected, the relationship between ten-year relative earnings growth and valuation changes is positively correlated, although the relationship is not particularly tight. At the extremes, it would be unprecedented to see US earnings growth outperformance relative to DM ex US equities in the 10th percentile without also seeing multiple expansion, or earnings growth underperformance in the 90th percentile without some multiple contraction.
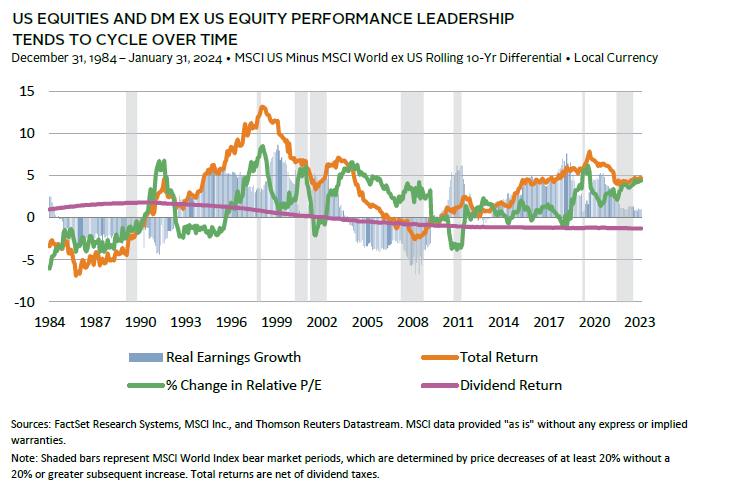
Over rolling ten-year periods, US earnings growth has dominated DM ex US earnings growth for much of the post-2013 period, but the momentum has decelerated. In real terms, since the recent peak in US earnings growth relative to World ex US earnings growth in May 2021, US earnings have grown a cumulative 1.5% compared to 32% for DM ex US equities.
This analysis reveals that there are reasonable scenarios in which US equities could sustain their lead relative to DM ex US equities, but this would require US companies to deliver on earnings and maintain adequate investor confidence, so valuations remain at or near current elevated levels. As such, it is far more likely that over the next decade, DM ex US equities will outperform US equities.
Concentration Nation
Market leadership in US equities was quite narrow over much of last year. In 2023, top-ten contributors to US equity returns accounted for 64% of the MSCI US Index return—the fourth-highest degree of concentration since our analysis begins in 1990. More notably, these same ten stocks were also the largest contributors to DM equity returns, accounting for 48% of the MSCI World Index return. Only two of the top 25 contributors to MSCI World Index returns are outside of the United States. Predictably, these companies are associated with some of the most significant trends that ignited US equity performance last year: weight-loss drugs (13th-ranked Novo Nordisk) and artificial intelligence (16th-ranked ASML).
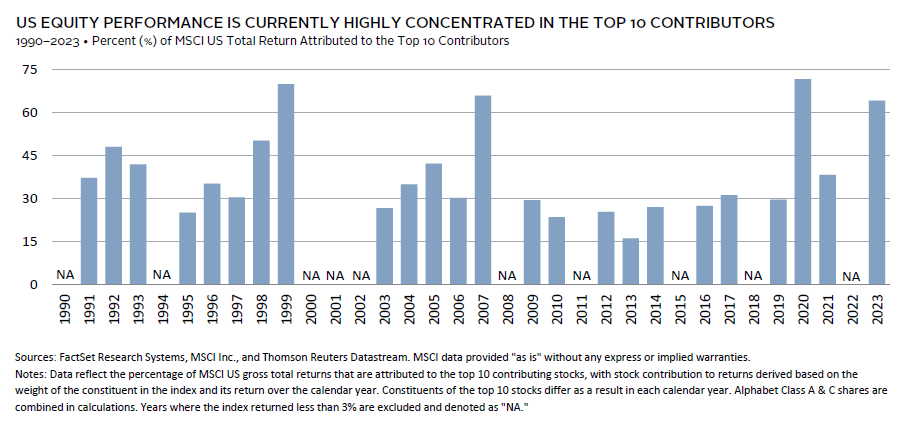
Unsurprisingly, the Magnificent Seven—Apple, Microsoft, Nvidia, Amazon, Alphabet, Meta, and Tesla—topped the list for 2023. Indeed, without the Magnificent Seven last year, US equity performance looked a lot like global ex US equity performance. The group of seven stocks out earned the rest of the US equity market and global ex US equities by a wide margin, and expectations remain robust for a relatively strong 2024 and 2025. These companies need to keep delivering to remain on top, as evidenced this year by Tesla lagging behind the pack after its disappointing fourth quarter, while Meta and Nvidia’s better-than-anticipated results spurred manias.
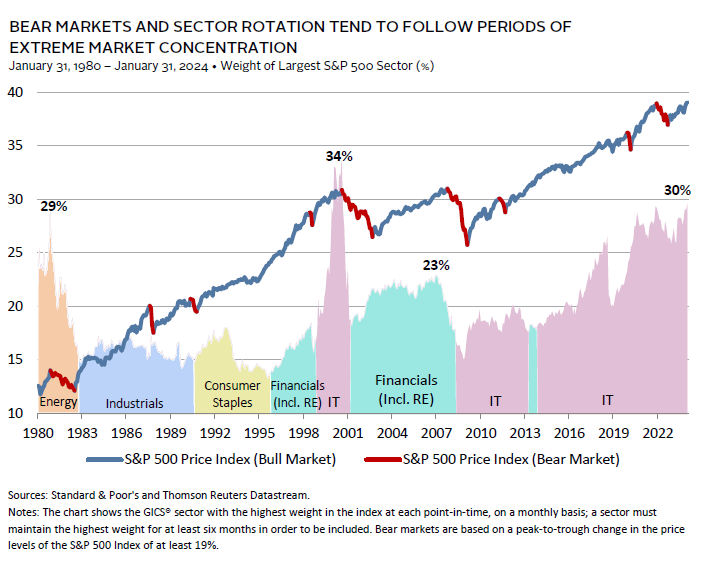
Such high market performance concentration has not been positive for markets. While concentration can be sustained for a couple of years, as was the case in the late 1990s, what followed was a severe, multi-year contraction. This resulted in sector rotation, with financials taking over the mantle of market leadership and US equities underperforming DM ex US equities for much of the next market cycle through 2007. The current period somewhat resembles the 1999 market peak in terms of stock concentration and technology dominance, but, notably, the market is not as concentrated in the IT sector as in the past, and profitability of the tech sector is considerably higher today. To the former point, looking at GICS® sectors somewhat masks today’s concentration, as among the Magnificent Seven, only Apple, Microsoft, and Nvidia are classified as IT. The other four companies have an 11% weight in the S&P 500 Index, which, if added to the IT weight, would total 40%.
Historical Precedent Suggests Market Leaders Have More Room to Run
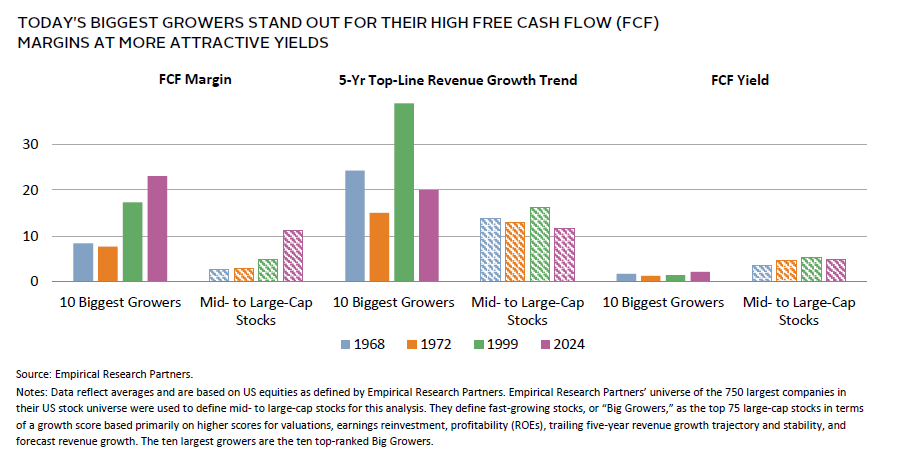
How does the current period of exuberance for mega-cap tech champions compare to those of past periods? Valuations are lower and fundamentals range from comparable to stronger than in the past, suggesting this boom still has legs. Research by Empirical Research Partners provides a comparison of fundamental characteristics of today’s ten fast-growing stocks and the broad universe of mid- to large-cap stocks to those of several prior periods that turned into bubbles: the late 1960s go-go mainframe technology and pharmaceutical-led boom; the early 1970s Nifty Fifty boom of large, brand name, defensive “long-term holds;” and the late-1990s technology, media, and telecom (TMT) boom.
As with the three prior booms, fundamentals of the top ten growers were stronger than those of the broad market, on average. However, a distinguishing feature of today’s largest growers is their ability to generate free cash flow. The trailing cash flow margin of the current top growers averages 23%, more than double the 11% average of the three periods at their performance peaks. Free cash flow (FCF) margin strength is broader based today than during the previous booms, with mid- to large-cap stocks averaging margins of 11%, compared to an average of just 3.5% in the last three booms.
In all cases, average valuations for the top ten growers outpaced those of the broad market, reflecting expectations that strong fundamentals for the largest growers would be more durable. Even still, compared to prior periods, FCF yields indicate the ten biggest growers today are roughly one-third cheaper compared to the late 1990s and 40% cheaper compared to the 1970s Nifty Fifty set. By another more common measure, average 12-month forward PE ratios at 32x are excessive but remain 26% below the 43x average multiple of their late 1990s peers.
Essentially, top growers offer superior fundamentals, but do so at high valuations that price in significant optimism about the future, making them vulnerable to disappointment or a period of consolidation should other markets more easily beat more depressed expectations reflected in relatively cheap valuations.
End of Reversion to the Mean?
Mean reversion of profitability has long been a central investing concept. Yet in recent decades, the winners—mostly US-listed companies—seem to keep winning, helping to perpetuate the US equity advantage. The outlook for continued elevated US margins is mixed.
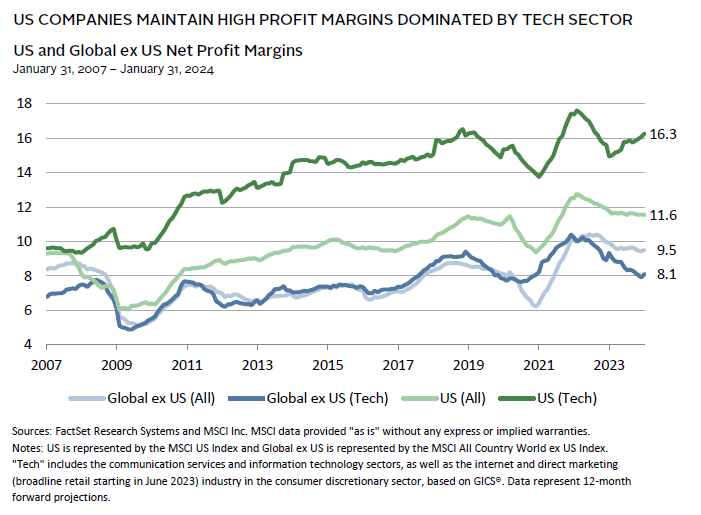
Increased globalization, lower corporate taxes, cheaper credit costs, and broad declines in labor’s negotiating power that have fueled US profit margin expansion have largely stalled. At the same time, minimally restrictive antitrust enforcement has potential to take a meaningful bite out of large US corporate profits as attitudes about antitrust have started to change. The remaining potential boost in favor of big tech today is cost-reducing technological advances coupled with continued innovation to sustain defensive moats. Indeed, high net profit margins have been almost entirely driven by the tech sector, which is most likely to benefit near term from technological advances. In 2007, net profit margins for the broad US market and the US tech sector were quite similar, with an average gap of just 34 basis points. Currently, US tech sector net profit margins are nearly 5 ppts higher than those for the broad market.
Big Tech Vulnerable to Antitrust Action
The last major US government antitrust action against big tech was in 1998 against Microsoft. While Microsoft avoided the initial ruling that would have required it to split into two entities, the agreement opened the door to competition in its web browser business—Internet Explorer—which still managed to build its share of web usage to more than 90% through late 2004, and didn’t drop below 50% share until 2010 when Google Chrome gained dominance.
US antitrust law originally focused on anti-competitive activity and preventing concentration of power in too few hands. However, in recent decades, precedent has shifted to a standard of consumer welfare, making it more difficult for the Department of Justice (DOJ) and Federal Trade Commission (FTC) to successfully win cases against big tech. At present, the DOJ or FTC have cases outstanding against Alphabet, Meta, and Amazon, among others. Should the tide change, big tech would lose some ability to dominate markets.
Winners Keep Winning?
Several theories support the notion that businesses can continue to increase profits as they scale up provided they create barriers to entry through ongoing innovation. 1 Economies of scale occur when a company can reduce cost per unit as volume increases. Companies must be well run to avoid diseconomies of scale as complexity, bureaucracy, and coordination costs increase. Scale benefits are related to operating leverage that leads to lower cost per unit as fixed costs, investments, and research and development are spread over a larger volume of output. Further, the more output produced, the more learning can be achieved that reduces the cost of production.
More relevant to recent experience is how positive feedback, network effects, and innovation from recombination of ideas are particularly suited to the current era of rapid technological advancement and the rise of intangible assets that are inherently more scalable than tangible assets. Positive feedback can lead to one product or system dominating others (e.g., Google in search engines, Facebook in social networks), thus locking in customers by creating a network effect. The shareholder value created from these effects can be persistent in cases where there is a substantial switching cost to moving to a competitor with a smaller market share.
Innovation—which is enhanced by recombining ideas—can also contribute to longevity of leaders, particularly if they are able to protect their market share through legal means (i.e., patents) or network effects. With more ideas to use as innovation building blocks, and a better ability to manipulate them computationally, market leaders have a greater potential for faster growth.
Further, early evidence on artificial intelligence (AI) adoption looks to support the notion that these technologies increase scale advantages, disproportionately benefiting tech giants. A report by Empirical Research Partners highlighted recent studies that found robot adoption tended to boost margins only for those firms that had high margins to start with. 2 Additionally, larger firms are better resourced to invest in and implement robotics. While early days, preliminary research suggests that generative AI bears significant resemblance to robotics, favoring the largest, most sophisticated firms. 3
In short, large, innovative companies have advantages that have enabled them to generate significant FCF margins. However, great companies can become priced to perfection and competitive moats can yield way to better, newer networks, requiring investors to stay diligent about individual company characteristics rather than painting a set of leading companies like the Magnificent Seven with a broad brush.
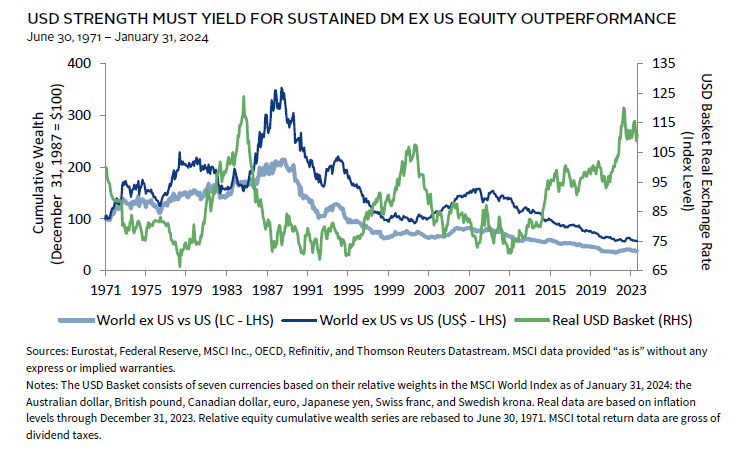
US Dollar Dominance
A falling US dollar has long coincided with periods of DM ex US equity outperformance. The dollar has been in an exceptionally long bull market since bottoming in real terms in 2011. Following the run-up that climaxed in September 2022, we believe the greenback’s best days are probably behind us. Near term, the currency remains supported by wide interest rate differentials versus its peers and expectations of continued US economic outperformance. The unwinding of these factors against a more normalized macroeconomic backdrop should precipitate dollar weakening and boost relative equity performance outside the United States, particularly if growth conditions remain stable. Conversely, should growth disappoint, the flight-to-safety effect the US dollar enjoys would initially support the currency, but weakening would follow, ultimately supporting DM ex US equities.
Pricing Getting Peaky but More Room to Run
Although dominance of US equity fundamentals led by big tech may be extended through economies of scale, positive feedback, network effects, innovation, and investment in AI and other new technology, not all signs point to continued outperformance. Antitrust actions remain a risk to large tech companies’ moats, while investors would be remiss to ignore elevated valuations.
Investors will be well served to remember two key lessons. First, tech firms are not impenetrable, and tech leadership has rotated in recent years. What appears to be a barrier to entry may prove temporary, as was seen with Microsoft’s Internet Explorer dominance. Nvidia is believed to have rosy growth prospects, but those could likewise be paired back by competition from another chip giant, like Advanced Micro Devices, who in December announced they were coming out with a 50% faster chip.
Second, even companies with strong prospects can see their stock returns eroded by lofty valuations that price in too much growth too soon. Even Microsoft, one of the few tech companies that has maintained its dominance as a tech giant for decades, has seen dark days. The stock, now trading at just over $400/share peaked at $59.56 near the end of 1999. It ended 2000 below $22 and did not surpass its nominal high-water mark until 2016—more than a lost decade! 4
A re-run of the early 2000s is not a foregone conclusion, as market conditions differ. Tech fundamentals are stronger today, and valuations are extreme, but not as stretched. If economic growth remains supportive as we expect, the gap between US tech leaders and the rest of the global market will narrow as other market sectors outperform, while these leaders consolidate their gains. Indeed, this transpired for much of the second half of last year. Investors will be well served by remaining diversified with a broad, global allocation to equities, including relatively attractive sectors like small-cap and value stocks.
The MSCI ACWI captures large- and mid-cap representation across 23 developed markets (DM) and 24 emerging markets (EM) countries. With 2,947 constituents, the index covers approximately 85% of the global investable equity opportunity set. DM countries include: Australia, Austria, Belgium, Canada, Denmark, Finland, France, Germany, Hong Kong, Ireland, Israel, Italy, Japan, the Netherlands, New Zealand, Norway, Portugal, Singapore, Spain, Sweden, Switzerland, the United Kingdom, and the United States. EM countries include: Brazil, Chile, China, Colombia, Czech Republic, Egypt, Greece, Hungary, India, Indonesia, Korea, Kuwait, Malaysia, Mexico, Peru, the Philippines, Poland, Qatar, Saudi Arabia, South Africa, Taiwan, Thailand, Turkey, and the United Arab Emirates.
MSCI ACWI ex US Index
The MSCI ACWI ex USA Index captures large- and mid-cap representation across 22 of 23 developed markets (DM) countries (excluding the United States) and 24 emerging markets (EM) countries. With 2,311 constituents, the index covers approximately 85% of the global equity opportunity set outside the United States. DM countries include: Australia, Austria, Belgium, Canada, Denmark, Finland, France, Germany, Hong Kong, Ireland, Israel, Italy, Japan, the Netherlands, New Zealand, Norway, Portugal, Singapore, Spain, Sweden, Switzerland, and the United Kingdom. EM countries include: Brazil, Chile, China, Colombia, Czech Republic, Egypt, Greece, Hungary, India, Indonesia, Korea, Kuwait, Malaysia, Mexico, Peru, the Philippines, Poland, Qatar, Saudi Arabia, South Africa, Taiwan, Thailand, Turkey, and the United Arab Emirates.
MSCI US Index
The MSCI US Index is designed to measure the performance of the large- and mid-cap segments of the US market. With 625 constituents, the index covers approximately 85% of the free float–adjusted market capitalization in the United States.
MSCI World Index
The MSCI World Index represents a free float–adjusted, market capitalization–weighted index that is designed to measure the equity market performance of developed markets. As of December 2017, it includes 23 developed markets country indexes: Australia, Austria, Belgium, Canada, Denmark, Finland, France, Germany, Hong Kong, Ireland, Israel, Italy, Japan, the Netherlands, New Zealand, Norway, Portugal, Singapore, Spain, Sweden, Switzerland, the United Kingdom, and the United States.
S&P 500 Index
The S&P 500 Index includes 500 leading companies and covers approximately 80% of available market capitalization.
Footnotes
- For an excellent discussion and survey of the literature, see Michael J. Mauboussin and Dan Callahan, CFA, “Counterpoint Global Insights, Increasing Returns, Forms of Increasing Returns and What Drives Them,” Consilient Observer, Morgan Stanley Investment Management, January 30, 2024.
- See Joel Stiebale, Jens Suedekum, and Nicole Woessner, “Robots and the Rise of European Superstar Firms,” DICE Discussion Paper, No. 347, July 2020.
- See Rochester Cahan and Yu Bai, “Robots and Artificial Intelligence: Margin Magnifiers?,” Empirical Research Partners, Portfolio Strategy, December 2022.
- These figures are adjusted for stock splits.
Celia Dallas - Celia Dallas is the Chief Investment Strategist and a Partner at Cambridge Associates.
About Cambridge Associates
Cambridge Associates is a global investment firm with 50+ years of institutional investing experience. The firm aims to help pension plans, endowments & foundations, healthcare systems, and private clients achieve their investment goals and maximize their impact on the world. Cambridge Associates delivers a range of services, including outsourced CIO, non-discretionary portfolio management, staff extension and alternative asset class mandates. Contact us today.