US Real Estate Outlook: Patience Required


Investors looking for certainty regarding investment outcomes may not find it in some real estate markets during the remainder of 2021. After a tumultuous 2020 for markets, aggressive policy intervention and improving vaccines news mean most risk assets have fully recouped previous losses. Some real estate investments are exceptions to this rule given uncertainty over the impacts of COVID-19 and whether some of the shifts in consumer and corporate behavior seen last year will prove permanent. This paper discusses recent trends in US commercial real estate fundamentals and looks ahead to what might be in store for the remainder of 2021. Overall, we are reluctant to sound overly bullish about the broad asset class, as the outlook for some sectors is unclear. Still, for investors looking to immediately deploy capital, we highlight two categories of opportunities. One is markets currently experiencing dislocation or distress, including bridge lending and categories with stressed fundamentals, such as hotels. The second is strategies that continue to benefit from secular tailwinds, including single-family home rentals (demographics) and data centers (digitization).
Looking Back on 2020
The spread of COVID-19 across the United States in early 2020 sent risk markets into a tailspin, and real estate was no exception. Shutdowns and quarantines caused economic activity to grind to a near-halt by the end of first quarter, with travel and leisure companies especially impacted. Activity in other industries carried on but often featured changing operating models; for example, many companies shifted to remote work, and retailers adopted to consumers moving online. Massive amounts of fiscal and monetary stimulus revived markets and eventually the economy during the second half of 2020. Still, real estate assets were laggards, with publicly traded equities (real estate investment trusts, or REITs) and commercial mortgage–backed securities (CMBS) finishing the year in the red.
Public REIT sector (and subsector) returns reflect differentiation between perceived COVID-19 “losers” (e.g., retail and office) and “winners” (e.g., industrial and data centers), reinforced by hard data. Rising vacancy rates—and, in some cases, increased supply—put pressure on net operating income growth in sectors like retail, office, and apartments as 2020 ended (Figure 1). Property pricing and returns also reflected the influence of long-running secular trends, such as e-commerce, which have been accelerated by COVID-19. The growth of online shopping increased retail vacancies in 2020, though to a lesser degree than after the financial crisis, given this trend has been many years in the making. Conversely, rising demand for delivery and higher rents continued to boost pricing for industrial assets like warehouses. Industrial assets were one of the few major sectors experiencing positive rent growth year-over-year in third quarter (3.5%). Broad trends mask dispersion within categories; for example, more resilient free-standing retail properties anchored by tenants like grocery stores fared much better than regional malls.
FIGURE 1 REIT RETURNS HAVE SHOWN HIGH DISPERSION ACROSS SECTORS
As of March 31, 2021 • Percent (%)
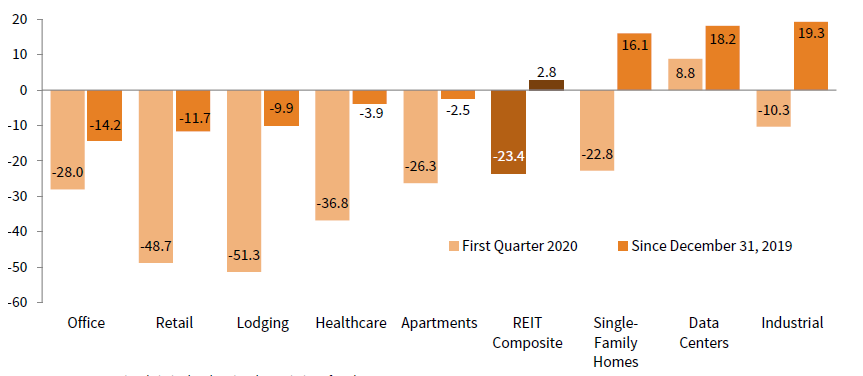 Sources: FTSE International Limited and National Association of Real Estate Investment Trusts.
FIGURE 2 VACANCY RATES HAVE RISEN FOR MOST PROPERTY TYPES
US Property: Vacancy Rates by Property Type • First Quarter 1999 – Fourth Quarter 2020 • Percent (%)
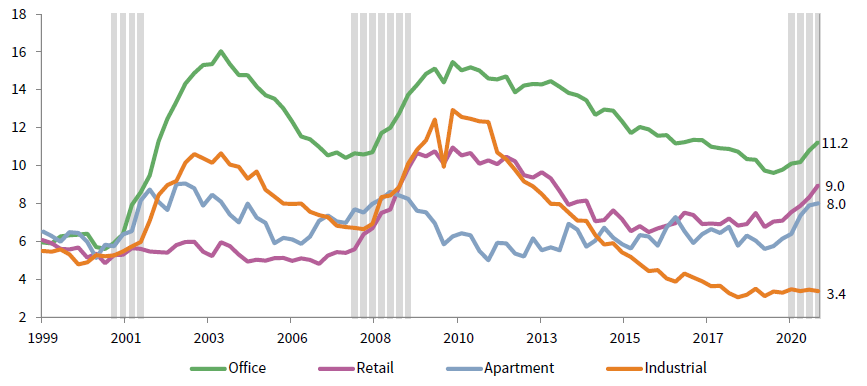 Sources: National Bureau of Economic Research (NBER) and National Council of Real Estate Investment Fiduciaries.
Notes: Data are quarterly. Gray bars represent NBER-defined US recessions.
Outlook for 2021 and BeyondREIT (and private property index) returns reflect shifting fundamentals, but low transaction volumes, as well as subdued business volumes, for some of the underlying categories like retail and hotel also make it difficult to ascertain real valuations. According to CBRE, overall sales of US commercial real estate fell around 33% in 2020. Transaction volumes in hotels (70%) and retail (44%) saw the largest declines, but price discovery in categories like industrial (-16% year-over-year) was more robust.
The outlook for US commercial real estate during the remainder of 2021 is mixed. The broad macro backdrop is positive, with US GDP growth expected to rebound to around 6.5% given recently announced stimulus. In turn, employment and household formation should rise, boosting categories like housing. Heading into January, pricing often reflected a discount for assets with limited visibility over fundamentals, but in recent weeks, a value/reflation trade in the market has boosted returns for previous laggards such as hotel and retail. The net result is that valuations are elevated across property types, with cap rates anchored by low Treasury yields (Figure 3). Even if news around vaccines disappoints and the recent back-up in interest rates persists, private real estate funds are sitting on at least $200 billion of dry powder, according to our data, providing a backstop for valuations and potentially dampening the distressed cycle.
FIGURE 3 CAP RATES ARE ANCHORED BY LOW TREASURY YIELDS
US Property Market Cap–Based Cap Rates by Property Type Versus 10-Yr US Treasury Yields • First Quarter 1993 – Fourth Quarter 2020 • Percent (%)
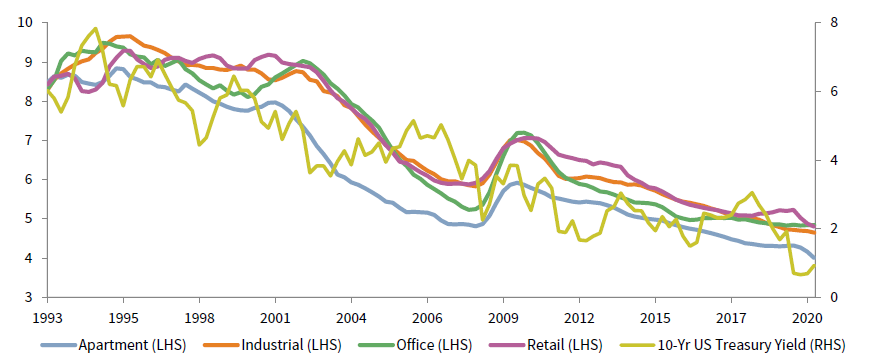 Source: Federal Reserve, National Council of Real Estate Investment Fiduciaries, and Thomson Reuters Datastream.
Notes: Data are quarterly. The market cap–based rate is based on appraised value.
Looking ahead, ecommerce adoption by consumers was a pre-existing trend that was accelerated by COVID-19 and will continue to underpin demand for industrial assets like warehouses and distribution centers. Demand has been especially strong for so-called “infill” assets, warehouses close to population centers that can help facilitate same-day delivery. The flipside is that these tailwinds have not gone unnoticed. Investors have pushed cap rates lower in recent years, and developers have increased supply. The supply of US industrial property hitting the market rose to equal nearly 2% of outstanding stock, a pace only exceeded by multifamily, pushing industrial REIT vacancy rates to nearly 6%. Industrial cap rates have also fallen to historical lows given strong recent performance; the 21.6% annualized three-year return on industrial REITs is more than twice the all-equity REIT average.
Data centers are a smaller asset class but also are benefitting from secular trends such as rising internet usage and the expanding need to store and process data. Even before the pandemic further boosted demand for ecommerce and cloud computing, the volume of digital data created globally was rising at more than 30% per annum. Looking ahead, new technologies such as 5G and the Internet of Things will continue to generate demand for new data centers. On a related note, the need for wireless infrastructure (like macro cell towers and small cells) continues to grow due to rising smart phone usage and related data transmission requirements.
The outlook for residential real estate is positive given rebounding employment, though tailwinds are stronger for single-family than multi-family dwellings (apartments). The pace of household formation reached a record in 2020, and existing home sales also reached record levels. Declining mortgage rates helped the median price of an existing home sold in the US increase by 14% year-over-year to $304k in January, a new record. The lack of new single-family home supply in recent years is also a tailwind, as construction plunged after the Global Financial Crisis (GFC) and has only recently started to normalize. Despite a recent increase, single-family home starts today are one-third below their pre-GFC peak. More recently, single-family homes have been supported by the growing (pandemic-related) demand of families seeking more space. In contrast the multi-family outlook is mixed. Suburban apartments are benefitting from remote working, the (related) desire for more space, and diminished appeal of urban amenities during the pandemic. However, some of their success is coming at the expense of urban apartments, which are also being hit by rising supply. According to CoStar, year-over-year rent growth was negative for the highest quality (Class A) apartment buildings in fourth quarter, hurt by a vacancy rate exceeding 11%, while rent growth was slightly positive for Class B and Class C apartments, whose vacancy rates were far lower.
Last year was a difficult time for some retail assets, and secular trends mean the outlook remains subdued for 2021. Government lockdowns and health concerns meant traffic at many shopping centers plunged during the first half of 2020, and so too did rent collections for landlords. Open air shopping centers fared better than enclosed malls, due to essential tenants like grocery stores and pharmacies; but, even here rent collection rates fell as low as 50% at some properties. Looking ahead, bankruptcy filings by large retailers may decline, but e-commerce will continue to rise, allowing some retailers to shrink their footprints. The open question is whether enough restaurants, gyms, and other ecommerce-resistant tenants can compensate for this declining demand; moreover, some of these were hit even worse by the pandemic, and some chains may have permanently closed (Figure 4).Offices face an uncertain future, because the pandemic spurred the growth of remote work arrangements that may outlast the pandemic. While rents and operating income for landlords dipped only slightly in 2020, they may continue to readjust downward as usage rates remain low and office leases come up for renewal. A recent survey by CBRE found that 43% of companies expect their real estate portfolio to shrink significantly in the next three to five years. Some analysts believe overall demand for office space could drop from 10%–15% over the next several years, hurting values. Still, there is a more constructive case to be made. Supply has increased at a measured pace (less than 1% annually) in recent years, although it is picking up in certain cities (e.g., San Francisco, Miami, and Charlotte). Remote work may work well for tenured employees, but it may make onboarding new hires more difficult and may inhibit collaboration. Trends can change, and one potential tailwind for offices is that companies may reverse recent “densification” efforts and plan for more space per employee in the post-pandemic world. Still, the growing share of companies allowing employees to work remotely suggests ample opportunity to trim needs for office space in the years ahead.
FIGURE 4 APARTMENTS AND RETAIL HAVE SEEN SHARP DECLINES IN NOI GROWTH
First Quarter 1993 – Fourth Quarter 2020 • Percent (%)

Source: National Council of Real Estate Investment Fiduciaries.
Hotels have been among the commercial property types most negatively impacted by COVID-19, although the outlook may vary across the segment. The US hotel occupancy rate stands at just 52% and remains around 25% below pre-pandemic levels. Similarly, revenue per available room is still down around 40% from levels seen in 2019, and Standard & Poor’s recently estimated it may not recover to 2019 levels until 2023. Within the category, extended stay and limited service hotels have seen much smaller drops in vacancy than full-service peers, and areas with more COVID-19–related restrictions fared worse than others. As COVID-19–related restrictions ease, personal travel is expected to rebound swiftly; however, business-related travel might remain subdued, as companies have experienced success with cost-effective virtual meetings. The outlook for some central business district hotels is thus precarious. Some have permanently closed, although some may be converted into other uses, such as office, assuming cost effectiveness and market dynamics are supportive.
Tactical Opportunities Arising from Recent Dislocation
Real estate–backed debt and loans have been impacted by the COVID-19 pandemic. Some now offer higher potential returns, but the timeframe for this opportunity is unclear. Spreads on lower-rated tranches of commercial mortgage–backed securities (CMBS) are well above historical medians and trade at a multiple of comparably rated corporate bonds. Specific deals with large exposures to asset classes like retail and lodging have particularly high spreads. Aside from uncertain fundamentals, these bonds have also underperformed as they were never eligible for Federal Reserve programs that contributed to the dramatic post first quarter 2020 spread tightening in many credit markets (Figure 5).
FIGURE 5 CMBS SPREADS REMAIN ELEVATED
US Corporate Bonds and Non-Agency CMBS OAS Over Time • January 31, 2011 – March 31, 2021 • Basis Points
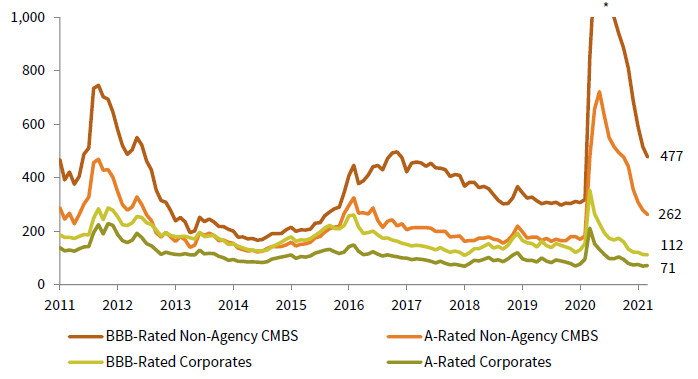
* The y-axis of the graph is capped at 1,000 for scaling purposes.
Source: Bloomberg Index Services Limited.
Notes: Data are monthly. A-Rated Corporates are represented by the Bloomberg Barclays A Corporate Bond Index, BBB-Rated Corporates are represented by the Bloomberg Barclays BBB Corporate Bond Index, A-Rated Non-Agency CMBS are represented by the Bloomberg Barclays A Non-Agency CMBS Index, and the BBB-Rated Non-Agency CMBS are represented by the Bloomberg Barclays BBB Non-Agency CMBS Index.
Looking ahead, it may be too early to sound the “all clear” for some of these assets. Delinquency rates on underlying loans have stabilized but remain elevated, and uncertainty remains over values for assets like regional malls and hotels, should properties need to be liquidated. That said, there are opportunities for investors in this $500 billion market, both because downgrades by rating agencies force sales of CMBS tranches by rating-sensitive investors, causing prices to overcorrect, and because sales (auctions) of the properties themselves by the CMBS issuers can result in favorable pricing for acquirers with the time horizon to turn them around.
Spreads have also increased on new commercial real estate loans, as traditional lenders pull back. According to the Mortgage Bankers Association, commercial real estate lending volumes fell 30% in 2020, with an even bigger decline seen in categories such as hotel (-77%) and office (-50%). Loan-to-values have decreased as lenders have become more conservative. With $430 billion of existing commercial real estate debt maturing in 2021, a growing number of borrowers will be forced to agree to lower valuations and higher spreads, and some borrowers may have to inject equity into deals. Lock-up private debt funds are available, which participate in these markets. Depending on leverage and exact strategy employed, these lending funds typically target mid to high single-digit returns. Higher-risk strategies, for example transitional loans being made to specialist investors to acquire and improve buildings, typically offer higher returns (Figure 6).
FIGURE 6 CMBS DELINQUENCY RATES REMAIN ELEVATED FOR LODGING AND RETAIL
December 31, 2019 – March 31, 2021 • Percent (%)
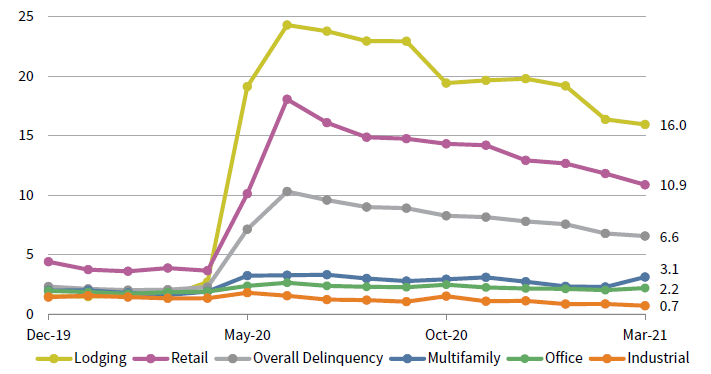
Source: Trepp.
Notes: Data are monthly. The CMBS delinquency rates by property type are 30+ days delinquent.
There are also many options for investors seeking to capitalize on growing distress in some corners of the market, though the cycle may be in its early innings. Real Capital Analytics recently estimated there was around $150 billion of distressed or soon to be distressed commercial real estate in the US market, though much of this is concentrated in hotels and retail. Delinquency rates on hotel-backed loans within CMBS deals are almost 16%, and retail property–backed loans are around 11%. Forbearance agreements mask an even higher number of troubled loans, and in the months ahead many of these agreements will expire and potentially push distressed ratios higher. For now, banks are not foreclosing on properties, and distressed sales have been few, accounting for around 1% of volumes in fourth quarter. Eventually, however, owners will face difficult choices, which include injecting more equity or turning over the keys. A variety of funds are seeking to capitalize on the expected increase in asset sales by investors like banks and CMBS trusts. Given limited transaction volumes, investors may be best served by trying to gain access to these opportunities via diversified funds, though if transaction volumes increase, sector-focused distressed funds (e.g., hotel-focused) may be better served to play the opportunity. Private equity funds that own loan servicers, and thus have unique insights into underlying tenant and collateral performance, may be well placed to benefit from future distressed liquidations.
Longer-Term Secular Opportunities
Data centers, which host network equipment and computer systems, are an attractive way to play secular themes such as rising mobile phone usage and the explosion of data stored in the cloud. The global data center market in recent years has attracted around $25 billion per year of new investment (on a global basis). Still, growth prospects are robust, as pre-existing trends have been accelerated by the pandemic and coincide with growing demand from tenants like telecom companies and software firms. Specialist funds exist that both buy and manage existing data centers as well as construct new facilities for tenants. Valuations have risen; but this is not a homogenous asset class, and skilled managers can add value both from a development and facility-management perspective.
The preference of Americans for single-family housing is far from a recent trend, and another secular opportunity is the growth of single-family rentals (SFR) as a business. SFR landlords raise capital through both private closed-end funds and publicly traded REITs and amass pools of thousands of single-family homes. Rental income from these homes funds an annual distribution to investors, with additional upside from home price appreciation. This opportunity is not new or undiscovered; in fact, SFR REITs returned more than 19% per year during the last five years, more than double the annualized return on the Nareit index. However, institutional investors own just 2% of all SFH rentals, and demand is increasing from both dedicated (private) SFR funds and core funds that include exposure to SFR. Remote working and faster household formation rates in the years ahead may also create tailwinds. Technological advances have improved investor operating models, boosting returns. Landlords often use algorithms to screen and bid for new listings, anticipate maintenance costs, and screen tenants. While valuations for many of these assets are no longer cheap, fundamentals are strong. SFR REITs posted growth in funds from operations in 2020, unlike many other REITs and, in particular, multifamily (apartment) competitors.
Conclusion
The pandemic seemed to create more risk than opportunity for commercial real estate investors in 2020, but conditions are changing as 2021 gets underway. Given the rebound in pricing yet persisting uncertainty over fundamentals in many segments, investors should be selective with new investments. Depending on an investor’s risk tolerance, wider spreads in some credit markets offer opportunities, as does the potential for forced selling by overleveraged borrowers or some CMBS trusts. Taking a longer-term view, we are constructive on secular winners like data centers and single-family housing. While we are not unique in seeing these opportunities, and pricing for both has risen, we believe skilled operators should be able to generate operating efficiencies and boost margins for both assets.
INDEX DISCLOSURES
Bloomberg Barclays A Corporate Bond Index
Publicly issued US corporate and specified foreign debentures and secured notes that meet the specified maturity, liquidity, and quality requirements. To qualify, bonds must be SEC registered. This index is the A component of the US Corporate Investment-Grade index.
Barclays BBB Corporate Bond Index
Publicly issued US corporate and specified foreign debentures and secured notes that meet the specified maturity, liquidity, and quality requirements. To qualify, bonds must be SEC registered. This index is the BBB component of the U.S. Corporate Investment-Grade index.
Bloomberg Barclays A Non-Agency CMBS Index
The Bloomberg Barclays CMBS Index has been designed to measure the performance of the commercial mortgage-backed securities (CMBS) market. This Index is the A component of the CMBS Non-Agency Index. The Non-Agency classification captures non-agency mortgage pass-throughs in the United States and mortgage pass-throughs denominated in non-USD currencies.
Bloomberg Barclays BBB Non-Agency CMBS Index
The Bloomberg Barclays CMBS Index has been designed to measure the performance of the commercial mortgage-backed securities (CMBS) market. This Index is the BBB component of the CMBS Non-Agency Index. The Non-Agency classification captures non-agency mortgage pass-throughs in the United States and mortgage pass-throughs denominated in non-USD currencies.
FTSE EPRA/NAREIT Developed Total Return Index
This Index Series is broken down into eight index families and 141 indexes in Asia Pacific, Europe, and North America. The FTSE EPRA/NAREIT Developed Total Return Index is in USD terms.
NCREIF Property Index (NPI)
The index is a quarterly, unleveraged composite total return for private commercial real estate properties held for investment purposes only. All properties in the NPI have been acquired, at least in part, on behalf of tax-exempt institutional investors and held in a fiduciary environment. Data represent trailing four-quarter NOI growth. Data are quarterly.
Wade O’Brien - Wade O’Brien is a Managing Director for the Capital Markets Research team at Cambridge Associates.
About Cambridge Associates
Cambridge Associates is a global investment firm with 50+ years of institutional investing experience. The firm aims to help pension plans, endowments & foundations, healthcare systems, and private clients achieve their investment goals and maximize their impact on the world. Cambridge Associates delivers a range of services, including outsourced CIO, non-discretionary portfolio management, staff extension and alternative asset class mandates. Contact us today.