Making Waves: The Cresting Co-Investment Opportunity


Executive Summary
- Co-investing is gaining popularity and theoretically offers investors cost advantages and higher return potential. This report frames the opportunities and common pitfalls of co-investing, leveraging our aggregated data on co-investments and funds generating co-investment.
- Our analysis shows that co-investment returns have the potential to outpace private fund investment returns. Of over 100 buyout co-investments analyzed in one exercise for this report, nearly half outpaced the sponsoring GP’s fund. Furthermore, investments by buyout-focused co-investment funds, analyzed on a gross basis to reflect the lighter fee load of direct co-investing, outperformed the net global buyout index in seven out of the ten vintage years examined. Of course, not every individual co-investment outperforms, and therein lies the rub.
- Implementation is trickier than it may seem at first glance. A direct approach affords investors the most control, but also entails the most risk. To enhance the probability of success, investors that choose to pursue a direct co-investment program should:
- Think carefully about program goals, set realistic expectations, and factor in existing (and potential) co-investment exposure via funds-of-funds.
- Establish internal processes to facilitate timely investment decisions as well as effective investment monitoring and performance measurement.
- Prepare and identify necessary resources.
- Work with internal or external professionals with direct investment experience—co-investing is not as passive as it may appear.
- Invest with GPs on which they have done due diligence and in which they have conviction—investors will likely need to rely heavily on the GPs due diligence.
- Focus on investments within each GP’s stated strategy, or “strike zone,” to avoid adverse selection.
- Not ignore the macro. Investors should be extra careful in frothy pricing environments and monitor opportunities for indications of procyclicality.
Private investing without a fee drag! Directly invest in the best companies alongside the best general partners! The headlines resound, while GP offerings and investor interest in co-investments swell. Based on our estimates, LP co-investment activity accounts for upwards of 5% of overall private investment activity, and many investors are considering whether and how to participate in this activity going forward.
Co-investments, or primarily passive direct investments into portfolio companies alongside a fund at the invitation of the GP, are not a new phenomenon. But the strategy’s popularity has grown as institutional investors increasingly seek ways to invest more private capital with select GPs at a reduced cost, often at more than half-off the prevailing cost of access. GPs are offering more co-invest—a preferred approach over investing alongside other GPs as a consortium—as a way to differentiate themselves with the LP community, deepen relationships with key investors, manage their own risk, and maintain greater investment flexibility for themselves.
Make no mistake; despite what some studies have suggested, co-investment returns have the potential to outpace private fund investment returns. Of over 100 buyout co-investments analyzed in one exercise for this report, nearly half outpaced the sponsoring GP’s fund. Furthermore, investments by buyout-focused co-investment funds, analyzed on a gross basis to reflect the lighter fee load of direct co-investing, outperformed the net global buyout index in seven out of the ten vintage years examined. Of course, not every individual co-investment outperforms, and therein lies the rub.
Investors should look beyond co-investing’s siren song of lower cost and potentially higher returns to its implementation options, requirements, and risks, which make it a strategy not for the faint of heart. Implementing a co-investment program is trickier than it may seem at first glance, especially when markets are frothy—as aggregate investor behavior tends to be procyclical.
By leveraging our aggregated data on co-investments and funds generating co-investment, this report frames the opportunities and common pitfalls of co-investing. After briefly reviewing the challenges of analyzing this even more private aspect of private markets we examine the major drivers for co-investing, the key risks, and the practical considerations involved in implementation so that investors can proceed with eyes wide open.
Getting Your Feet Wet: Understanding Co-investments
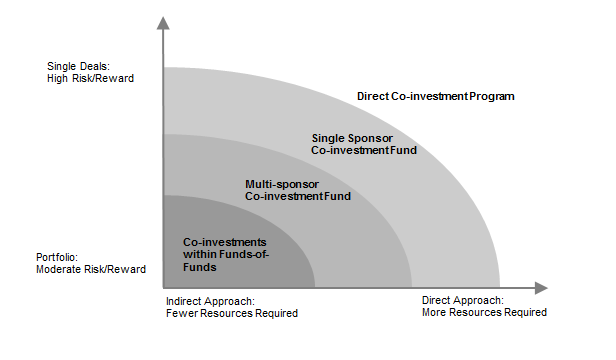
Investors have at least four different ways to pursue co-investment:
- Invest in a fund-of-funds (FOF) with an allocation to co-investments;
- Invest in a diversified co-investment fund;
- Invest in a single GP’s co-investment fund; and
- Directly co-invest alongside a GP in one or more companies.
These ways to invest are arranged on a spectrum on the next page reflecting risk-reward and resource competitiveness.
Co-investment Allocations within a Fund-of-Funds
Many investors gain exposure to co-investments through their “regular” FOF investments. Co-investments typically compose 5% to 15% of many FOFs, but this figure has risen to as much as 50% for some FOF strategies. Sometimes FOFs charge slightly higher fees on the capital they deploy in co-investments (in contrast to their pricing of multi-sponsor co-investment funds) than what they charge on their fund investments. At other times, the FOF fee is flat across all types of underlying investments. While a co-investment portfolio adds risk to the FOF portfolio, the performance is embedded within the FOF’s fund portfolio. While FOFs typically deliver lower losses but fewer outsized wins (whether or not they include co-investments), those that charge a flat fee across their investment types have a motivation to include co-investments as a way to negate the FOF fee drag of 200 bps to 400 bps and manage the J-curve, thus creating potential for more alpha.
Multi-Sponsor Co-investment Funds
Multi-sponsor co-investment funds, typically managed by an advisor, FOF, or similar asset manager with many GP relationships, offer layered co-investment exposure. LPs invest in a basket of co-investment opportunities that the advisor or FOF sources from its own manager relationships. Some advisors and FOF managers of these multi-sponsor co-investment funds charge something closer to a 1% management fee and 10% carried interest, significantly less than the traditional private investment fund fee structure of 2% and 20%.
Despite the lower cost of these multi-sponsor vehicles, investors should be aware that this is primarily a passive, yet direct investment strategy they are using to increase their exposure. These products are ultimately diversified by the number of investments included and by sponsoring GP, reducing the overall risk profile of the co-investment program and potentially the return profile as well. This approach can also provide participating LPs with an association upon which to build a relationship for access to GPs not in their own programs. The performance of multi-sponsored co-investment funds has been mixed. Of 34 funds analyzed in this report, 25—nearly three-quarters—were performing below the median performance levels of direct funds of the same vintage years and strategies.
Single-Sponsor Co-investment Funds
Moving along the spectrum, some GPs raise separate co-investment funds to operate alongside the main fund. The strategies of these co-investment funds, at times referred to as “annex funds,” vary considerably and require LPs to understand the guidelines and expected portfolio construction prior to committing. Given that GPs may be sensitive about alienating LPs with which they have pre-existing direct co-investment relationships, this type of vehicle may not receive as complete an allocation as expected, as opportunities may also be offered to LPs outside of the vehicle. Some GP co-invest funds invest in all deals with excess capacity, while others, sometimes in venture, invest only in later rounds of portfolio company financings or in certain types of deals. These single-sponsor vehicles often have a lower fee structure than the core fund, charging fees only on drawn capital, or for administration, or confine themselves to only carried interest to demonstrate some alignment with investors.
LPs committing to annex funds do not make investment decisions on individual transactions. Rather, they are simply accumulating additional exposure to a single GP when (in the GP’s view) circumstances warrant. The ultimate basket of extra exposure often comprises a mixture of underperforming and outperforming deals and the diversification itself generally places this approach lower than direct co-investing on the risk-reward spectrum shown on the next page. All told, of the 39 annex funds raised between 1998 and 2012 analyzed in this report, 25—roughly two-thirds—had outperformed the sponsor’s corresponding main fund as of December 2013.
Direct Co-investment
Directly co-investing alongside a GP is the traditional approach, with LPs accessing opportunities via their GP fund commitments. They are not obligated to participate or deploy a specified amount of capital, but rather are positioned to see deal flow from sponsors and then make co-investment decisions on a case-by-case basis. With control over investment decisions, LPs can design a co-investment portfolio based on their desired investment characteristics and corresponding return expectations. Historically, GPs often charged a co-investment fee in these situations, but most managers have been offering traditional direct co-investing on a carry-free and management fee–free basis (though administrative costs are involved) since the global financial crisis; however, the pendulum is starting to swing back to the traditional model as more LPs pursue, and more managers employ, co-investment.
For the most part, co-investment opportunities have a short fuse and this classic approach requires an LP to have a strong relationship with the GP for access to opportunities, quick reaction times, and an internal evaluation process that likely leverages to a great extent the GP’s due diligence, because direct access for independent verification is not common. A direct approach affords investors greatest control over the co-investment portfolio created. Depending on the desired portfolio characteristics, it can offer the highest potential returns. However, it also entails the most risk, as we discuss elsewhere in this report.
A Spectrum of Co-investment Implementation Options
A Good Set of Universal Co-investment Data Is Hard to Find
A comprehensive data set representing direct co-investments, the focus of this report, does not exist, making it difficult to draw conclusions about how these investments have performed universally. Because co-investments are individual and opportunistic, performance numbers reside within individual investment portfolios. In the absence of centralized and systematically tracked global co-investment data, other studies have generally analyzed one or a few co-investment programs at a time. Going forward, to supplement our analysis of this investment trend, we invite investors or fund managers to confidentially contribute their data to Cambridge Associates for further study.
Our co-investment research methodology uses two different data sets that simulate the behavior of direct co-investors and represent co-investments offered to fund investors. Specifically, we look at the investment-level performance of co-investment funds and fund-of-funds (FOFs), two specific groups of LPs that have been particularly active as co-investors, as proxies for professional, institutional investors. Examining the transactions in which these cohorts invested offers perspective into the opportunities offered to them by GPs and those they chose to pursue. While investors should bear in mind that these FOF LPs are also fund managers themselves, with some motivations that may differ from individual investors, we can still draw some inferences from their patterns of behavior. In this report, we have focused on their gross results—often comparing them to the net results of buyout funds—as an illustration of the co-investments on offer by GPs. We assume that investors could have participated in these individual transactions versus the investable alternative of traditional private equity funds, and have analyzed their performance accordingly. Following this approach, this report has examined over 500 co-investments done by over 40 co-investment funds and FOF managers.
Why Consider Co-investments?
Returns, Returns, Returns
Investors have several good reasons to consider co-investments. For starters, they offer a lower cost of access to private strategies. Hypothetically, all else being equal, the absence of the normal “2 and 20” structure should increase investors’ returns. While in reality there will still be some administrative fees, those costs are lower than management fees paid to fund sponsors. Avoiding fund-level fees and carry will reduce overall performance drag.
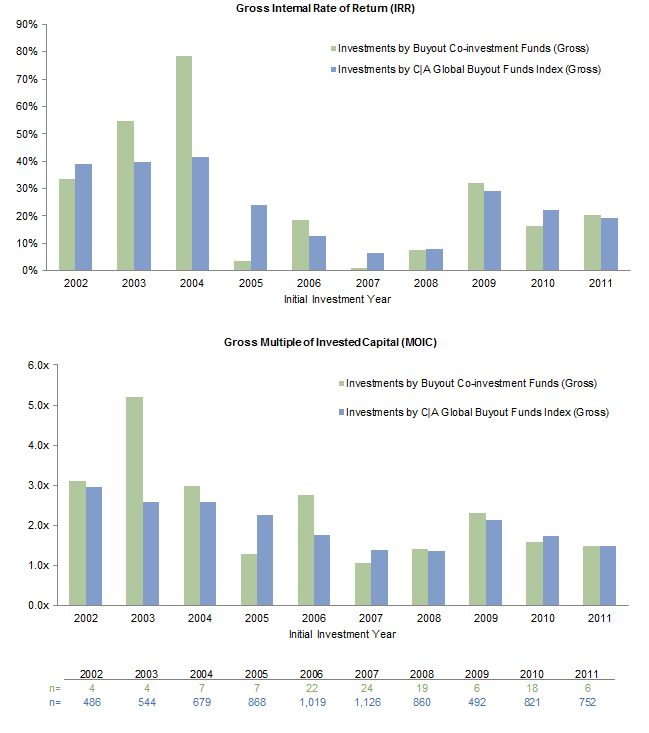
Our analysis suggests that individual co-investment outperformance is not just hypothetical, it is, in fact, possible. Figure 1 compares the performance of (1) buyout co-investments 1 made by single and multi-sponsor co-investment funds and (2) global buyout funds. 2 As noted, we analyzed the gross, transaction-level results of the former, which represents performance without a fee drag (the ideal co-investment case), against the net results of the latter to represent investable choices—co-investments that GPs offered on an individual basis. In practice, with some administrative costs, the fee drag on direct co-investments would place their performance somewhere in the middle of gross and net, but likely closer to the gross results. Using two different metrics—multiple of invested capital (MOIC) and internal rate of return (IRR), co-investments outperformed buyouts in seven of the ten vintage years examined. On an MOIC basis, this outperformance was on average 1.3x higher, ranging from 3.4x in the best year, 2003, to 0.4x in 2011. Using an IRR calculation, the average return spread between gross co-investment fund IRRs and net fund IRRs was also significant, averaging about 24%, with a range from 7% to 67%. In the three years that co-investments underperformed, the under-performance spread was much tighter at 0.03x to 0.32x on an MOIC basis and from roughly 4% to 10% on an IRR basis.
Figure 1. Buyout Co-investments Can Indeed Outpace Buyout Funds
As of December 31, 2013
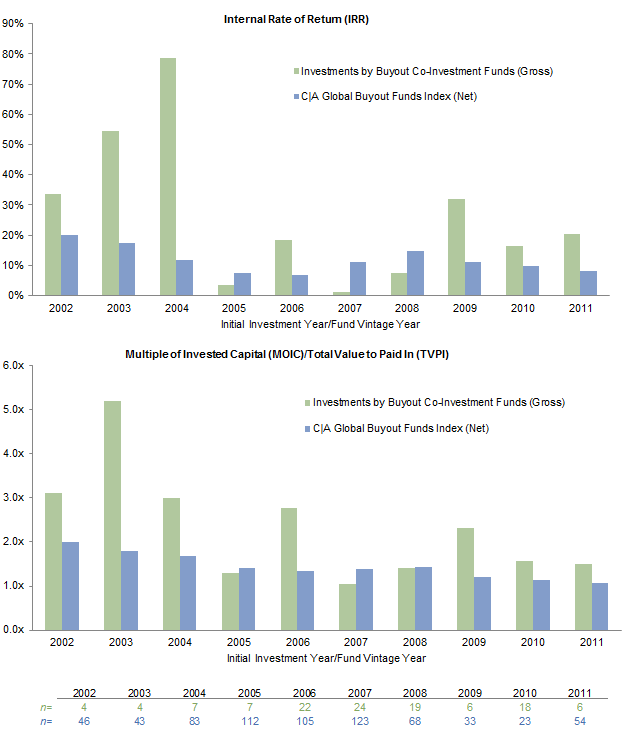
Source: Cambridge Associates LLC Private Investments Database.
Notes: Pooled returns for C|A Global Buyout Funds Index are net of fees, expenses, and carried interest. MOIC and TVPI are cumulative distributions and current net asset value (TVPI) or market value (MOIC) divided by cumulative paid-in or invested capital. Companies with an initial investment year after 2011 and funds formed after 2011 are too young to have produced meaningful returns.
J-Curve Mitigation
Even the most expensive multi-sponsor co-investment funds are typically cheaper than plain vanilla private equity. And when there is little to no fee drag on uncommitted capital, the J-curve (the J-shaped dip in performance in the early years when fees and drawdowns exceed distributions from the investment) is muted. Direct, single co-investments can further mitigate an overall private investment portfolio’s J-curve because capital is deployed immediately, allowing investors to avoid paying up to five years’ worth of management fees on not-yet-deployed capital.
High-Efficiency Investing
Co-investing can concentrate capital normally reserved for diversified fund investments into a single position in a company or a handful of positions in companies, which can be very efficient provided that performance is as expected. The outcome itself is linked only to that one investment (or handful of investments) rather than a portfolio and therefore may require different risk-reward parameters than those expected from a fund investment, a characteristic that should be understood by all involved. Institutions pursuing co-investments should accept that diversification is occurring at the private investment program or strategy level rather than the investment level, and that the risk of loss is higher.
Tailored Portfolio
Assuming sufficient deal flow, co-investing enables investors to build a portfolio to their liking as opposed to one reflecting a GP’s vision. Without the constraints of a fund, co-investors can focus on specific company attributes, and sectors and regions of interest, among other factors. They also have more control over pace and can ramp up a portfolio quickly or choose when to stay out of the market, provided they have sufficient access to quality opportunities.
Opportunity to Become a Better LP
Participating in a GP’s co-investment program can also provide an LP with qualitative benefits such as the opportunity to gain expertise, enhance its reputation as a savvy, strategic partner, and strengthen its relationship with the sponsor, which may result in greater access to the GP’s funds. Co-investments can also be a way for investors to initiate a relationship with a GP. In either case, investing alongside a sponsor is an opportunity for more rigorous due diligence and insight into the GP’s processes and investment behavior, which will inform the investor’s decision on whether to invest in the GP’s future funds.
But Before You Dive In: It’s Not as Easy as It Looks
Pursuing co-investments seems straightforward: as an LP, you simply (1) tell your GPs that you want to co-invest with them, (2) evaluate the co-investments they show you, and (3) invest in the most compelling ones. However, as anyone who has tried to stand on a surfboard for the first time knows, keeping your balance—i.e., properly implementing—is more complicated than it seems.
Direct Co-investing Requires the Right Skillset
The expertise required to evaluate and select private investments involves industry and operating knowledge and is different from fund selection expertise. Investors considering direct co-investments should determine whether they have or would like to add the appropriate skills in-house, work with an advisor, or would prefer to outsource the activity entirely to an advisor or fund manager. If the decision is to pursue co-investment in-house, staff with direct investment experience must be hired with commensurate compensation and performance incentives, adding another layer of complexity and cost to institutional investor teams.
One Must Find One’s Own Co-investments
Direct co-investors must regularly remind target GPs of their interest to see sufficient and attractive deal flow. Even then, access can be challenging when many others are competing for the same opportunities. Building strong relationships with GPs for co-investment opportunities can run counter to maintaining appropriate objectivity when evaluating funds, adding another degree of complexity to a private investment program. GPs may prefer to work with investors they perceive to be savvy about target markets or to have a particular network or industry viewpoint that could prove useful. Finally, some GPs may not offer co-investment opportunities.
LPs considering co-investing should be sure to clarify their co-investment rights—as well as the associated economic terms—alongside their fund investments, to ensure they have equitable access to co-investment opportunities. The potential conflicts around these allocation decisions are moving into the public eye. Indeed, in the May 2014 edition of our Quarterly Regulatory Update we noted “the SEC staff’s focus on potential favoritism, including . . . how firms allocate access to co-investment deals.” The impact of such SEC inquiries is not yet known, but the outcome will likely be equal access for all LPs to co-investment opportunities, benefitting those with an established co-investment evaluation and approval process.
Timing Is Unpredictable
The timing of co-investments is unpredictable because it is based on deal flow. GPs are likely to syndicate co-investments to their investors when capital accessible via their main funds is low. This could occur for different reasons and at different points in either the fund-raising or economic cycles. Examples include:
- Fund capital may be sparse because a GP is in the early stages of fund raising or is having difficulty securing commitments;
- Fund capital may be sparse because the GP is near the tail end of its investment period when the opportunity arises;
- The opportunity is simply larger than the GP’s stated strategy; and
- The GP is reaching a concentration limit in its fund.
Approval in “30 Minutes or Less”
Even if the right professionals are in place and the co-investment pipeline is full, opportunities must often be considered on abbreviated timelines, as described earlier. Once a GP decides to pursue an investment, interested co-investors may have as little as two weeks to review available information, conduct their own assessment of the opportunity, both from an investment and legal perspective, decide whether to participate, and then secure internal approval. Investors that have not established an evaluation and approval process ahead of time may find themselves gasping for breath when a live opportunity arrives. And failing to meet GP timelines or overwhelming the GP with requests for data or access to advisors or company management could impact the GP’s willingness to share future opportunities, impacting the investor’s pipeline.
Finding a Pearl … or Just an Oyster
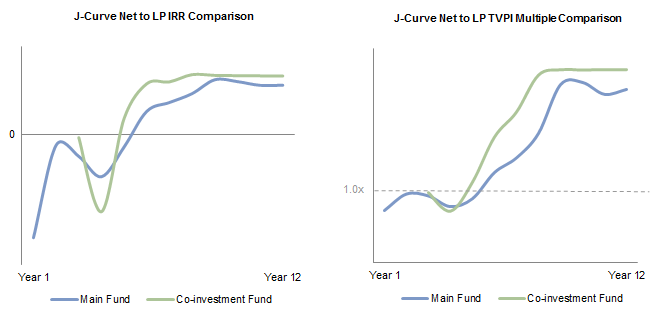
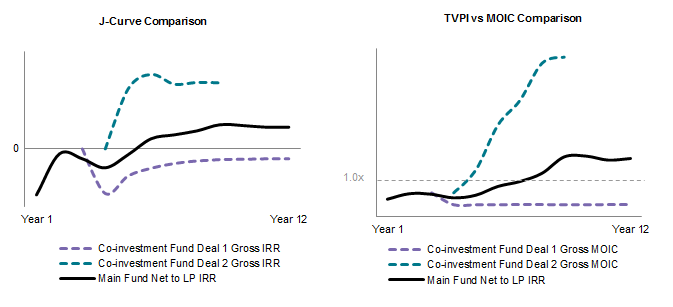
Direct co-investing offers investors the potential—by no means guaranteed—to try their hand at selecting which of a GP’s co-investment opportunities will outperform, and to add exposure there. As an illustration, Figures 2a and 2c compare the performance of two buyout funds against the co-investment funds offered alongside those vehicles. In both cases, the co-investment funds tracked closely or even above the main vehicles. Disaggregating the investments in the corresponding co-investment funds in Figures 2b and 2d, however, reveals a wide range of outcomes. An investor would have done well only if these co-investment opportunities were offered individually and it picked the right ones.
Figure 2a. J-Curve Comparison of Buyout Fund Y to its Co-investment Vehicle
LPs investing in the co-investment fund of this buyout fund had a good overall outcome …
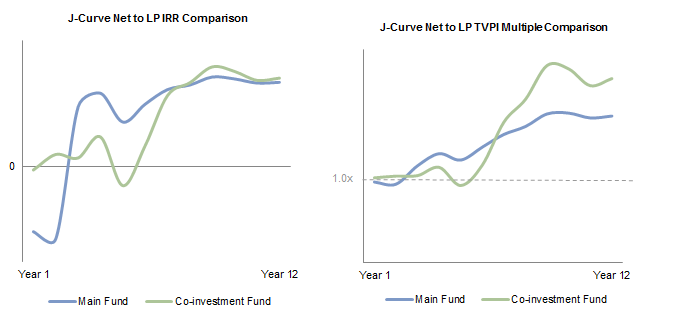
Source: Cambridge Associates LLC Private Investments Database.
Notes: Returns are net of fees, expenses, and carried interest. TVPI is cumulative distributions and current net asset value divided by cumulative paid-in capital.
Figure 2b. Disaggregating Transaction Returns for the Same Co-investment Fund Shows Range of Outcomes
… But LPs investing in the individual transactions could have had a range of results
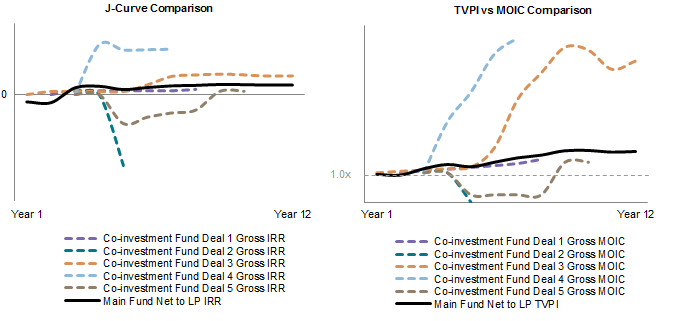
Source: Cambridge Associates LLC Private Investments Database.
Notes: Main fund return is net of fees, expenses, and carried interest. MOIC and TVPI are cumulative distributions and current net asset value (TVPI) or market value (MOIC) divided by cumulative paid-in or invested capital.
Figure 2c. J-Curve Comparison of Buyout Fund Z to its Co-investment Vehicle
Similarly, for another fund—the co-investment fund did well on the whole …
Source: Cambridge Associates LLC Private Investments Database.
Notes: Returns are net of fees, expenses, and carried interest. TVPI is cumulative distributions and current net asset value divided by cumulative paid-in capital.
Figure 2d. Again, the Disaggregated Results Show More Dispersion
… But individual transaction performance varied
Source: Cambridge Associates LLC Private Investments Database.
Notes: Main fund return is net of fees, expenses, and carried interest. MOIC and TVPI are cumulative distributions and current net asset value (TVPI) or market value (MOIC) divided by cumulative paid-in or invested capital.
Too Good to be True?
Even with fund dynamics making co-investments available, investors should be cognizant of adverse selection risk, including the possibility that managers may—knowingly or not—be sharing their less attractive opportunities. However, GPs often have a good rationale for seeking co-investment capital from LPs:
- They have an opportunity that is too large but also too attractive in their professional opinion and estimation to pass up;
- They want more certainty about being able to close a transaction, giving them an incentive to seek capital from trusted sources;
- They want to share the outperformance potential of a transaction with their own LPs instead of their competitors;
- They prefer to have primarily passive rather than active partners; and
- They want to create a stronger relationship with LPs for future funds.
It is worth remembering that GPs assume significant reputational risk with their investors when offering co-investment opportunities. Poor interactions with LPs and poor results could cost future fund commitments; GPs should have significant disincentives to share investments in which they do not have full confidence.
Not Every Wave Runs to Shore
Regardless of whether adverse selection is at work, not every co-investment that a sponsor offers will be a star: evaluating a sponsor’s co-investment performance against its associated funds is a useful indicator. Figure 3 compares the performance of 104 co-investments offered to FOF investors to that of the sponsoring GP’s main fund. The co-investments as a whole slightly underperformed the main funds, with a 1.32x MOIC versus a 1.45x MOIC. Of the total $1.78 billion in capital, 44% (which represented 47% of the transactions by number) was invested in transactions that outperformed the sponsors’ main funds with an MOIC of 2.1x. The remaining 56% of capital was invested in underperforming transactions and was held at 0.8x.
Figure 3. Is Adverse Selection Real?
As of December 31, 2013
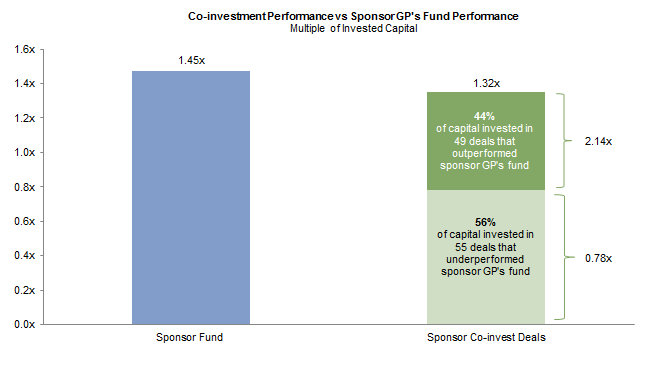
Source: Cambridge Associates LLC.
Notes: Chart shows the performance of 104 direct co-investments relative to the 64 funds that sponsored these opportunities. Co-investment data is gross of fees and expenses and sponsor fund investment is net of fees and expenses. MOIC and TVPI are cumulative distributions and current net asset value (TVPI) or market value (MOIC) divided by cumulative paid-in or invested capital.
Avoiding the Swells
A good time to co-invest may be when a GP fund’s limitations are likely emblematic of a volatile market with less competition, which usually means lower purchase price multiples. Notably, the co-investments analyzed in this report outperformed buyout funds the most in the early 2000s and in 2009; in each case overall buyout and co-investment volumes were low compared to other vintage years (Figure 1). An opportunistic LP may remain more liquid in volatile markets, perhaps holding more cash as dry powder, so as to co-invest while other investors are likely to be on the sidelines.
Conversely, when it is easier for GPs to raise larger funds, and thereby pursue investments outside of their “strike zone,” other investors are more likely to be willing and able to deploy additional capital in co-investments, increasing competition. Furthermore, and as with most investing, at the moments when the case for co-investing looks the best based on strong historical returns and abundant deal flow, markets may also be frothier, ultimately making these more challenging times to invest. This trend is evident in the last decade. Of the capital of the 78 dedicated co-investment and annex funds used in this analysis, 60% were raised in 2006 and 2007, a high valuation environment. As shown in Figure 4, 2007 and 2008 were characterized by record private equity fund raising and high purchase price multiples, followed by the global financial crisis.
Figure 4. Rising Tides
2002–14
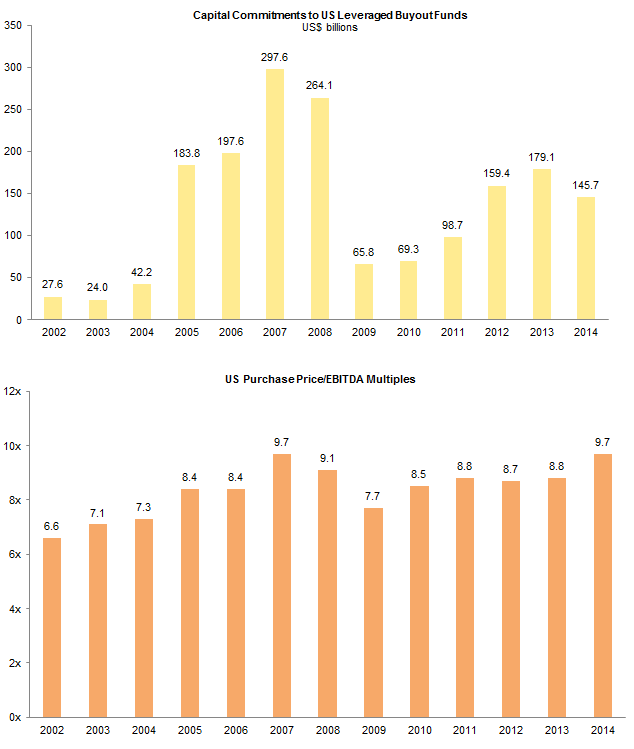
Sources: Buyouts and Standard & Poor’s LCD.
Notes: Fund-raising data for 2014 are as of October 14, 2014. Purchase price multiple data include fees and expenses, and 2014 data are through September 30, 2014.
As shown in Figure 5, the co-investment funds analyzed also deployed capital at high rates in line with the pre-crisis swell in global buyout investments; returns were negatively affected by the subsequent market decline. Indeed, co-investments underperformed global buyouts the most in the mid-2000s. Outsourcing co-investments to a fund manager may heighten the risk of procyclicality, whereas investors co-investing directly or as directed by an advisor can control the pace of investment more easily than an outsourced provider that is paid to deploy capital within a certain timeframe and incented to invest assets under management and raise subsequent funds.
Figure 5. Co-investing Follows Market Cycles
As of December 31, 2013 • US$ millions

Source: Cambridge Associates LLC Private Investments Database.
Note: Data show yearly invested capital for 16 global buyout co-investment funds and 812 global buyout funds representing 142 and 8,853 individual deals, respectively.
Co-investment Performance Measurement—Think Calendar Year, Not Vintage Year
No clear universal guidelines have emerged to assist investors with the question of how to measure performance of co-investments, and typically used benchmarks may not prove useful. For example, vintage year fund benchmarks comprise funds that invest over multiple years with a heavier fee and carry schedule, whereas co-investments are single point investments with wide ranging and often lighter fee and carry overlays. Comparing a single co-investment to a vintage year benchmark composed of funds will not provide an accurate indicator of performance. Individual investment performance could be compared to all deals done by co-investment funds in a given vintage year, but given the limited universe of co-investment funds, there may be years when the data set is small.
Comparing the gross performance of co-investments with that of all private investments made in the same calendar year, regardless of the inception years of the parent funds, is likely the best way to measure performance. The latter, while not technically an “investable” option, is still the best representation of the opportunity set of transactions within discrete time periods. Figure 6 illustrates such a comparison, aggregating transactions by several buyout co-investment funds—the same data set as seen in Figure 1—and comparing them against the aggregate results of all the investments by global buyout funds each year from 2002 to 2011. Investments were grouped in calendar years based on the date of the initial investment in the company. The comparison is on a “gross-to-gross” basis, eliminating any fund-level fees and examining only the investments themselves. The co-investments kept pace with direct buyout deals, outperforming them in roughly half of years by 0.01x to 2.63x on an MOIC basis and between 1% and 37% on an IRR basis.
Figure 6. Global Buyout Co-investments: A Solid Showing
As of December 31, 2013
Source: Cambridge Associates LLC Private Investments Database.
Notes: Gross returns do not take into account management fees, expenses, and carried interest. MOIC is cumulative distributions and current market value divided by cumulative invested capital. Companies with an initial investment year after 2011 are too young to have produced meaningful returns.
Venture Co-investments: Worth the Risk?
Venture-backed companies require capital to scale, but co-investing in them may be more challenging. Unlike their buyout counterparts, the 371 investments by venture co-investment and annex funds that we analyzed in aggregate underperformed the broader venture universe on both an IRR and MOIC basis every year from 2002 to 2011. This is not to say individual venture co-investments have not or cannot outperform or be accretive to one’s portfolio. However, as early-stage investors seek to preserve their positions in companies in early rounds of financing, venture co-investments are more often offered at late-stage rounds when they may also be subject to high valuations. Investors choosing to co-invest in venture should take extra caution when selecting deals in which to participate.

Source: Cambridge Associates LLC Private Investments Database.
Notes: Gross returns do not take into account management fees, expenses, and carried interest. MOIC is cumulative distributions and current market value divided by cumulative invested capital. Companies with an initial investment year after 2011 are too young to have produced meaningful returns.
Let’s Ride This Wave to Shore: Implementation
To enhance the probability of success when co-investing directly, investors should prepare and identify necessary resources, establish clear investment criteria and evaluation and approval processes to evaluate both transactions and sponsors, set up a framework for monitoring and governance, and consider return expectations carefully. Investors that choose to outsource co-investments to a multi-sponsor fund or advisor should use this approach to evaluate any co-investment manager’s process.
Co-investment Program-Level Risk Management
In addition to the typical market and investment risks of any private investment, co-investing raises some unique program-level considerations. For example, investors need to decide upfront how much to allocate to co-investment exposure, how to fund that exposure, and over what timeframe to reasonably achieve that exposure. Because of the nature of co-investment deal flow and the challenges of implementation, there is a real possibility that allocated funds will not be fully deployed, unlike a fund investment where most of the commitment is expected to be fully called over a specific timeframe. On the other hand, individual companies may require follow-on investments. Investors therefore must still plan and budget for the possibility that additional capital might be required— potentially for the target company to navigate a rough economic period or unforseen operating challenge, at which time increasing the investment may feel difficult.
In addition to the allocation and funding complexities, investors need to determine the program’s risk appetite for directly held single company private investments, which should in turn drive transaction sizing criteria and help filter opportunities. Investors should also decide in which strategies and geographies they are comfortable, for additional screening criteria. Investors should plan to regularly monitor and reevaluate their co-investment program construction, performance, and goals against initial expectations and contribution to the overall program.
Resource Requirements and Tradeoffs
Investors considering co-investing should understand the costs associated with each approach, and determine the level of responsibility they are comfortable taking, as well as what trade-offs are involved. For example, traditional, deal-by-deal co-investing requires investors to make a separate decision on each opportunity, whereas none of the fund or fund-like options require LPs to actively opt in. Rather, investors pursuing the single- or multi-sponsor co-investment option usually cannot opt out of individual co-investments, and should, therefore, be ready to accept a full basket of offerings either directly from the GP or as screened by an intermediary.
As discussed—and even with clear processes in place, if going in-house—investors must also consider whether they have the right resources to assess, make, and monitor direct co-investment exposure; and, if not, whether they need to make adjustments or add resources. Likewise, investors must determine how much time they require to make an informed decision, what due diligence materials they will need and who will supply them, whose approval is required, and how they will gather such approvals on short notice. Finally, along with internal resources, investors should also determine which external providers they will work with for services such as legal reviews or supplementary due diligence.
Establish Clear Criteria to Evaluate Sponsors, Terms, and Transactions
Investors contemplating co-invest need to establish criteria for evaluating sponsors, transactions, and terms as well as a clearly defined co-investment approval process. Sponsor evaluation is typically already established and can be easily revisited when required for co-investment assessment. Co-investment terms can vary widely and determining what types of fees or carry arrangement are acceptable ahead of time can assist in decision making.
Regarding co-investment evaluation, while an investor may present as a passive LP, not seeking to “be the GP,” a clear process is still required for sourcing, conducting due diligence, and securing approvals that fulfills an LP’s fiduciary obligations. Deferring process considerations until actual opportunities arise may prove unworkable since timelines are often short. Of course, even with prior planning, direct one-off co-investment opportunities can show up at random and with a short decision period. Sometimes investors may not have the opportunity to conduct full due diligence, even if they have the staff resources to evaluate most co-investments, and instead will have to rely heavily on the work of the GP. Having a basic procedural evaluation and approval framework for such accelerated decision making, as well as identifying key criteria and questions in advance, can improve investment decision consistency and save valuable time in the event an opportunity is not worth pursuing.
Avoid Adverse Selection
Obtaining a GP’s prior co-investment track record and screening out GPs whose co-investments on the whole have historically underperformed their funds can help an investor qualify some of the adverse selection potential—the risk outlined in Figure 3—on offer. Similar analysis should be conducted with respect to third-party co-investment funds to understand whether the fund manager has a demonstrated approach and track record of success in selecting the better opportunities from sponsors.
Seek Optimal Surfing Conditions
Investors should also evaluate whether co-investment opportunities fit the manager’s stated strategy, focus, size, skill set, etc.—and avoid deals that either do not fit within these parameters or appear to be a stretch. As shown in Figure 7, we examined 177 co-investments worth roughly $2.8 billion of invested capital completed between 2004 and 2012. The deals were effected predominantly by FOF managers but also by the dedicated co-investment funds examined earlier in this report.
Figure 7. Stay in the Strike Zone: Co-investments in Sponsors’ Areas of Expertise Outperform Non-Core Deals
As of December 31, 2013
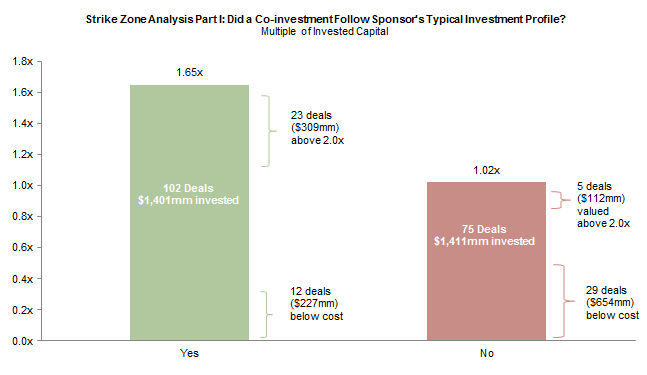
Source: Cambridge Associates LLC.
Notes: Analysis includes 177 co-investments made by funds-of-funds or dedicated co-investment funds from 2004 to 2011. All data are gross of fees and expenses. MOIC is cumulative distributions and current market value divided by cumulative paid-in or invested capital. Co-investments with profiles (e.g., equity check size, sector, and geography) matching the sponsor’s stated target investment profile were categorized as being within the sponsor’s “strike zone.”
We found that roughly half of the capital was invested in the sponsor’s “strike zone,” defined by typical equity check size, sector, and geography. Investments that did not meet any one of these criteria were categorized as being outside the “strike zone”; 94% of these were so categorized because they were larger than the manager’s typical investment, an intuitive result since sponsors are likely to seek additional capital for transactions that exceed portfolio exposure limits. The difference in performance was clear: strike zone investments delivered a 1.65x MOIC, while deals outside of the strike zone tracked only slightly above cost, at 1.02x. More than 20% of the strike zone deals had an MOIC above 2, compared with 7% of the non-strike zone transactions, while just 12% of the strike zone deals were held or realized below cost versus 39% of the non-strike zone transactions.
While a larger equity check may suggest that a GP is moving outside of its stated strategy or investing in larger companies than it typically does, it does not always indicate strategy drift. For example, a GP deploying more capital may simply be seeking to put more capital to work in a company the GP would ordinarily target. To address this nuance, we further examined whether a GP’s adherence to investing within the typical enterprise value range of its portfolio companies affected co-investment outcomes. Figure 8, which examines 75 co-investments by FOFs and co-investment funds, shows a similar result to Figure 7. The results were once again stark: co-investments within the GP’s target enterprise value “strike zone” delivered a 1.46x MOIC, while those outside the enterprise value “strike zone” were held or realized below cost at 0.96x, reinforcing the need to understand and co-invest within a GP’s area of expertise.
Figure 8. Stay in the Strike Zone: Focusing on Target Enterprise Value Shows Similar Results
As of December 31, 2013
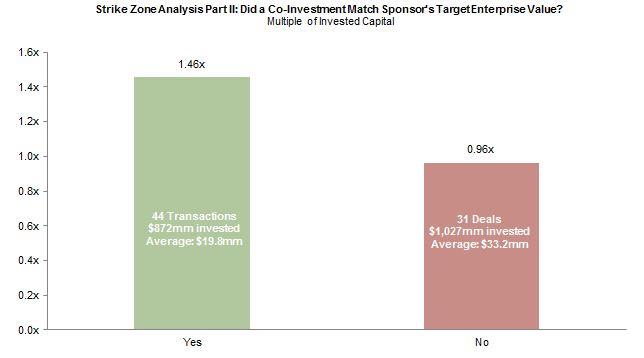
Source: Cambridge Associates LLC.
Notes: Analysis includes 75 co-investments made by funds-of-funds or dedicated coinvestment funds from 2004 to 2011. All data are gross of fees and expenses. MOIC is cumulative distributions and current market value divided by cumulative paid-in or invested capital. Co-investments in businesses with enterprise values matching the sponsor’s stated investment profile were categorized as being within the sponsor’s “strike zone.”
Beyond the GP’s stated strategy, investors should consider all factors affecting the GP’s incentives in a transaction and whether they align with the timing and prospective holding period of the co-investment offering. Finally, of course, investors must evaluate proposed investments both on their own merits as well as relative to other market opportunities.
Consider Return Expectations That May Vary by Deal Type and Size
Investors should identify and understand the rationale underlying their return expectations for a co-investment program. Some may have higher return hurdles for co-investments as they seek to be compensated for the additional risks and concentration they are taking on. Others may see higher returns as driven less by assumption of risk and more as a function of paying lower fees and carry.
Investors should also consider how different types of investments may perform differently. For example, as shown in Figure 9, larger buyout investments tend to exhibit more predictable performance but they also result in fewer big wins. Accordingly, it is not surprising that LPs are less willing to pay a GP traditional fund fees on these transactions, instead requesting access to such opportunities on a co-investment basis. For these larger investments, however, the combination of a lower risk/return profile and no management fees or carried interest may just be a wash in terms of return expectations.
Figure 9. Co-investing Alongside Larger Sponsors in Larger Deals May Mean Fewer Losses but Fewer Big Wins
C|A Global Private Equity Funds Index (Vintage Years 1986–2008) • December 31, 2013 • US$ terms
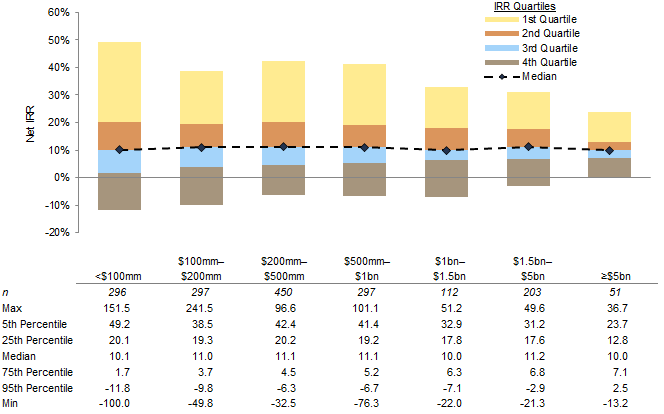
Source: Cambridge Associates LLC Private Investments Database.
otes: Returns are net of fees, expenses, and carried interest. Outliers representing the top and bottom 5% of performers are not shown on the graph.
Monitoring
Investors should determine what level of information and reporting they require about their co-investments on an ongoing basis, especially given their possibly concentrated exposures to these investments. The GP will likely provide monitoring, but co-investors may also have direct information rights they wish to exercise. As noted above, LPs should regularly assess not only each individual company’s financial results, but also the performance of their overall co-investment program against initial expectations.
If You Choose to Outsource
If investing in a single GP co-investment fund, it is critical to ensure that the GP’s incentives are aligned with investors and that any potential conflicts of interest between the co-investment fund and the main fund are minimized. Investors that choose to outsource co-investments through a multi-sponsor product will not need to manage these risks internally, but should carefully vet any outsourced providers to ensure they have the necessary skills, resources, process, sourcing capabilities, and track record to successfully implement the strategy while navigating all of the risks outlined here.
Back on Shore
However, LPs can take proactive steps to try to lower costs and otherwise manage risk: emphasizing alignment with the GP, supporting disciplined fund-raising practices, and pursuing alternative management fee and carried interest models. Some GPs have responded by offering hybrid solutions—limiting main fund sizes and offering more annex funds and co-investment opportunities at low to no cost. On the surface, both parties benefit: LPs can average down the cost of their total dollars at work with a manager, while GPs have more capital to deploy.Today, after a three-year period of strong private market distributions, the private capital overhang is the highest—and the fund-raising environment the easiest—since before the global financial crisis. Even in these conditions, investors continue to pursue private investments in pursuit of compelling returns. Given the aforementioned underperformance in the mid-2000s when co-investment activity was high, investors should be especially sensitive to procyclicality risk if pursuing co-investments in the current environment.
Conclusion
In addition to co-investing’s theoretical cost advantages and higher return potential, good empirical evidence supports the case that co-investments can offer outperformance. Investors need to be mindful of procyclicality and other risks specific to co-investments, but can increase their chances of success in any market environment by following a disciplined and systematic approach focused on goals, resources, processes, and implementation.
Cambridge Associates Benchmark Indexes
Cambridge Associates LLC derives its private investments benchmark from the financial information contained in its proprietary database of private equity and venture capital funds. The pooled returns are calculated on the aggregate of all cash flows and market values as reported to Cambridge Associates LLC by the funds’ general partners in their quarterly and annual audited financial reports. Net returns, as indicated on exhibits, are net of management fees, expenses, and performance fees that take the form of a carried interest.
Footnotes
- This analysis represents buyouts, the strategy in which co-investing is most common. Hard assets and secondary co-investments were not included, and venture co-investments are addressed separately.
- As we will show in Figure 6, comparing the gross results for the co-investment funds to the gross results of global buyout funds based on the initial year of investment in a company answers a different question about how co-investments on offer in a given year compared to investments that GPs made themselves in that year.
Andrea Auerbach - Andrea Auerbach is the Global Head of Private Investments and a Partner at Cambridge Associates.
About Cambridge Associates
Cambridge Associates is a global investment firm with 50+ years of institutional investing experience. The firm aims to help pension plans, endowments & foundations, healthcare systems, and private clients achieve their investment goals and maximize their impact on the world. Cambridge Associates delivers a range of services, including outsourced CIO, non-discretionary portfolio management, staff extension and alternative asset class mandates. Contact us today.