Hedge Fund-ing the Pension Deficit


Select hedge funds have provided attractive long-term returns with reduced equity beta and can be integral to pension investment strategies
- Continuously low interest rates have driven funded status lower for many defined benefit pensions over the past seven years, highlighting plan sponsors’ continued need to allocate funds to risk-controlled growth strategies that can help close the funding gap and pay for future accruals.
- Low beta hedge funds may help pensions generate excess returns with limited directional equity exposure, thereby diversifying the portfolio, improving risk-adjusted returns, and reducing potential funded status drawdowns.
- Including hedge funds in a holistic de-risking strategy is especially attractive in the current environment, as record low bond yields and overvalued equity markets present limited return opportunities and increased risk across traditional assets.
- Given the significant dispersion in hedge fund manager and strategy returns, effective manager selection and portfolio construction are critical.
As many defined benefit plan sponsors seek to overcome lingering funding deficits, a clear need exists for investments in the growth portfolio that can deliver excess returns without meaningfully increasing the plan’s risk profile. Low beta–high alpha hedge funds may help plan sponsors achieve this objective. With equity and bond valuations stretched, select hedge funds’ focus on alternative sources of return, including alpha, makes an allocation even more compelling today.
For a more comprehensive view of our holistic de-risking approach, please see David Druley et al., “Pension De-Risking in a Low-Rate Environment—A Better Solution,” Cambridge Associates Research Report, 2013.
This research note explores the role hedge funds can play in pension portfolios and why they may be additive—particularly in the current environment—to a holistic pension risk management strategy. We also discuss key areas for consideration as plan sponsors contemplate implementing a hedge fund allocation.
Funded Status Call-to-Action
Prior to the global financial crisis, plan sponsors had realized a hard fought, yet steady, improvement in funded status. After a rapid recovery in 2013, many plans then suffered a significant setback and once again face daunting deficits.
Figure 1 shows the estimated average funding level of plans sponsored by S&P 1500 companies. The funding level has fallen from 93% on November 30, 2013, to 79% as of March 31, 2016. Market volatility has played havoc with funded status since the global financial crisis, driving changes of as much as 23% in periods as short as 18 months. From a volatility perspective, funding levels had an annualized standard deviation of 12.5% from March 2009 through the end of 2015, 1 placing an added strain on financial statements and making the jobs of plan sponsors much more difficult.
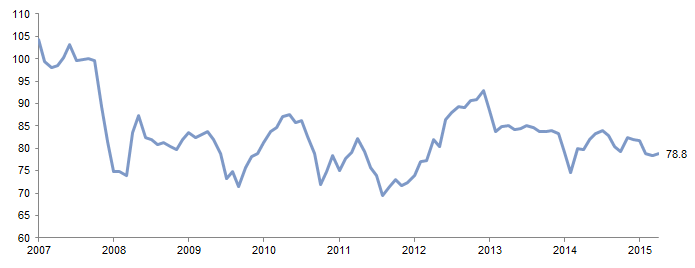
Figure 1. Historical Accounting PBO Funded Status of S&P 1500 Companies
December 31, 2007 – March 31, 2016 • Percent (%)
Sources: Mercer (US) Inc. and Standard & Poor’s. Mercer data provided “as is” without any express or implied warranties.
The recent funded status deterioration presents a challenge for plan sponsors. On one hand, generating growth in excess of the liability is now more important than ever to close the funding gap and pay for future benefit accruals. On the other hand, lower funding levels do not inherently increase a plan sponsor’s risk tolerance.
Clearly, moderating the extremes of pension funded status volatility and closing the gap would benefit both plan sponsors and beneficiaries. But how can plan sponsors do so while marrying their need for excess return with their limited risk tolerance?
Since discount rates are largely in the hands of the Federal Reserve and mortality tables in the hands of the IRS, plan sponsors should focus on those areas under their control. Three of these areas are asset allocation, portfolio construction, and manager selection, where a diversified implementation of low beta–high alpha hedge funds could play a compelling role.
Key Culprits in Recent Funding Declines
Declining interest rates have been the primary culprit in recent funded status deterioration, as lower discount rates have caused liabilities to grow faster than assets. As the figure below shows, the recent drop in discount rates was driven by plunging US Treasury yields. As of December 31, 2015, yields for both ten- and 30-year bonds stood near all-time lows. The credit-spread component of US pension discount rates has had only a modest impact recently. Long-duration credit spreads widened from 158 bps at the end of 2013 to 225 bps as of December 31, 2015, which was not sufficient to offset the more dramatic Treasury yield declines. An additional headwind was the recent change to the standard mortality tables, which increased life expectancy assumptions and therefore increased pension liabilities.
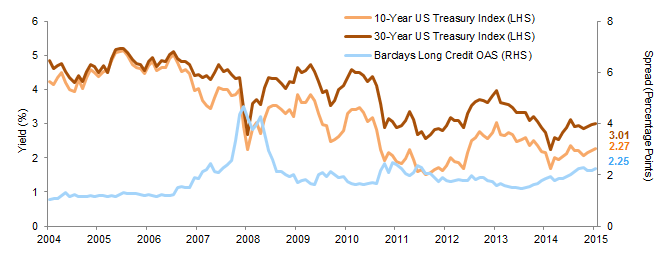
US Treasury Yields and Long-Duration Credit Spreads
December 31, 2004 – December 31, 2015
Sources: Barclays, Bloomberg L.P., Federal Reserve, and Thomson Reuters Datastream.
Note: Spread reflects the option-adjusted spread over Treasuries for the Barclays Long Credit Index.
Hedge Funds Have Reduced Risk
A select group of low beta–high alpha hedge funds could help plans generate excess returns while significantly reducing volatility relative to traditional assets such as long-only equities, which often dominate pension growth portfolios.
Controlling equity market exposure is especially important for pension plans because stock market drawdowns often coincide with periods of sharply declining interest rates. This dynamic can create “perfect storms” for plan sponsors, with plan assets falling while liabilities rise. Figure 2 presents a funded status stress test based on two well-known perfect storms: the 2000–03 tech bust and the 2007–09 financial crisis. Assuming an initial funded status of 80%, which is reflective of many plans today, similar crises would be devastating for a traditional portfolio of 60% global equities and 40% long-duration bonds. Diversifying one-third of the equity allocation into high-conviction hedge funds would have reduced the plan’s funded status drawdown by approximately 7 percentage points relative to the traditional portfolio. For a $1 billion plan, this represents a reduced drawdown of $126 million during the tech bust and $80 million during the financial crisis, 2 thereby significantly decreasing the size of required shortfall contributions from the sponsor.
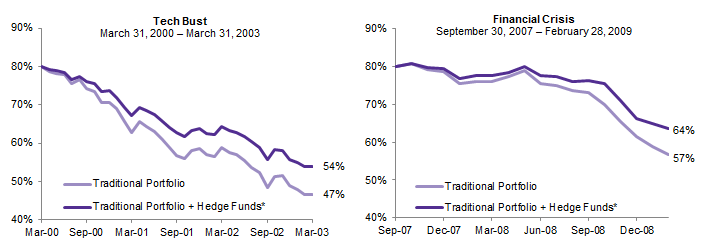
Figure 2. Funded Status Preservation—Benefits of Adding Hedge Funds to a Traditional Portfolio
Assumed Initial Funded Status of 80%
Sources: Barclays, Cambridge Associates LLC, MSCI Inc., and Thomson Reuters Datastream. MSCI data provided “as is” without any express or implied warranties.
Notes: The Traditional Portfolio is made up of 60% MSCI All Country World Index (Net) and 40% Barclays Long-Term Government/Credit Index. The Traditional + HF Portfolio is made up of 40% MSCI All Country World Index (Net), 20% CA Hedge Fund Advisory Composite, and 40% Barclays Long-Term Government/Credit Index. All portfolios are rebalanced monthly and do not include any contributions or benefit payments. The Barclays US Long Credit Index return is used as a proxy for the change in liability. MSCI ACWI returns use returns gross of dividend taxes prior to February 28, 2001, and returns net of dividend taxes thereafter.
* Please see the Performance Disclosure at the end of the publication for information about the composite.
Taking another perspective, in Figure 3 we present a hypothetical 10% equity market correction based on December 31, 2015, market values. Under this scenario the traditional portfolio falls by 5.9%, while the traditional portfolio with a 20% hedge fund allocation falls by 4.4%. The smaller loss in the portfolio with the hedge funds improves the plan’s funded status relative to the traditional portfolio option at a time when the sponsor is unlikely to want to contribute additional funds, which it needs for its business operations, to the plan.
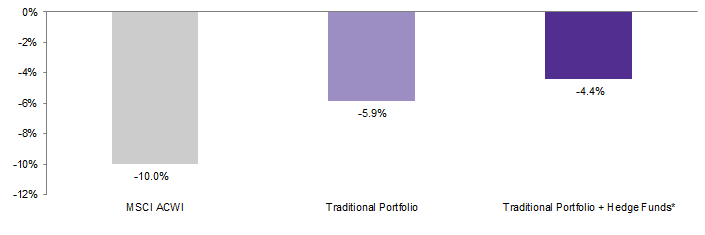
Figure 3. Impact of Hedge Fund Allocation During a Hypothetical 10% Market Correction
Based on December 31, 2015, Market Values
Sources: Barclays, Cambridge Associates LLC, MSCI Inc., and Thomson Reuters Datastream. MSCI data provided “as is” without any express or implied warranties.
Notes: The Traditional Portfolio is made up of 60% MSCI All Country World Index (Net) and 40% Barclays Long-Term Government/Credit Index. The Traditional + Hedge Fund Portfolio is made up of 40% MSCI All Country World Index (Net), 20% CA Hedge Fund Advisory Composite, and 40% Barclays Long-Term Government/Credit Index. All portfolios are rebalanced monthly and do not include any contributions or benefit payments. The Barclays US Long Credit Index return is used as a proxy for the change in liability. MSCI ACWI returns use returns gross of dividend taxes prior to February 28, 2001, and returns net of dividend taxes thereafter. Returns are in US$ terms.
* Please see the Performance Disclosure at the end of the publication for information about the composite.
In Figure 4, we show the 12 market corrections of at least -8% from January 2001 through December 2015. In each of these corrections, a portfolio with a 20% allocation to hedge funds would have reduced the drawdown meaningfully relative to a traditional 60/40 portfolio.
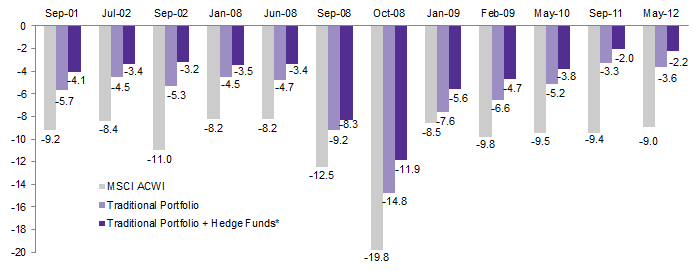
Figure 4. One-Month MSCI ACWI Corrections of at Least -8% in the Past 15 Years
As of December 31, 2015 • Percent (%)
Sources: Barclays, Cambridge Associates LLC, MSCI Inc., and Thomson Reuters Datastream. MSCI data provided “as is” without any express or implied warranties.
Notes: The Traditional Portfolio is made up of 60% MSCI All Country World Index (Net) and 40% Barclays Long-Term Government/Credit Index. The Traditional + Hedge Fund Portfolio is made up of 40% MSCI All Country World Index (Net), 20% CA Hedge Fund Advisory Composite, and 40% Barclays Long-Term Government/Credit Index. All portfolios are rebalanced monthly and do not include any contributions or benefit payments. The Barclays US Long Credit Index return is used as a proxy for the change in liability. MSCI ACWI returns use returns gross of dividend taxes prior to February 28, 2001, and returns net of dividend taxes thereafter. Returns are in US$ terms.
* Please see the Performance Disclosure at the end of the publication for information about the composite.
The ability of a portfolio with hedge funds to reduce downside in market corrections is compelling based on the experience of investors during the recent global financial crisis. In the period since this crisis, a traditional 60/40 portfolio would still have generated less cumulative wealth, and recovered to its September 2007 value more slowly, than a portfolio with hedge funds, in spite of the second longest equity bull market in history, as shown in Figure 5.
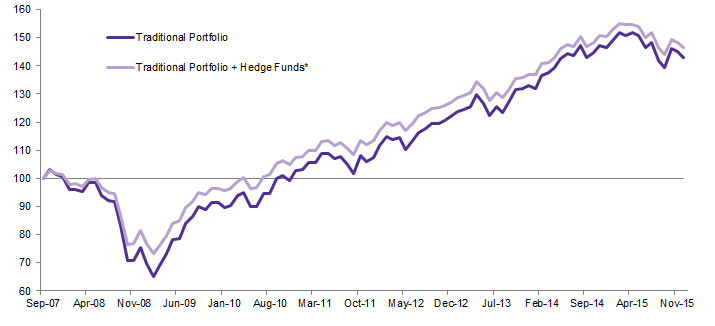
Figure 5. Recovery From the Global Financial Crisis
September 30, 2007 – December 31, 2015 • Cumulative Wealth Rebased to $100 on September 30, 2007
Sources: Barclays, Cambridge Associates LLC, MSCI Inc., and Thomson Reuters Datastream. MSCI data provided “as is” without any express or implied warranties.
Notes: The Traditional Portfolio is made up of 60% MSCI All Country World Index (Net) and 40% Barclays Long-Term Government/Credit Index. The Traditional + Hedge Fund Portfolio is made up of 40% MSCI All Country World Index (Net), 20% CA Hedge Fund Advisory Composite, and 40% Barclays Long-Term Government/Credit Index. All portfolios are rebalanced monthly and do not include any contributions or benefit payments. The Barclays US Long Credit Index return is used as a proxy for the change in liability. MSCI ACWI returns use returns gross of dividend taxes prior to February 28, 2001, and returns net of dividend taxes thereafter.
* Please see the Performance Disclosure at the end of the publication for more information about the composite.
“PotÄto PotÂto”—Hedge Funds Are Difficult to Define
The term “hedge fund” encompasses numerous strategies that may offer diversification benefits to pension portfolios. In diversifying a plan’s hedge fund allocation across different opportunities, plan sponsors should benefit from smoother returns over time. Strategies that may appear volatile in isolation, such as managed futures and global macro, can be strong diversifiers in the context of a traditional plan portfolio due to their zero-to-low correlation with traditional asset classes.
The fluid nature of certain hedge fund strategies and their ability to actively manage exposures across instruments and opportunistically shift positioning toward less exploited areas can also help protect portfolios. Global macro, quantitative, multi-strategy, open mandate, and event-driven arbitrage funds all are examples of strategies with mandates flexible enough to rotate to areas with the most attractive risk-reward characteristics.
Additionally, high conviction, low beta long/short equity strategies can generate significant alpha and play an important role in risk reduction and return enhancement. Certain strategies and managers can generate meaningful improvements in portfolio efficiency through careful selection when considered in the broader portfolio context.
Long-Term Hedge Fund Returns Are Compelling
Capital preservation during bear markets enables low beta–high alpha hedge funds to capture the long-term benefits of compounding returns. Historically, we have seen talented hedge funds produce much smaller drawdowns than long-only equities and recover more rapidly from any losses, in part due to two reasons. First, because they lost less, they need to recover less. Second, they have greater flexibility to increase exposure when valuations are cheaper.
As Figure 6 shows, superior downside protection has helped Cambridge Associates (CA)advisory clients’ hedge fund programs outpace global equity markets by 48 ppts cumulatively over the last 15 years, with one-third the beta of public markets. The higher return and lower volatility of CA advisory clients’ hedge fund programs results in superior risk-adjusted returns as measured by a Sharpe ratio of 0.63, compared to the MSCI ACWI’s Sharpe ratio of 0.23, an improvement of 174%. 3
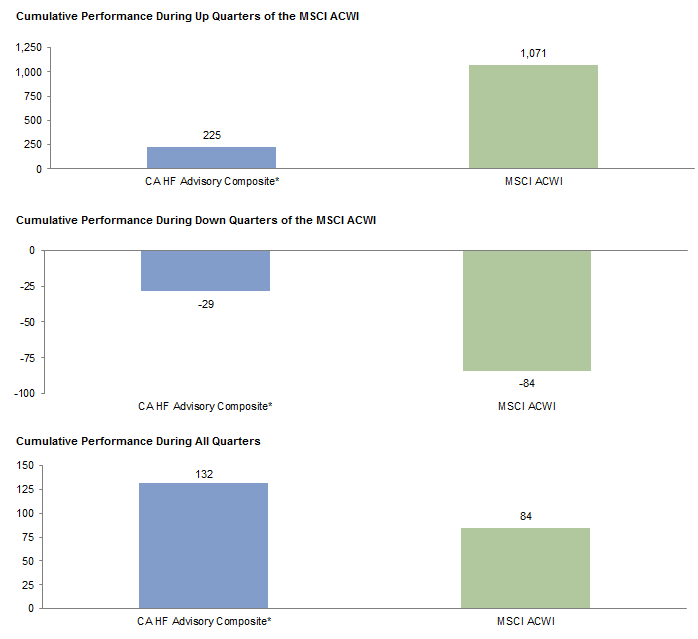
Figure 6. Hedge Fund Performance in Up and Down Equity Markets
Fourth Quarter 2000 – Fourth Quarter 2015 • Basis Points
Sources: Cambridge Associates LLC and MSCI Inc. MSCI data provided “as is” without any express or implied warranties.
Notes: Calculations are based on quarterly data, net of fees. MSCI ACWI returns use returns gross of dividend taxes prior to March 31, 2001, and returns net of dividend taxes thereafter.
* Please see the Performance Disclosure at the end of the publication for a description of the composite.
Hedge funds generate returns through a variety of strategies that often perform well at different times. Plan sponsors should consider the role (e.g., growth driver or portfolio diversifier) that each strategy and manager serves in the context of the plan’s total portfolio to create a hedge fund allocation tailored to their goals.
Figure 7 shows the range of correlations among hedge fund strategies based on funds in the CA investment manager database, and highlights the importance of diversification and thoughtful portfolio construction. Certain global macro and quantitative strategies, for example, present opportunities to generate uncorrelated returns, regardless of market direction—and decrease portfolio volatility as well.
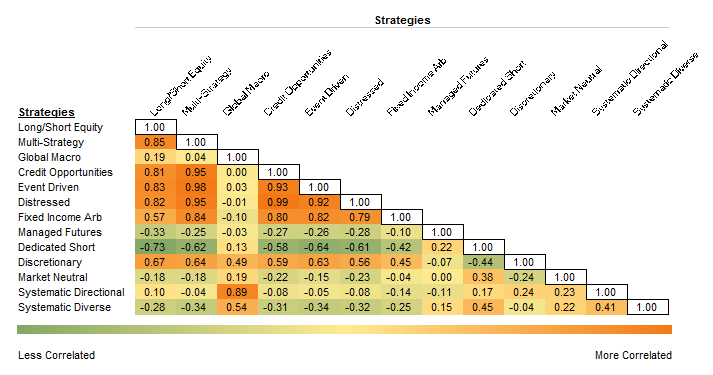
Figure 7. Hedge Fund Strategy Correlation Matrix
Fourth Quarter 2000 – Fourth Quarter 2015
Source: Cambridge Associates LLC.
Notes: Calculations are based on quarterly data from Cambridge Associates LLC’s proprietary Investment Manager Database. Performance results are generally reported net of investment management fees and performance fees. Performance results do not include returns for managers that exclude reserves (cash) from reported total return. Returns for inactive (discontinued) managers are included if performance is available for the entire period measured.
In addition to the variability in hedge fund strategy returns, manager performance dispersion is significant. Performance dispersion is notably larger among hedge funds than among long-only equity or bond managers (Figure 8). This level of dispersion indicates that most hedge funds are not compelling value propositions. However, Figure 8 also demonstrates that there may be an opportunity to add significant value through effective manager selection.
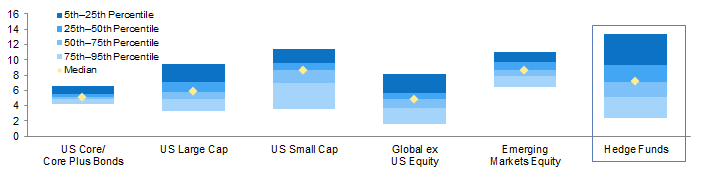
Figure 8. Manager Return Dispersion
Fourth Quarter 2000 – Fourth Quarter 2015 • AACR (%)
Source: Cambridge Associates LLC.
Notes: Calculations are based on quarterly data from Cambridge Associates LLC’s proprietary Investment Manager Database. Percentile rankings are based on a scale of 0–100, where 0 represents the highest value and 100 the lowest. Data are based on managers with a minimum of $50 million in assets. Performance results do not include returns for managers that exclude reserves (cash) from reported total return. Returns for inactive (discontinued) managers are included if performance is available for the entire period measured. For hedge funds, returns are reported net of fees. For other strategies, we have subtracted a fee proxy from returns reported gross of fees as follows: US core/core plus bonds, 33 bps; US large cap, 69 bps; US small cap, 93 bps; global ex US equity, 80 bps; and emerging markets equity, 98 bps. Managers for which product asset data were unavailable were excluded. All of the manager universes have survivorship bias, so while the distribution may include better performance, the comparison across strategies is valid. Past performance is not necessarily a guide to future performance.
While investors naturally gravitate toward equities during bull markets such as the one that began after the global financial crisis, the need to generate risk-controlled returns across full market cycles requires plan sponsors to keep a longer-term perspective in mind. This perspective is particularly important when equity valuations are stretched, because valuations underpin long-term expected returns. We believe that US equities in particular are overvalued, and that plan sponsors thus may benefit by focusing on alternative and differentiated sources of return while managing downside risk. With rising dispersion within equity markets and prospects for increased market volatility due to diverging global growth prospects and interest rates, the environment is well suited for talented hedge fund managers to add value on both their long and short positions in the case of long/short funds and to take advantage of pricing discontinuities in the case of multi-strategy and event-driven funds.
Plan sponsors’ ability to extract maximum value from hedge funds depends on one of two paths. They can either hire experienced staff, or partner with an experienced, well-resourced hedge fund advisor with a history of identifying and accessing best-in-class managers and of building portfolios that complement the rest of the client’s portfolio. By emphasizing rigorous manager selection and diversified portfolio construction, CA clients’ hedge fund programs realized a total cumulative return on a $100 investment of 141% over a period of 15 years (Figure 9). 4
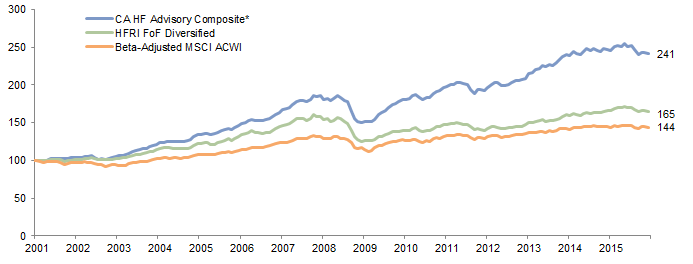
Figure 9. CA Hedge Fund Advisory Composite Cumulative Performance
December 31, 2000 – December 31, 2015 • Cumulative Wealth Rebased to $100 on December 31, 2000
Sources: Cambridge Associates LLC, Hedge Fund Research, Inc., and MSCI Inc. MSCI data provided “as is” without any express or implied warranties.
Notes: Beta-adjusted MSCI ACWI is based on 0.25 global equity beta realized by the CA HF Advisory Composite over the period. The beta-adjusted MSCI ACWI return is calculated on a monthly basis as (MSCI ACWI * 0.25) + (T-Bills * 0.75). MSCI ACWI returns use returns gross of dividend taxes prior to February 28, 2001, and returns net of dividend taxes thereafter.
* Please see the Performance Disclosure at the end of the publication for more information about the composite.
This amounts to an excess annual return over the HFRI Fund-of-Funds Diversified Index of 222 bps per annum over the last 15 years with similar volatility and equity beta. Moreover, when compared with a risk-equivalent, beta-adjusted equity index, the CA client hedge fund composite has outperformed by 324 bps per annum (Figure 10). 5
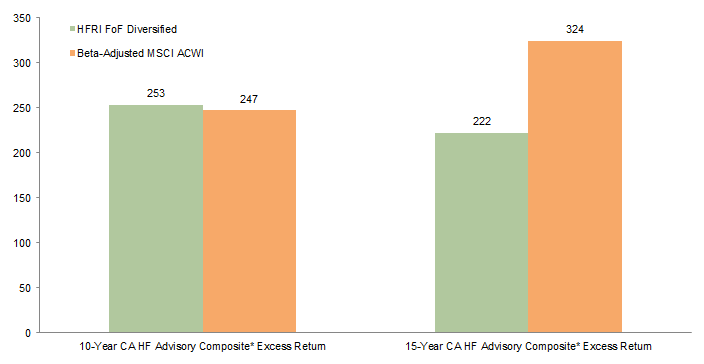
Figure 10. CA Hedge Fund Advisory Composite Outperformance Against Benchmarks
As of December 31, 2015 • Average Annual Excess Return (bps)
Sources: Cambridge Associates LLC, Hedge Fund Research, Inc., and MSCI Inc. MSCI data provided “as is” without any express or implied warranties.
Notes: Beta-adjusted MSCI ACWI is based on 0.25 global equity beta realized by the CA HF Advisory Composite over the period. The beta-adjusted MSCI ACWI return is calculated on a monthly basis as (MSCI ACWI * 0.25) + (T-Bills * 0.75). MSCI ACWI returns use returns gross of dividend taxes prior to February 28, 2001, and returns net of dividend taxes thereafter.
* Please see the Performance Disclosure at the end of the publication for more information about the composite.
Addressing Concerns
While low beta–high alpha hedge funds may be attractive from a risk/return perspective, investors often raise concerns about issues such as fees, liquidity, transparency, and leverage.
Fees. Investors are right to be concerned about fees, as the hedge fund universe in aggregate charges high fees and generates very little value add. This is why we constantly remind pension sponsors that if they are only going to receive the returns of the universe at large (or the average hedge fund return), they should not make the investment in the first place. However, if an institution can retain the resources or staff that allow it to identify and invest in the select group of managers that generate significant net-of-fee alpha with low market exposure, then paying the higher fees is merited.
Liquidity. Plan sponsors rightfully want to ensure that any illiquidity assumed in hedge fund investments is required to execute the strategy and is adequately compensated with excess returns. Avoiding mismatches between a fund’s liquidity terms and the liquidity of the strategy and its underlying holdings is paramount.
That said, longer lock-ups may be warranted to access certain alpha-generative strategies that take longer to play out, such as distressed, credit, or short-biased or activist investments. These strategies require patience and can be undermined if significant capital is redeemed at the wrong time; hence, more illiquid terms are justified and serve to protect the interests of long-term investors. Plan sponsors should question funds that offer limited liquidity when the underlying assets are liquid.
As with fees, hedge funds’ liquidity terms have come under scrutiny and evolved over time. After the 2008 global financial crisis, many hedge funds stopped investing in private companies entirely. Funds that still invest in illiquid securities often pursue private investments in separate lock-up vehicles. Most hedge funds now allow investors to opt out of illiquid side pockets as well.
From a portfolio construction perspective, a diversified portfolio of hedge funds with sufficient scale should provide plan sponsors with staggered liquidity points to facilitate rebalancing, especially after a market sell-off that creates compelling valuations in long-only equities. A well-constructed hedge fund portfolio containing a select group of high conviction managers should enable plan sponsors to enjoy the risk/return benefits that hedge funds offer without significantly compromising overall portfolio liquidity.
Transparency and Other Considerations. Investors also raise questions about hedge fund transparency and leverage. Transparency is important, and the less transparent approach adopted by some hedge funds can be a source of frustration. Adequate disclosure is necessary to evaluate whether a manager is truly skilled and what risks the fund is taking. Fortunately for investors, transparency has improved over the past decade as a result of regulation and increasing investor demands. Developing strong long-term manager relationships, particularly through face-to-face meetings, can also help experienced investors and advisors fill any information gaps.
Leverage. Leverage is inherent in many hedge fund strategies and can influence risk and returns. As part of a due diligence process, the impact of leverage on each manager’s returns alongside other return drivers such as market beta and alpha should be considered. Returns driven by leverage should not warrant the same fees and illiquidity as returns sourced from alpha-generative security selection. With continually increasing transparency, investors and advisors have ample opportunity to assess hedge funds’ leverage and identify managers that demonstrate repeatable skill and do not rely on borrowed capital to deliver returns.
Conclusion
Growth assets that can deliver attractive long-term returns with beneficial effects on total portfolio risk have clear value to plan sponsors, particularly as plans seek to recoup recent funding losses without increasing the portfolio’s risk level. Low beta–high alpha hedge funds may fulfill this role and contribute meaningful diversification to equity-biased growth portfolios, which is especially important in today’s markets where many traditional assets are overvalued. High conviction hedge funds that generate returns from less directional strategies than long-only equities or face less interest rate risk than traditional bonds are particularly attractive.
Successfully implementing a hedge fund allocation is challenging. Significant performance dispersion among managers in the same strategies, and dispersion across strategies based on ever-changing market opportunities, make manager selection and customized portfolio construction essential. Of the approximately 11,000 hedge funds worldwide, we believe 5% at most merit institutional capital. Additionally, plan sponsors must consider important issues such as fees, liquidity, transparency, and leverage when selecting individual managers. Building a diversified and differentiated portfolio of strategies and managers that complement the rest of a plan’s portfolio represents a significant hurdle. These challenges notwithstanding, an allocation to low beta–high alpha hedge funds can play a powerful role in enhancing a plan’s risk-adjusted returns, and should be emphasized in the context of holistic pension risk management strategies.
Performance Disclosure
The CA Hedge Fund Advisory Composite includes 347 full advisory hedge fund program returns for Cambridge Associates’ clients who received hedge fund performance reports as of December 31, 2015. Clients are added to the sample over time based on their advisory contract start date and are included for those periods during which they are advisory clients. “Cambridge Associates” comprises five investment consulting affiliates established for the purposes of providing investment management, advisory, and related services around the globe. Annualized mean returns are calculated based on a monthly equal-weighted client composite return. Returns shown are net of manager and CA fees. In some instances, CA fees are estimated based on a model fee calculation using the highest CA fee schedule appropriate for the client type and service provided. In these cases, the model fee deducted was equal to or greater than actual fees paid by that client to CA. Past performance does not guarantee future returns. Returns may include investments made prior to becoming clients of CA, and performance may be attributable to factors other than CA’s advice because of the non-discretionary nature of advisory consulting. Returns are in US$ terms.
Hypothetical Performance Disclosure
This research note contains hypothetical performance. Hypothetical performance results have many inherent limitations, some of which are described below. There are frequently sharp differences between hypothetical performance results and the actual results subsequently achieved by any particular investment program. Hypothetical results do not involve financial risk, and no hypothetical record can completely account for the impact of financial risk in actual investing. For example, the ability to withstand losses or to adhere to a particular investment program in spite of losses are material points, which can also adversely affect actual performance results. There are numerous other factors related to the markets in general or to the implementation of any specific investment program, which cannot be fully accounted for and all of which can adversely affect actual results.
Index Disclosures
Broad-based securities indexes are unmanaged and are not subject to fees and expenses typically associated with managed accounts or investment funds. Investments cannot be made directly in an index. Past performance is no guarantee of future results.
Barclays US Long Credit Index
Long-term corporate bonds are represented by the Barclays US Long Credit Index, which measures the performance of the long-term sector of the United States investment bond market, which as defined by the Long Credit Index includes investment-grade corporate debt and sovereign, supranational, local authority and non-US agency bonds that are dollar denominated and have a remaining maturity of greater than or equal to ten years.
Barclays Long-Term Government/Credit Index
The Barclays Long-Term Government/Credit Index is an unmanaged index of US government or investment-grade credit securities having a maturity of ten years or more.
HFRI Fund-of-Fund Diversified Index
The HFRI Fund-of-Funds Diversified Index is a non-investable product of diversified fund of funds. The Index is equal weighted (fund weighted) with an inception of January 1990.
MSCI All Country World Index
MSCI ACWI captures large- and mid-cap representation across 23 developed markets and 23 emerging markets countries. With 2,464 constituents, the index covers approximately 85% of the global investable equity opportunity set.
S&P 1500 Index
The S&P Composite 1500 combines three leading indexes, the S&P 500, the S&P MidCap 400, and the S&P SmallCap 600 to cover approximately 90% of the US market capitalization. It is designed for investors seeking to replicate the performance of the US equity market or benchmark against a representative universe of tradable stocks.
US Treasury Index
Yields on Treasury nominal securities at “constant maturity” are interpolated by the US Treasury from the daily yield curve for non-inflation-indexed Treasury securities. This curve, which relates the yield on a security to its time to maturity, is based on the closing market bid yields on actively traded Treasury securities in the over-the-counter market. These market yields are calculated from composites of quotations obtained by the Federal Reserve Bank of New York. The constant maturity yield values are read from the yield curve at fixed maturities, currently 1, 3, and 6 months and 1, 2, 3, 5, 7, 10, 20, and 30 years.
Footnotes
- Annualized standard deviation of the monthly differences in funded status of S&P 1500 companies from March 1, 2009, through December 31, 2015.
- Assumes the plan entered each period with $1 billion in assets and $1.25 billion in liabilities, implying an 80% funded status.
- Please see the Performance Disclosure at the end of this publication for information about the clients included in the composite.
- Please see the Performance Disclosure at the end of this publication for information about the clients included in the composite.
- The excess annual returns over the HFRI FoF Diversified Index and beta-sdjusted MSCI ACWI Index are calculated by taking the average annual compound return (AACR) of the CA HF Advisory Composite minus the AACR of the HFRI FoF Diversified Index and the beta-adjusted index. Information for both the ten- and 15-year periods is captured in Figure 10.
Joseph Marenda - Joe Marenda is the Head of Hedge Fund Research, Head of Digital Assets Investing, and a Partner at Cambridge Associates.
About Cambridge Associates
Cambridge Associates is a global investment firm with 50+ years of institutional investing experience. The firm aims to help pension plans, endowments & foundations, healthcare systems, and private clients achieve their investment goals and maximize their impact on the world. Cambridge Associates delivers a range of services, including outsourced CIO, non-discretionary portfolio management, staff extension and alternative asset class mandates. Contact us today.