Digging In: Assessing the Private Infrastructure Opportunity Today

New private infrastructure fund investors can find value in carefully evaluated managers and strategies, but they should ratchet down return expectations relative to years past
- With a small pool of viable opportunities and investors hungry for yield, transaction prices have steadily increased since the global financial crisis.
- For the one-year period ended September 30, 2016, the Cambridge Associates LLC Infrastructure Index returned 12.5%, as measured on a pooled horizon net internal rate of return (IRR) basis, outpacing both our private natural resources and real estate benchmarks.
- Value-add managers, particularly those focused on middle-market opportunities in developed countries, appear best positioned to generate infrastructure’s classic characteristic—stable, high-income returns—with some upside in the years ahead.
Infrastructure has grabbed many investors’ attention, thanks to the essential nature of its services, its potential for inflation-linked returns, and US President Donald Trump’s promises to encourage $1 trillion in investment. With governments recognizing the crucial role the private sector can play in helping to bridge the large spending gap and investors desperate for yield, private funds focused on infrastructure have seen large inflows in recent years, with the global amount of capital raised last year the largest on record.
But, prudent investors looking to allocate to the asset class should ratchet down return expectations relative to the solid performance of years past, as the large inflows that have accompanied the search for yield have, in general, raised aggregate price levels. Still, each infrastructure investment is different from the next, with a broad range of risk/return profiles across sectors and regions, meaning investors can find value in carefully evaluated managers and strategies. In this research note, we consider the shortfall in infrastructure spending, review the opportunity set, discuss performance trends, and highlight a few considerations for investors evaluating the opportunity.
Infrastructure Gap
A truly massive funding gap resides at the center of most infrastructure discussions. According to a frequently cited study by McKinsey & Company, the world needs to invest $49 trillion in building and maintaining core infrastructure—transportation, power, water, and telecommunications—worldwide through 2030, which represents a significant sum relative to the present value of today’s infrastructure assets. 1 Studies by the American Society of Civil Engineers and the World Economic Forum present similarly staggering numbers on the money needed to plug the infrastructure gap. 2
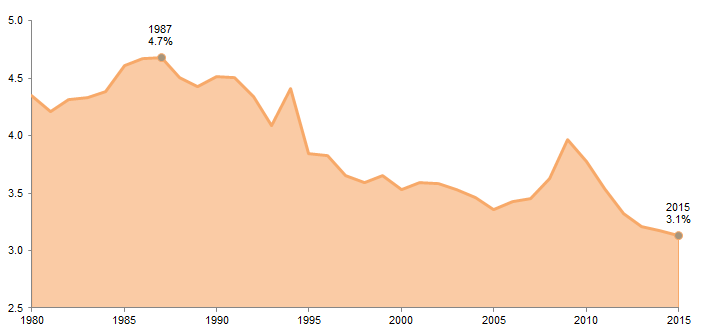
The large deficit is the result of decades of insufficient spending. Governments, which are the primary and often only source of funds, have not invested to meet the needs of growing and increasingly urbanized populations. According to Organisation for Economic Co-operation and Development (OECD) data, the aggregate amount invested in infrastructure has fallen among reporting member countries from averaging just under 4.5% of GDP throughout the 1980s to just 3.1% in 2015, the lowest level on record (Figure 1). That percentage drop represents close to three-quarters of a trillion dollars in 2015 alone.
Figure 1. Aggregate OECD Government Fixed Asset Investment
1980–2015 • Percent (%) of GDP
Source: OECD.
Notes: Data represent the annual aggregate amount of gross fixed capital formation divided by the annual aggregate GDP of OECD countries reporting that year. The number of countries represented in the data changes over time, beginning with Australia, France, South Korea, Norway, and the United States and expanding to include 35 OECD countries.
With high public debt levels and little appetite to raise taxes in many countries, the private sector is poised to play a larger role in helping to bridge the infrastructure gap, even if this role continues to be small relative to public sector efforts. The private sector has already experienced rapid growth—in a little over ten years, infrastructure funds went from raising just a few billion dollars across a small number of funds to over $45 billion across almost 30 funds (Figure 2). Further, a recent survey suggests institutional investors are looking to increase allocations this year. 3
Figure 2. Growth in Unlisted Infrastructure Funds
2004–16 • Annual Totals
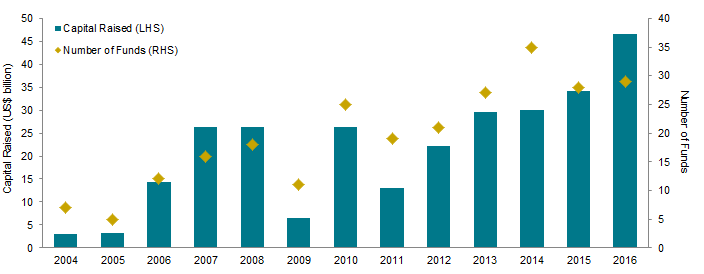
Source: InfraDeals.
Despite enterprising funds in Australia, Canada, and elsewhere, the vast majority of the multi-trillion dollar opportunity set is not open to private capital. Many of these assets, as public goods, do not offer appropriate cash flows. In fact, one of the current common complaints across the industry is not the difficulty in reviewing all the available opportunities, but rather, the limited number of opportunities to review. With much of the infrastructure money raised in recent years not yet called and with rising interest from direct investors such as sovereign wealth funds and pension funds (not to mention public infrastructure companies), private fund investors will face competition in the marketplace for assets.
Opportunity Set
Infrastructure has received increased attention in the last year, with Trump’s repeated promises to unlock $1 trillion in investment over the next ten years. While the opportunity set for private institutional investors appears to be decently sized—according to the information company InfraDeals, the total volume of brownfield, greenfield, and refinancing deals globally reached close to 1,500 in 2016, representing a total deal value near $400 billion 4 —the opportunity set many institutional investors target is considerably smaller.
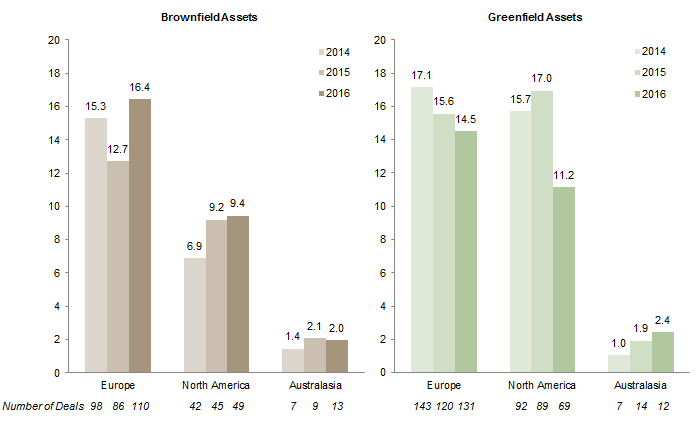
Deal activity has been primarily centered on developed markets, with Europe leading North America slightly in attracting capital in recent years. Merger & acquisition activity in brownfield assets in developed markets—where core and, to a lesser extent, value-add strategies operate—remains concentrated in a small number of large deals. In North America last year, just 18 brownfield deals reached financial close with at least a $500 million transaction size, accounting for over 70% of total deal value in that region. The number of brownfield (and greenfield) projects depends, in part, on local government’s support for privatization, and that support, particularly in the United States, can be weak.
Many private infrastructure funds look at the middle market for opportunities, and in the last few years, this market in aggregate hasn’t grown to match the increase in interest across the various investors (Figure 3). Among this deal size group, brownfield and greenfield investments were even more focused on Europe relative to North America and Australasia. The transportation and power sectors received large investments, but renewables attracted the most capital across these markets last year. Onshore wind and solar photovoltaic assets, in particular, accounted for 21% and 16% of overall brownfield and greenfield investment deal values, respectively.
Figure 3. Middle-Market Infrastructure Deal Value
2014–16 • US Dollar (billions)
Source: InfraDeals.
Notes: Deal value includes infrastructure deals that reached financial close with a transaction value ranging from $25 million to $500 million.
While President Trump’s infrastructure position, the possibility of a post-“Brexit” fiscal stimulus in the United Kingdom, and the global infrastructure gap discussed earlier suggest the level of investment may increase in the years ahead, infrastructure projects take considerable time to develop, even after they’ve been identified and funded. Even if Trump and his Republican congressional colleagues do rely in part on the public-private partnership (PPP) model—which leverages the resources of both the public and private sectors while sharing the risks—to spur investment, a flood of new investment opportunities in the next few years appears unlikely.
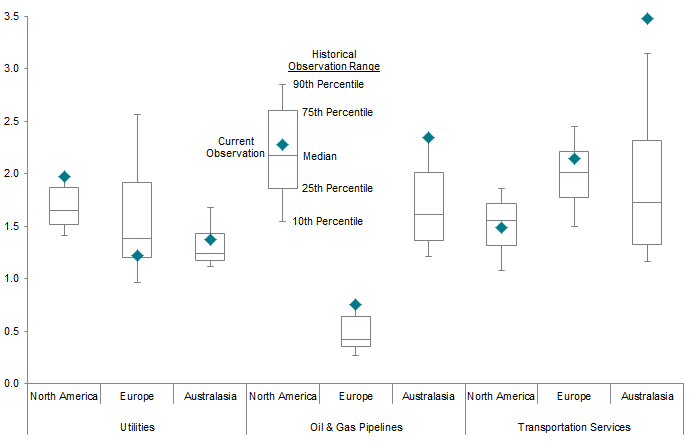
With a small pool of viable opportunities and investors hungry for yield, transaction prices have steadily increased since the global financial crisis. According to J.P. Morgan estimates, the average yield for core infrastructure investments—the strategy that received the bulk of fund flows—declined by approximately 300 to 350 basis points (bps) from 2010 to 2015, raising prices by an estimated 30% to 40%, assuming steady cash flows and leverage. Still, while price levels have increased this cycle, valuations aren’t uniformly expensive. Public sector proxies show a wide range of valuations across assets and locations (Figure 4). Moreover, private infrastructure markets are relatively inefficient, particularly in non-core middle-market assets, which tend to face less competition from direct investors and public infrastructure companies, meaning capable managers may be able to find relative value.
Figure 4. Listed Infrastructure Valuations
March 31, 2002 – March 31, 2017 • Price-to-Book Ratio
Source: Thomson Reuters Datastream.
Note: The chart details the range of month-end observations of the last 15-year period according to representative Datastream US Dollar sector indexes.
While we think investors should ratchet down return expectations relative to years past, given the lower starting yields, a few tailwinds are likely to limit how far future returns moderate. First, many institutional investors have small allocations to infrastructure or none at all, and several of these investors are currently considering if that remains appropriate. Second, there is an increased recognition that long-life infrastructure assets, many of which are regulated, may help mitigate downside risk in portfolios, even if they add duration risk. Third, and finally, while global political risks abound—including the possibility of an increase in protectionist policies—global growth expectations have picked up, a positive sign for GDP-sensitive assets (Figure 5).
Figure 5. Global Economic Indicators
As of February 28, 2017
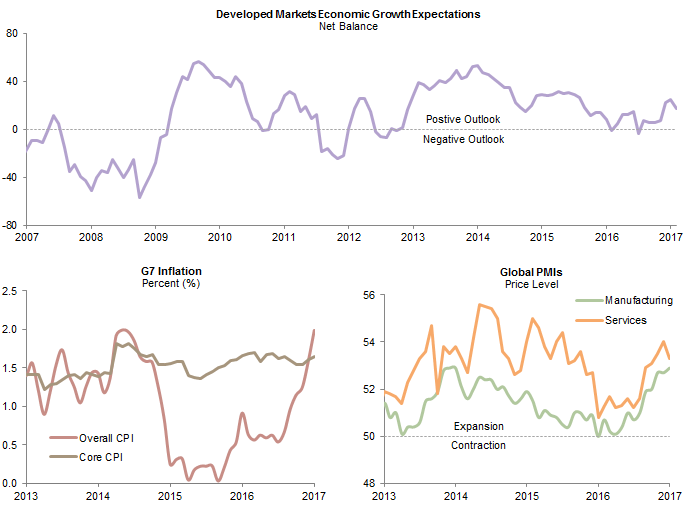
Sources: European Economic Research (ZEW), J.P. Morgan, Markit, OECD, and Thomson Reuters Datastream.
Notes: Developed markets economic growth expectations represent a GDP-weighted average of US, Japan, Germany, France, Italy, and UK economic sentiments from European Economic Research. Post-2015 economic expectations data are calculated using 2015 GDP data. Inflation and PMI data are through January 31, 2017.
Performance Review
The large capital flows into the asset class have contributed to private infrastructure’s solid returns in recent years, returns that will be difficult to replicate going forward. For the one-year period ended September 30, 2016, the Cambridge Associates LLC Infrastructure Index returned 12.5%, as measured on a pooled horizon net IRR basis, outpacing our private natural resources, real estate, and private equity benchmarks. Over longer periods of time, our infrastructure benchmark, which compiles data from 93 private funds across the risk spectrum, has also shined, trailing just our private equity index in the most recent ten-year period (Figure 6).
Figure 6. Private Investments Performance
Periods Ended September 30, 2016 • Annualized Percent (%)
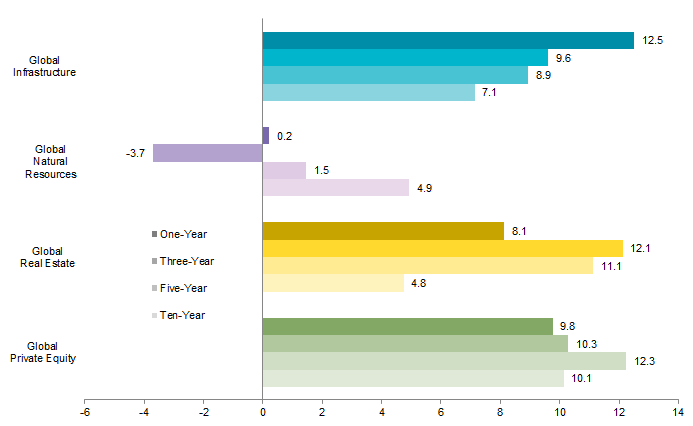
Source: Cambridge Associates LLC.
Notes: Data are pooled horizon internal rate of return calculations, net of fees, expenses, and carried interest. The indexes used are the Cambridge Associates LLC Infrastructure Index, the Cambridge Associates LLC Natural Resources Index, the Cambridge Associates LLC Real Estate Index, and the Cambridge Associates LLC Private Equity Index.
Of these four private benchmarks, infrastructure had the lowest volatility of rolling annual returns over the last ten-year period, making its risk-adjusted returns more compelling than natural resources and real estate and comparable, though slightly less than, private equity. This seems appropriate given infrastructure’s defensive nature—while its various assets have varying degrees of sensitivity to global growth, many are regulated and monopolistic in nature, such as utilities or mature toll roads, which provide essential services for everyday life.
Compared to public infrastructure equities, private infrastructure funds have also done well. Using the Cambridge Associates modified public market equivalent (mPME) methodology, which assumes the shares of a chosen public index are bought and sold according to the private index’s cash flow schedule, our infrastructure benchmark outperformed a public market infrastructure benchmark by 67 bps on an annualized basis over the last ten years. 5 Over the same time period, infrastructure added more value than natural resources and real estate, when comparing each to the MSCI World Index in an mPME analysis.
Among private infrastructure funds, a few performance trends have emerged. Since our benchmark’s inception, infrastructure funds focused on developed markets have outperformed those focused on emerging markets, and diversified funds have outperformed those focused on a particular sector, both by wide margins. This is unsurprising given the political risks in emerging markets countries can be substantial and that diversified portfolios tend to perform better over longer periods than concentrated ones. Opportunistic infrastructure funds, which have high exposures to greenfield projects and thus construction risk, have underperformed core and value-add strategies.
The limited nature of our infrastructure benchmark, given the small number of funds that existed just a decade ago, means conclusions about this expanding asset class are likely to evolve. Further, investors can’t buy the returns of a private benchmark. In any given vintage year, some private funds will outperform the benchmark and others will underperform. These considerations highlight the importance that thorough due diligence plays in any manager selection process.
Implementation Considerations
While we are concerned about a potential mismatch between the increased amount of capital allocated to the asset class and the pool of viable opportunities, we believe patient investors can still find value in carefully evaluated managers and strategies. As private funds are concentrated collections of assets, with each strategy different from the next, sourcing, structuring, and post-investment value add will ultimately underpin fund performance (Figure 7). Each investor should ensure a manager’s interests are aligned properly with their own interests and carefully evaluate the fund’s bets, risks, and limitations.
Figure 7. Private Infrastructure Fund Strategy Review
As of December 31, 2016
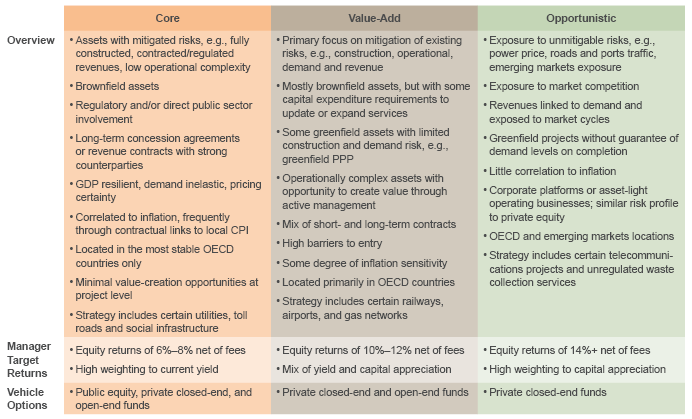
Source: Cambridge Associates LLC.
Note: Manager target returns are illustrative and based on recent meetings with infrastructure fund managers.
- Understanding the Bets. In reviewing potential general partners, investors should carefully consider the fund’s potential sector and geographic exposures relative to the exposure the investor is seeking. Many funds have high allocations to utilities, oil & gas pipelines, and other energy infrastructure assets, exposure that could already be in many investors’ portfolios, particularly those with heavy energy exposure. Alternatively, funds with high allocations to renewable or transportation assets could fill a gap in investor portfolios.
- Evaluating the Risks. Infrastructure has many similar risks to private equity, but its unique qualities expose it to other risks as well. For example, greenfield development for large multi-year infrastructure projects can often fall victim to cost overruns, construction delays, or lofty usage assumptions following the project’s completion. Similarly, long holding periods expose both greenfield and brownfield projects to risks from regulatory bodies, potentially taking the form of an unfavorable tariff review or retroactive charge, and duration risk.
- Recognizing the Limitations. Often discussed as a potential hedge for inflation, investors should recognize infrastructure investments may under deliver—or even not deliver—during high inflationary periods. Certain sectors’ cash flows, such as toll roads, utilities, and some social infrastructure assets, are derived from regulated, inflation-linked tariffs, providing some support for infrastructure’s ability to hedge inflation. However, given the nascent nature of this asset class, the data to evaluate infrastructure’s performance during actual periods of high or sharply rising inflation does not exist.
Across the risk spectrum, we favor established value-add managers that are broadly focused versus sector specific strategies. Returns for opportunistic managers have been lackluster of late, a fact that often piques our interest, but these managers employ significantly riskier strategies, adding leverage, usage, and/or greenfield development risk. Investors looking for this risk profile among private investments may be better served in opportunistic real estate or even private equity. Core strategies may be appealing to certain groups of investors, particularly those driven by liabilities. However, in our view, established value-add managers, particularly those focused on middle-market opportunities in developed countries, appear best positioned to generate infrastructure’s classic characteristic—stable, high-income returns—with some upside in the years ahead.
Index Disclosures
Cambridge Associates LLC Infrastructure Index
The Cambridge Associates LLC Infrastructure Index is a horizon calculation based on data compiled from 93 infrastructure funds, including fully liquidated partnerships, formed between 1993 and 2015. Private indexes are pooled horizon internal rate of return (IRR) calculations, net of fees, expenses, and carried interest.
Cambridge Associates LLC Natural Resources Index
The Cambridge Associates LLC Natural Resources Index is a horizon calculation based on data compiled from 377 natural resources funds, (including 80 energy upstream & royalties, 180 US private equity energy, 71 Ex US private equity energy, and 46 timber funds), including fully liquidated partnerships, formed between 1986 and 2016. Private indexes are pooled horizon IRR calculations, net of fees, expenses, and carried interest.
Cambridge Associates LLC Private Equity Index
The Cambridge Associates LLC Private Equity Index is a horizon calculation based on data compiled from 2,391 private equity funds (buyout, growth equity, private equity energy, and mezzanine funds), including fully liquidated partnerships, formed between 1986 and 2016. Private indexes are pooled horizon IRR calculations, net of fees, expenses, and carried interest.
Cambridge Associates LLC Real Estate Index
The Cambridge Associates LLC Real Estate Index is a horizon calculation based on data compiled from 911 real estate funds, (including
opportunistic and value-added real estate funds) including fully liquidated partnerships, formed between 1986 and 2015. Private indexes are pooled horizon IRR calculations, net of fees, expenses, and carried interest.
MSCI World Index
The MSCI World Index represents a free float–adjusted, market capitalization–weighted index that is designed to measure the equity market performance of developed markets. As of March 2017, it includes 23 developed markets country indexes: Australia, Austria, Belgium, Canada, Denmark, Finland, France, Germany, Hong Kong, Ireland, Israel, Italy, Japan, the Netherlands, New Zealand, Norway, Portugal, Singapore, Spain, Sweden, Switzerland, the United Kingdom, and the United States.
S&P Global Infrastructure Index
The S&P Global Infrastructure Index tracks 75 companies from around the world. Constituents are chosen to represent the listed infrastructure industry while maintaining liquidity and tradability, and are clustered in to three categories: energy, transportation, and utilities.
UBS Global Infrastructure Index
The UBS Global Infrastructure Index is a free float–adjusted, market capitalization–weighted index designed to track the performance of non-utility related global listed infrastructure (transportation and communication).
UBS Global Infrastructure & Utilities 50-50 Index
The UBS Global Infrastructure & Utilities 50-50 Index is a derivative of the UBS Developed Infrastructure & Utilities Index. The infrastructure sector and the utilities sector each have a 50% weighting in terms of free-float market capitalization. Constituents of the index are all listed in developed markets.
Footnotes
- Please see Jonathan Woetzel et al., “Bridging Global Infrastructure Gaps,” McKinsey & Company, June 2016.
- Please see “Failure to Act: Closing the Infrastructure Investment Gap for America’s Economic Future,” American Society of Civil Engineers, May 2016; “Strategic Infrastructure: Steps to Operate and Maintain Infrastructure Efficiently and Effectively,” World Economic Forum, April 2014.
- Please see: “2017 Global Institutional Rebalancing,” BlackRock, January 2017.
- InfraDeals, like all private investment databases, are limited to publicly available data and data collected through proprietary sources. These databases do not capture confidential deals where neither the buyer nor the seller discloses the terms.
- The public benchmark is a constructed index of the UBS Global Infrastructure Index, UBS Global Infrastructure & Utilities 50-50 Index, and the S&P Global Infrastructure Index.
Kevin Rosenbaum, CFA, CAIA - Kevin Rosenbaum is Head of Global Capital Markets Research and Investment Communications at Cambridge Associates.
About Cambridge Associates
Cambridge Associates is a global investment firm with 50+ years of institutional investing experience. The firm aims to help pension plans, endowments & foundations, healthcare systems, and private clients achieve their investment goals and maximize their impact on the world. Cambridge Associates delivers a range of services, including outsourced CIO, non-discretionary portfolio management, staff extension and alternative asset class mandates. Contact us today.