Revving UK Pension Schemes’ Funding Engines


A number of UK defined benefit (DB) pension schemes have experienced significant funding level gains in recent years, driven by sponsor contributions, liability management exercises, and strong equity market returns. Trustees and sponsors are now focussed on protecting these gains while they progress to their long-term objectives. Schemes of all sizes and maturities, including those well along their de-risking journeys, still need to generate meaningful investment returns to close deficits, cover ongoing expenses, and fund any buy-ins en route to their secondary funding objectives. However, due to increased volatility in global equity markets, relatively high valuations in many market segments, and the late stages of the economic and credit cycles, optimising the scheme’s growth engine is more challenging than ever. This paper provides a framework for how to achieve that goal.
Generating Returns Is Critical
We believe trustees and sponsors have four primary levers with which to manage defined benefit pensions: contribution schedule, liability management, liability hedging, and asset returns (Figure 1). All four levers need to be considered as part of developing an integrated risk management framework. This paper focuses on the asset return lever, which plays a crucial role in eliminating deficits and, ultimately, helping trustees reach their secondary funding objectives.
FIGURE 1 EMPLOYING THE RETURNS LEVER
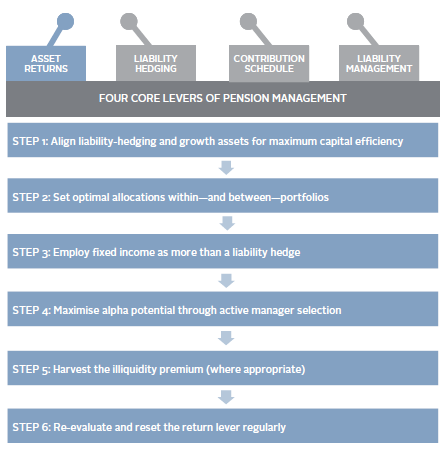
Source: Cambridge Associates LLC.
Clearly underfunded schemes require higher asset returns, but generating excess returns relative to liabilities is important even for better-funded schemes. Investment returns protect against unexpected increases to liabilities due to demographic changes, offset future administrative expenses, and help improve funding levels further towards the trustees’ secondary funding objectives (either buy-out or self-sufficiency).
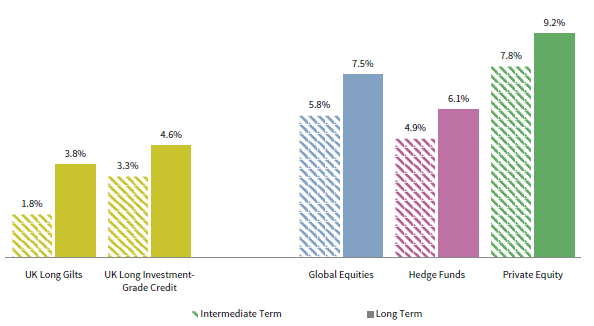
Unfortunately, securing these excess returns will likely be more challenging in the years ahead. Current valuations, particularly in public and private equities, suggest future returns for traditional growth portfolios may be lower than historical averages (Figure 2). This means that active public equities—the mainstay of pensions’ growth portfolios—must work even harder to achieve the necessary growth required to outperform the liabilities. So how, and with what risks, can schemes achieve excess returns?
FIGURE 2 INTERMEDIATE- AND LONG-TERM EXPECTED NOMINAL RETURNS
As at 31 December 2018
Sources: Bloomberg Index Services Limited, Cambridge Associates LLC, FTSE Russell, Hedge Fund Research, Inc., and MSCI Inc. MSCI data provided “as is” without any
express or implied warranties.
Notes: Intermediate-term capital market assumptions for fixed income are current yields on relevant market benchmarks; for all other asset classes, they are a ten-year forecast that explicitly models the current valuation of each asset class, the “fair” or average valuation of each asset class historically, and the estimated return associated with reverting to “fair value” over a ten-year period. These assumptions presume moderate real earnings growth, low corporate default rates, and a return from current values to fair value for equity multiples, government bond yields, and corporate credit spreads. Fair values are largely based on historical averages. Long-term capital market assumptions reflect a blend of ten years of intermediate-term capital market assumptions and 15 years of equilibrium capital market assumptions that focus on the fundamental risk and return characteristics of each asset class, based both on long-term data and capital markets theory, which is agnostic to the current market environment. Both approaches assume an inflation assumption of 2.5%. Expected returns are net of investment manager fees but not any other expenses.
Achieving Return Through Portfolio Construction
Determining how schemes can achieve excess return requires a comprehensive review of the liability profile, trustee objectives, sponsor covenant, and operational constraints. These factors help shape the key strategic decisions which include:
- An efficient balance between liability hedging assets, growth assets, and hybrid assets; 1
- A determination of the appropriate interest rate and inflation hedge ratios;
- A more sophisticated and innovative approach to portfolio construction within liability hedging, hybrid, and growth assets;
- The appropriate amount of active manager risk (relative to the overall markets); and
- The degree of illiquidity risk the scheme can withstand.
Liability-Driven Investment and Hedging
Given depressed growth asset return expectations, efficient use of capital is paramount to construct a portfolio capable of outperforming the liabilities, while still hedging an appropriate amount of interest rate and inflation risks. The optimal hedge ratio should consider the current market environment, as well as the cost of hedging relative to the amount of risk reduction. It may not be cost-effective, or the best risk management approach, for trustees to hedge all interest and inflation risks.
Trustees can then use the full toolkit of liability-driven investment (LDI) options, as opposed to only long-duration physical bonds, to accomplish these objectives. That is, an efficient approach can hedge more interest and inflation rate risk with a smaller allocation, which frees up more capital to pursue growth strategies. For example, by using leveraged LDI funds in place of long duration gilts, trustees can achieve the same interest rate and inflation hedge ratios with 25% to 50% less capital.
The Starting Point for Asset Allocation
Setting a pension scheme’s strategic asset allocation has evolved from setting a simple growth–matching split. Instead, a target liability hedge ratio often sets a floor for the allocation to matching assets, with the remaining assets often deployed in traditional growth or hybrid assets, which offer a higher-than-expected return than matching assets. Such hybrid assets, often in combination with LDI, can form the basis for a cashflow-driven investment (CDI) strategy where schemes aim to generate sufficient yield to pay cash outflows over the near term without being forced to sell growth assets. The precise split between matching, growth (including growth diversifiers), and hybrid assets will depend on required return, risk tolerance (including hedge ratio), income requirements, and trustee beliefs.
After identifying the appropriate balance between growth, matching, and hybrid assets, trustees turn their attention to constructing portfolios within these allocations. In doing so, schemes should maximise the excess return potential relative to funding level volatility, evaluating not only expected market returns (Figure 2), but also the opportunity for alpha, or manager value-add (Figure 3). Another key consideration is the interaction between asset classes, including the often-underappreciated correlation between corporate bond spreads in the liability-hedging portfolio and public equities in the growth portfolio.
FIGURE 3 DISPERSION OF COMPOUND MANAGER RETURNS OVER TEN YEARS
As at 31 December 2018
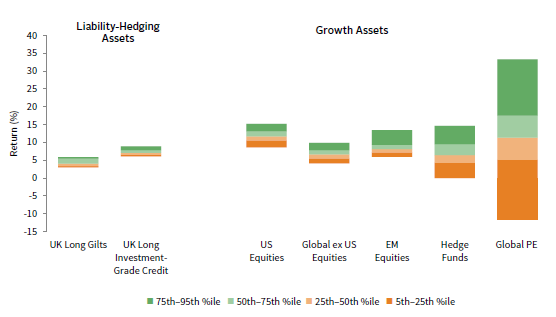
Sources: Cambridge Associates LLC and eVestment.
Notes: Liability-hedging assets data are sourced from eVestment; Cambridge Associates data are used for all other asset classes. Returns for bond, equity, and hedge fund managers are average annual compound returns (AACRs) for the ten years ended 31 December 2018, and only managers with performance available for the entire period are included. Returns for private investment managers are horizon internal rates of return (IRRs) calculated since inception to 30 September 2018. Time-weighted returns (AACRs) and money-weighted returns (IRRs) are not directly comparable. Cambridge Associates LLC’s (CA) bond, equity, and hedge fund manager universe statistics are derived from CA’s proprietary Investment Manager Database. Managers that do not report in US dollars, exclude cash reserves from reported total returns, or have less than $50 million in product assets are excluded. Performance of bond and public equity managers is generally reported gross of investment management fees. Hedge fund managers generally report performance net of investment management fees and performance fees. CA derives its private benchmarks from the financial information contained in its proprietary database of private investment funds. The pooled returns represent the net end-to-end rates of return calculated on the aggregate of all cash flows and market values as reported to Cambridge Associates by the funds’ general partners in their quarterly and annual audited financial reports. These returns are net of management fees, expenses, and performance fees that take the form of a carried interest.
Active Management
Figure 3 demonstrates that the greatest opportunities for additional return lie within growth asset classes. For example, the return differential between top quartile and median long UK investment-grade credit managers is 0.8%, compared to 1.2% in global equities, 3.1% in hedge funds, and 6.2% in global private equity. Still, trustees should not ignore the opportunity to add value in their fixed income allocation, especially as the scheme de-risks and these assets increase in size relative to growth assets.
Of course, the opportunity set is much wider in growth assets, particularly in alternative assets. Alternatives also often exhibit a lower correlation and a lower beta relative to global equity markets, making them particularly attractive in today’s environment. That said, the appeal of alternatives may be tempered by their illiquidity, complexity, limited transparency, and higher fees.
Illiquid, but Cashflow-Generative
Alternatives may enable trustees to achieve higher returns than those possible through traditional asset classes. However, in accessing these investments’ potential return lift, trustees must consider the different types of risk they may consequently incur, particularly illiquidity risk.
The distinction between growth and matching assets has become blurred, with a great universe of hybrid assets emerging, which offer both yield potential and growth. These hybrid assets can be illiquid, in terms of outright selling, but importantly, are highly cash-generative, and can be very useful for cashflow negative schemes.
While mature schemes close to buy-out may need a high level of liquidity, many UK trustees overestimate the amount of liquidity they need. In fact, less mature schemes with a longer time horizon, or schemes looking to target a low-risk, self-sufficient approach can benefit from illiquid private investments (such as private credit, infrastructure, and private equity). In addition, for all schemes, hedge funds (which, though not daily traded, rarely have lock-up periods longer than one year) can play a crucial role in reducing portfolio—and therefore funding level—volatility. This is especially true in down markets.
Putting It Together
For trustees willing to invest the required resources in portfolio implementation, a capital-efficient, risk-diversified portfolio can significantly outperform a traditional pension portfolio on a risk-adjusted basis. For instance, for a closed scheme with a 75% funding level, replacing a portfolio of 60% global equities/40% bonds with 60% diversified growth assets and 40% in physical UK Government bonds (without using leverage), trustees can maintain the expected beta return while reducing funding level risk. More importantly, by including alternatives, the potential manager value-add (i.e., alpha) increases significantly, making this option even more attractive (Figures 3 and 4).
FIGURE 4 SAMPLE PORTFOLIOS
As at 31 December 2018
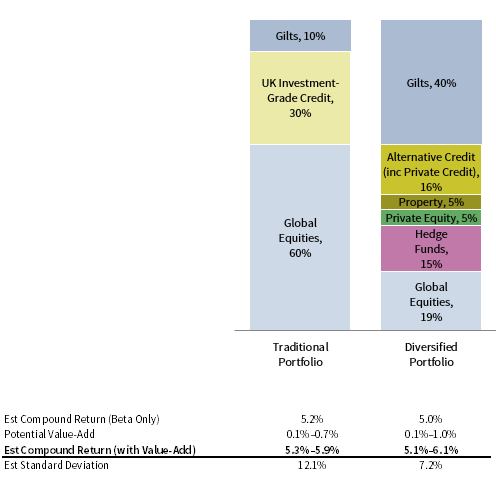
Sources: Bloomberg Index Services Limited, Cambridge Associates LLC, FTSE Russell, Hedge Fund Research, Inc., and MSCI Inc.
MSCI data provided “as is” without any express or implied warranties.
Notes: Expected return and risk reflect intermediate-term capital market assumption. Potential value-add reflects no value-add for
UK Government Bonds, the difference between 25th and 50th percentile manager returns shown in Figure 3 and relevant indexes
for public markets, and the difference between 25th to 50th percentile manager returns and the median manager return shown in
Figure 3 for alternatives. The calculation accounts for average manager fees by asset class.
Fixed Income: Risk Reduction through LDI
Historically, when DB schemes were immature and well-funded, there was less emphasis on the fixed income allocation, as the primary goal was to provide a broad hedge against interest rates and inflation risks. LDI took this one step further and provided a more capital-efficient approach by incorporating leverage to increase the hedge ratio.
Nowadays, pension schemes face new problems. A growing proportion of closed schemes are turning cashflow negative on the back of improvements to funding levels in recent years. This leads to a greater focus on income generation, so that cashflows can be met without having to be a “forced seller” of growth assets, commonly referred to as a CDI strategy. Therefore, the role of the fixed income portfolio is changing, and trustees are spending more time trying to get the most out of the fixed income allocation, which is difficult in the current low-yield environment. So, what can trustees do within fixed income to help?
LDI forms a core component of the matching portfolio. As funding levels rise, the relative size of the matching allocation, and the importance of protecting the funding level from market risks, increases. As such, a scheme’s LDI portfolio needs to be well-structured, tailored to a specific pension scheme’s liability profile, and cost-effective to implement.
Trustees’ next job within fixed income is to reduce the cashflow mismatch using high-quality, stable, income-generating asset classes to complement the government bonds backing the LDI portfolio. It is not possible or practical to try and match all future cashflows, but the first five to ten years of cashflows can be projected with enough certainty to build a robust CDI portfolio. This approach means trustees are less reliant on liquidating growth assets, which gives them the freedom to invest in less liquid and higher-returning investments.
Generating Alpha Using Hybrid Assets
Although the potential for manager value-add in investment-grade credit is lower than for other growth assets, trustees should not overlook the potential for credit alpha particularly given the asymmetric return profile. As schemes mature, the focus shifts to generating returns to meet a secondary funding target while generating sufficient income to pay benefits as they fall due. This makes active management of the hybrid allocation essential.
In addition to relying on manager skill within investment-grade credit, trustees can generate excess return and yield by allocating to alternative credit market segments. These include high-yield credit, bank loans, emerging markets debt, secured credit, collateralised loan obligations, and private credit. 2 When sized appropriately and considered holistically with the LDI and growth assets, alternative credit can generate higher yield and diversify existing fixed income holdings, while complementing the rest of the portfolio.
Within alternative credit, private credit (which, as an asset class, has more than tripled in size since 2007) may be particularly attractive, but careful strategy selection is required. Senior-secured direct lending has started to become expensive, whilst other strategies such as royalties, insurance-linked securities or long-term leasing, which offer better pricing in the current environment, are more attractive.
Private credit is more liquid than private equity; many private credit strategies provide long-term cashflows. Furthermore, the yield pick-up relative to corporate bonds is material, which makes it particularly beneficial for CDI strategies. As with any illiquid strategy, comprehensive asset-liability modelling, thorough manager research, and ongoing monitoring are crucial in the successful implementation of a private credit mandate which meets the unique needs of the pension scheme.
Growth Engine Opportunities
Global equities, private investments, and hedge funds form the growth engine of the pension strategy. In this section, we review the value-add potential, as well as considerations associated with each of these investment types.
Public Equities
Global equities are usually the cornerstone of the scheme’s growth portfolio. Although some degree of passive management is often appropriate (e.g., schemes with significant benefit outflows with high liquidity needs), active management of public equities—particularly global and emerging markets equities—can be helpful.
While the differential between top quartile and median US, global ex US, and emerging markets equities managers is relatively small at approximately 1.0 percentage points, the dispersion is greater amongst top-quartile managers: the difference between 5th and 25th percentiles is 2.1 percentage points for developed markets managers, but 4.1 percentage points for emerging markets managers. This is not surprising, since emerging markets equities are generally less efficient than their developed counterparts and, hence, present greater potential for alpha generation.
Although the strong case for active management in emerging markets is well understood, we believe that active management can also be useful in developed markets. This is particularly true in the late stages of a bull market; as passive management products tend to become overly concentrated in specific sectors or a subset of stocks. An example of this is the MSCI World Index’s large exposure to technology stocks at present. As such, active management may protect investors against the high equity valuations that have become common across many markets.
As with all investment decisions, trustees should consider the suitability of all investments based on their risk appetite and investment beliefs. Specifically, trustees should devote experienced external or internal resources to conduct due diligence and ongoing monitoring on all investment opportunities to determine appropriate risk exposures, sizing for investment managers, countries, and regions within the scheme’s equity portfolio.
Private Investments
By including private equity, venture capital, and real assets (such as real estate and infrastructure) in growth portfolios, trustees can significantly expand their investment opportunity set, level of diversification and potential for generating alpha. Private investments have become increasingly integral to a well-constructed and diversified portfolio as the number of public equity stocks has fallen by nearly 50% since its peak in 1996 and as once-rare investment types, such as co-investments and secondaries, have become more common.
For trustees willing to lock up even a limited portion of their assets and accept the complexity of the asset class, private investments have the potential to increase portfolio returns significantly and offer multiple other attractive attributes. They have demonstrated outperformance versus public markets over appropriately long periods of time (Figure 5); private equity, for example, has outperformed its public market equivalent by 5.1% and 5.6% over ten and 20 years, respectively, as calculated on a Cambridge Associates modified Public Market Equivalent (mPME) basis. 3 Private investments can also benefit the total portfolio by reducing portfolio volatility and, thus, funding level volatility. This is because private investments are valued on a quarterly basis, and the nature of the valuation process causes some stickiness in the portfolio (to the upside and the downside) over the long term. For example, the CA Global Private Equity/Venture Capital Index realised significantly smaller drawdowns compared to public equities during the 2000–03 technology bust and the 2007–09 Global Financial Crisis (GFC), outperforming by 4.8 and 18.4 percentage points, respectively, as calculated on a Cambridge Associates mPME basis (Figure 6).
FIGURE 5 PUBLIC VS PRIVATE EQUITY RETURNS
As at 31 December 2018 • IRR (%)
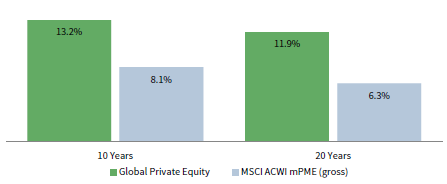
Sources: Cambridge Associates LLC and MSCI Inc. MSCI data provided “as is” and without any expressed or implied warranties.
Notes: Based on all global private equity (buyout, private equity energy, growth equity, and subordinated capital funds) funds
tracked by Cambridge Associates that were active during the time periods analyzed. Returns for private investments are based on
quarterly end-to-end internal rates of return, which are net of fees, expenses, and carried interest; analysis includes funds from
vintage years 1998–2012. Cambridge Associates mPME methodology replicates private investment performance under public
market conditions and allows for an appropriate comparison of private and public market returns. The mPME analysis evaluates
what return would have been earned had the dollars invested in private investments been invested in the public market index
instead. Total return data for the MSCI ACWI are gross of dividend taxes.
FIGURE 6 PUBLIC VS PRIVATE EQUITY RETURNS DURING THE TECH BUBBLE AND THE GLOBAL FINANCIAL CRISIS
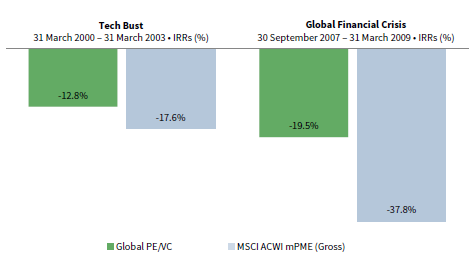
Sources: Cambridge Associates LLC and MSCI Inc. MSCI data provided “as is” and without any expressed or implied warranties.
Notes: Based on all global private equity (buyout, private equity energy, growth equity, and subordinated capital funds) and
venture capital funds tracked by Cambridge Associates that were active during the time periods analyzed. Returns for private
investments are based on quarterly end-to-end internal rates of return, which are net of fees, expenses, and carried interest.
Cambridge Associates mPME methodology replicates private investment performance under public market conditions and allows
for an appropriate comparison of private and public market returns. The mPME analysis evaluates what return would have been
earned had the dollars invested in private investments been invested in the public market index instead. Total return data for the
MSCI ACWI are gross of dividend taxes.
Investing in private vehicles requires patience. Based on Cambridge Associates’ research, the typical private equity fund takes six to seven years on average to produce meaningful performance results. To realise long-term success, therefore, trustees must be able to stay the course over a long enough period to achieve mature performance. Current and future liquidity needs, informed both by the cashflow profile and the ultimate endgame for the scheme, should help determine the sizing of and types of strategies within the private investments portfolio. A mature private equity programme can be one of the most cash generative investments, with annualised distributions of more than 10% p.a. Yet trustees often shy away from private investments and sacrifice its return potential by overestimating their liquidity needs or assuming all private investments are similarly illiquid.
In fact, different kinds of private investments have different liquidity time horizon profiles, ranging from as little as six to eight years for secondaries and up to ten or more years for venture and buyout funds. The cashflow profile of private investments can also vary by strategy and vintage year, in part due to the ebb and flow of merger & acquisition activity and capital markets movements, with venture and buyout funds generally having less predictable cashflows than private credit. While exact cashflow planning for a private investment portfolio is not possible, appropriate commitment pacing as well as disciplined portfolio monitoring, can help trustees build a suitably cash-generative private investments portfolio.
In contrast to publicly traded equities and debt, there is no passive (or indexed) approach to private investing. Across the asset class, the dispersion of manager returns is substantial, liquidation prior to fund wind down can be costly, and operational complexity is high. Therefore, extracting value from private investments requires skill in all stages of the investment process. Harvesting the return premium offered by private investments requires effective planning, ongoing manager due diligence and portfolio construction, vintage-year diversification, cashflow management between funds distributing capital and those calling it, and fund document legal review.
Diversifiers
Diversifying assets, such as hedge funds, can enhance total portfolio returns over the long term through diversification, lower volatility, and downside protection. Despite the many challenges associated with hedge funds, introducing a well-designed hedge fund programme into an integrated risk management investment strategy is attractive. This is true even in the current environment, which has been punctuated by volatile equity markets and a rising risk of a market drawdown.
As with private equity, trustees should be extremely selective when investing in hedge funds, since, in aggregate, the hedge fund universe delivers little to no value relative to a simple stock/bond portfolio. Investors should also be aware that many funds charge high fees, employ excessive leverage, and provide little transparency. Of the approximately 8,000 hedge funds worldwide, we believe 5%, at most, merit institutional capital. As for the fees, liquidity, transparency, and leverage associated with hedge funds, these are legitimate issues that should be fully explored in the context of each strategy. Often, they may be surmountable, or have enough off-setting advantages.
Different types of hedge fund strategies can play various roles within a portfolio. Trustees should consider the role that each strategy serves in the context of the scheme’s total portfolio. For example, certain global macro and quantitative strategies present opportunities to generate uncorrelated returns, regardless of market direction, and decrease portfolio volatility. On the other hand, equity-linked strategies, such as equity long/short, have overall betas ranging from near zero to as high as one, and thus can be more market oriented. Finally, the fluid nature of certain hedge funds and their ability to actively manage exposures across instruments and opportunistically shift positioning toward less exploited areas can help protect portfolios.
To illustrate this point, Figure 7 shows the impact of a hypothetical 10% global equity market correction on a traditional portfolio (60% global equities and 40% long-duration bonds) versus one that includes a 20% allocation to hedge funds. Under this scenario, the traditional portfolio falls by 6.0%, but a portfolio with the 20% allocation to hedge funds falls by just 4.5%. The smaller loss implies a smaller decline in funding level, protecting members’ benefits at a time when sponsors are unlikely to be able to make additional contributions. Indeed, during two well-known market downturns—the 2000–2003 technology bust and the GFC—allocating to hedge funds could have significantly reduced the drawdown in a scheme’s growth assets and, therefore, protected the returns of the total portfolio and funding level (Figure 8).
FIGURE 7 IMPACT OF A 10% GLOBAL EQUITY MARKETS CORRECTION
As at 31 December 2018 • Return (%)
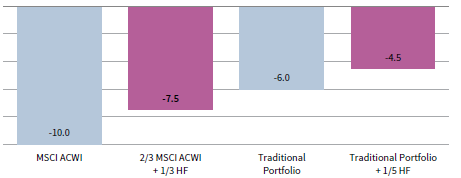
Sources: Bloomberg Index Services Limited, Cambridge Associates LLC, MSCI Inc., and Thomson Reuters Datastream. MSCI data
provided “as is” without any express or implied warranties.
Notes: Hedge fund data are through March 31, 2018. Hedge fund returns shown are net of manager and CA fees. CA fees are
estimated based on a model fee calculation using the highest CA fee schedule appropriate for the client type and service provided.
The model fee deducted was equal to or greater than actual fees paid by that client to CA. Total return data for the MSCI ACWI are
gross of dividend taxes prior to 2001 and net of dividend taxes thereafter. This exhibit uses the average performance of MSCI ACWI,
Traditional Portfolio, and Traditional + Hedge Funds Portfolio during one-month periods where the MSCI ACWI returned less than -8%
since 2000. Those average returns are then scaled to -10% MSCI ACWI returns for uniformity and to increase the size of the data set.
Actual average returns over the one-month periods included in the analysis where -10.1%, -7.6%, -6.1%, and -4.6% for the MSCI ACWI,
2/3 MSCI ACWI and 1/3 HF, Traditional Portfolio, and Traditional Portfolio + 1/5 HF, respectively. Please see figure notes and the
performance disclosure at the end of the publication for information about the portfolios and the hedge fund component.
FIGURE 8 GROWTH PORTFOLIO RETURNS DURING THE TECH BUBBLE AND THE GLOBAL FINANCIAL CRISIS
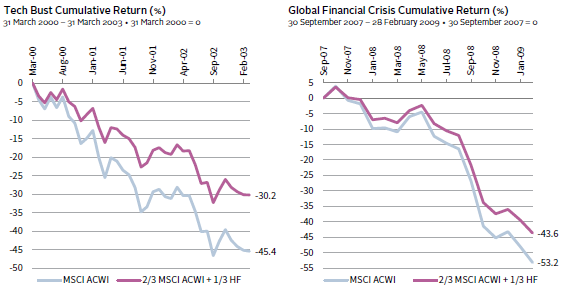
Sources: Bloomberg Index Services Limited, Cambridge Associates LLC, MSCI Inc., and Thomson Reuters Datastream. MSCI data provided “as is” without any express or implied warranties.
Notes: Data are monthly. Total return data for the MSCI ACWI are gross of dividend taxes prior to 2001 and net of dividend taxes thereafter. Hedge fund returns shown are net of manager and CA fees. CA fees are estimated based on a model fee calculation using the highest CA fee schedule appropriate for the client type and service provided. The model fee deducted was equal to or greater than actual fees paid by that client to CA. Please see figure notes and the performance disclosure at the end of the publication for information about the hedge fund component.
In positive market environments, most hedge funds do not generate the same strong returns as equities. However, hedge funds are a compelling allocation option when considering performance across a full market cycle, given their downside protection and the opportunity for manager value-add. In particular, capital preservation during bear markets enables low-beta/high-alpha hedge funds 4 to capture the long-term benefits of compounding returns. On the flip side, hedge funds have greater flexibility to increase exposure when valuations are cheaper and, hence, be positioned to better profit from downturns.
A well-constructed hedge fund portfolio containing a select group of high-conviction strategies should enable trustees to enjoy the risk/return benefits that hedge funds offer without significantly compromising overall portfolio liquidity. Challenges notwithstanding, an allocation to low-beta/high-alpha hedge funds can play a powerful role in enhancing a scheme’s risk-adjusted returns and should be emphasised in the context of holistic pension risk management.
Conclusion
While trustees and sponsors should regularly review all four levers governing their pension strategy as part of an integrated risk management framework, they should pay extra attention to the growth lever at this point in the cycle. High valuations, lower expected returns, and equity market volatility also suggest that schemes stand to benefit from re-evaluating their growth assets and ensuring they align with the long-term objectives. In doing so, trustees should consider the full spectrum of growth strategies, evaluate the potential for active manager value-add, and engage the appropriate resources to construct portfolios tailored to their specific needs.
Setting the return generation lever is not a one-time exercise. Trustees should recalibrate portfolios on a regular basis to ever-changing market conditions, scheme circumstances, and sponsor-specific dynamics. For all UK DB schemes, but particularly for those progressing along a de-risking journey plan, return generation goals, income needs, and funding level volatility tolerance will evolve over time, necessitating changes to the size and composition of the growth portfolio. A comprehensive review of the growth lever is critical to scheme success.
Performance Disclosure
The CA Nondiscretionary Portfolio Management Hedge Fund Composite includes 396 hedge fund program returns for the Cambridge Associate Group’s hedge fund clients who receive(d) hedge fund performance reports as at 31 December 2018. Returns shown are net of manager fees but gross of CA fees. At the inception of the composite, CA had two hedge fund clients in the sample. Clients are added to the sample over time based on their nondiscretionary investment management contract start date and are included for those periods during which they are nondiscretionary portfolio management clients. Annualised mean returns are calculated based on a monthly asset–weighted client composite return. This publication contains hypothetical performance. Hypothetical performance results have many inherent limitations and are used for illustrative purposes only.
This publication is provided for informational purposes only. The information does not represent investment advice or recommendations, nor does it constitute an offer to sell or a solicitation of an offer to buy any securities. Any references to specific investments are for illustrative purposes only. The information herein does not constitute a personal recommendation or consider the particular investment objectives, financial situations, or needs of individual clients. Information in this report or on which the information is based may be based on publicly available data. CA considers such data reliable but does not represent it as accurate, complete, or independently verified, and it should not be relied on as such. Nothing contained in this report should be construed as the provision of tax, accounting, or legal advice.
Past performance is not indicative of future performance. Broad-based securities indexes are unmanaged and are not subject to fees and expenses typically associated with managed accounts or investment funds. Investments cannot be made directly in an index. Any information or opinions provided in this publication are as of the date of the publication, and CA is under no obligation to update the information or communicate that any updates have been made. Information contained herein may have been provided by third parties, including investment firms providing information on returns and assets under management, and may not have been independently verified.
Figure Notes
The Traditional Portfolio in Figure 7 is made up of 60% MSCI All Country World Index (Net) and 40% Bloomberg Barclays Long-Term Government/Credit Index. The Traditional + HF Portfolio is made up of 40% MSCI All Country World Index (Net), 20% CA Nondiscretionary Portfolio Management Hedge Fund Composite, and 40% Bloomberg Barclays Long-Term Government/Credit Index. All portfolios are rebalanced monthly and do not include any contributions or benefit payments. The Bloomberg Barclays US Long Credit return is used as a proxy for the change in liability. MSCI ACWI returns use returns gross of dividend taxes prior to 2001 and returns net of dividend taxes thereafter. Returns are in USD terms.
Index Disclosures
Bloomberg Barclays Long-Term Government/Credit Index
The Bloomberg Barclays Long-Term Government/Credit Index is an unmanaged index of US government and investment-grade credit securities with a maturity of ten years or more.
Bloomberg Barclays Sterling 15+ Year Aggregate Gilts Bond Index
The Bloomberg Barclays Sterling 15+ Year Aggregate Gilts Bond Index measures the performance of the UK Government bond (gilt) market and includes public obligations of the United Kingdom with maturities of more than 15 years. Using market capitalisation–weighting and a standard rule-based inclusion methodology, the index reflects the performance and characteristics of the gilt market. Securities must be rated investment grade, as defined by the index methodology.
FTSE Actuaries Over 15 Years UK Gilt Index
The FTSE Actuaries UK Gilts Index Series is a broad-based family of indexes and related bonds data (e.g., duration) based on all eligible British Government Securities.
HFRI Fund-of-Funds Composite Index
The HFRI Fund-of-Funds Composite Index is equal-weighted and consists of more than 800 constituent hedge funds, including both domestic and offshore funds.
iBoxx £ Non-Gilts 15+ Years Index
The Markit iBoxx GBP Benchmark Indexes represent the investment-grade fixed-income market for sterling-denominated bonds.
MSCI All Country World Index
The MSCI ACWI is a free float–adjusted, market capitalisation–weighted index designed to measure the equity market performance of developed and emerging markets. The MSCI ACWI consists of 46 country indexes comprising 23 developed and 26 emerging markets country indexes. The developed markets country indexes included are: Australia, Austria, Belgium, Canada, Denmark, Finland, France, Germany, Hong Kong, Ireland, Israel, Italy, Japan, the Netherlands, New Zealand, Norway, Portugal, Singapore, Spain, Sweden, Switzerland, the United Kingdom, and the United States. The emerging markets country indexes included are: Argentina, Brazil, Chile, China, Colombia, Czech Republic, Egypt, Greece, Hungary, India, Indonesia, Korea, Malaysia, Mexico, Pakistan, Peru, Philippines, Poland, Qatar, Russia, Saudi Arabia, South Africa, Taiwan, Thailand, Turkey, and the United Arab Emirates.
MSCI Emerging Markets Index
The MSCI Emerging Markets Index represents a free float–adjusted, market
capitalisation–weighted index that is designed to measure equity market performance of emerging markets. It includes 26 emerging markets country indexes: Argentina, Brazil, Chile, China, Colombia, Czech Republic, Egypt, Greece, Hungary, India, Indonesia, Korea, Malaysia, Mexico, Pakistan, Peru, the Philippines, Poland, Qatar, Russia, Saudi Arabia, South Africa, Taiwan, Thailand, Turkey, and the United Arab Emirates.
Footnotes
- Liability-hedging assets are tasked with hedging changes in liabilities due to changes in interest rates and inflation, growth assets are tasked with generating superior asset returns in excess of the liabilities, and hybrid assets offer both return and cashflow matching characteristics.
- Because alternative credit, and particularly private credit, is not as highly correlated to high-quality corporate bonds and liability discount rates as Treasuries and investment-grade credit, it may be considered part of the growth portfolio. However, given their cashflow-generative properties, fixed income–like characteristics, and generally lower expected returns compared to common growth assets, we include these asset classes in the liability-hedging portfolio in this publication.
- CA’s mPME replicates private investment performance under public market conditions. The public index’s shares are purchased and sold according to the private fund cashflow schedule, with distributions calculated in the same proportion as the private fund, and mPME NAV is a function of mPME cashflows and public index returns.
- The term “low-beta/high-alpha” can take on multiple meanings depending on the nature of the plan and its risk tolerance, but it generally means that the strategy has a beta of significantly less than 1 (and perhaps as low as 0) to the equity markets and positive alpha relative to the beta-adjusted equity markets
Alex Koriath, CFA - Alex Koriath is a Partner and EMEA Regional Head at Cambridge Associates.
About Cambridge Associates
Cambridge Associates is a global investment firm with 50+ years of institutional investing experience. The firm aims to help pension plans, endowments & foundations, healthcare systems, and private clients achieve their investment goals and maximize their impact on the world. Cambridge Associates delivers a range of services, including outsourced CIO, non-discretionary portfolio management, staff extension and alternative asset class mandates. Contact us today.