A Balancing Act: Strategies for Financial Executives in Managing Pension Risk

Balancing Act Preview:
Defined benefit pension plans in the United States are established and maintained with noble intentions, providing valuable retirement benefits to employees. Yet these plans are anything but straightforward in terms of the impact on their sponsors. The ultimate cost of providing a defined benefit stream is never known up front and depends greatly on strategic choices made by the sponsor as well as macroeconomic factors outside the sponsor’s control.
And indeed, market volatility and plummeting liability discount rates have created pension cost headwinds for both the income statement and the balance sheet. In a given year or quarter, these negative effects can be isolated and managed as one-time, line item expenses. However, over longer periods, their cumulative impact can be significant, greatly curtailing a company’s ability to direct precious funding resources to core operations and future capital investments.
Further, despite a major market rally and having pumped almost half a trillion dollars into their plans, the companies in the S&P 500 have seen their funded status tick up only 2 percentage points in the last eight years, from 79% to 81%. 1 Defined benefit plans that are poorly managed can threaten an enterprise’s cash flow, liquidity, access to capital, credit rating stability, and investor sentiment.
Clearly, financial executives need to consider multiple levers in seeking to attain full funding for their plans. In this paper we review four levers that are fundamental drivers of pension costs and outcomes: asset returns, liability hedging, contribution policy, and benefit management. Balancing these levers is critical to enabling greater probability of success in managing pension risk, and we introduce a framework for chief financial officers and other financial executives to use in doing so.
The Four Core Levers of Pension Management
As pressures on pensions mount, we believe financial executives are best served by re-evaluating major decisions in terms of the true tools at their disposal. The strategic choices of a sponsor in managing pension risk can be distilled into four basic levers:
- Asset returns
- Liability hedges
- Contribution policy
- Benefit management

FIGURE 1 FOUR CORE LEVERS OF PENSION MANAGEMENT
Viewed in this way, it may be tempting to consider pulling on one lever and ignoring the others. Using a sample defined benefit plan that is 80% funded ($1 billion liability, $800 million of assets), we analyzed how far the asset return, liability hedge, and contribution policy levers would have to be pulled in isolation to reach 100% funded in five years (Figure 2). Relying only on growth asset returns to make up the gap would require an eye-popping 15.7% return in each of the five years. Relying only on a “rate wait” approach—i.e., letting higher interest rates drive the liability lower—would require a stunning 550 basis point increase in the discount rate in just five years. Relying only on cash contributions to attain full funding would require $67 million per year, a cumulative amount representing over 40% of the plan’s starting asset value. Clearly, asking any one lever in isolation to carry the weight is unrealistic.

FIGURE 2 USING ONLY ONE LEVER, WHAT IS NEEDED TO REACH 100% FUNDED IN FIVE YEARS?
Since each lever must play a role to some degree, the natural question is “how much of each is appropriate?” Using these levers becomes a balancing act in assessing the most productive outcome for each plan’s health and cost, relative to the risk assumed by the broader organization.
The critical first step of this balancing act is to calibrate the scale, as what constitutes being “in balance” will not be the same for all firms given their specific goals, priorities, and constraints. Once the end state is clearly defined, attention can turn to how best to arrange the levers on the scale to achieve the desired balance. We show one way of thinking about this in Figure 3. On the left side of the scale are asset returns and liability hedges, levers that relate to specific investment portfolio choices. On the right side of the scale are contribution policy and benefit management, levers that represent choices outside the portfolio. At the strategic level, many trade-offs can be made among these four levers and all of them are closely interrelated. For example, a sponsor contributing more to its plan will, all else equal, require a lower asset return to achieve a higher funded status, which in turn impacts the specific investment strategy chosen as well as the balance between growth assets and liability hedging assets.
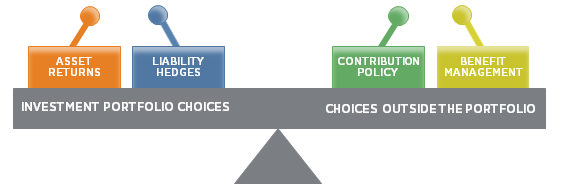
FIGURE 3 BALANCING THE FOUR CORE LEVERS OF PENSION MANAGEMENT
However, not only must important trade-offs be made among the four levers, but many trade-offs and decisions must also be made within each lever, and decisions made within one lever will have spillover impacts on the others. For example, reducing asset volatility and directional equity exposure within the asset return lever may mean a plan will need to ramp up the contribution policy lever, as lower asset returns will necessitate higher contributions in the future. In subsequent sections we highlight some of the key decisions and trade-offs to be made under each of the four key levers.
By understanding the risks and impact of these pension management levers as a whole, as well as the trade-offs among decisions made within each of the levers, financial executives will be well armed to balance and deploy multiple tools to optimize their pensions and keep the plan in relative harmony with the broader organization. This can be a competitive advantage, as individual internal stakeholders (e.g., human resources or treasury) and outside advisors to the plan (e.g., actuary, investment managers, insurance companies) may not always be aware of the full range of organizational impacts of each pension decision.
Growth Asset Returns—The Engine for Funding
Pension assets have only two ways to grow: investment returns or new contributions. Strong asset returns are clearly the more preferable avenue and can lower the overall cost of providing a defined retirement benefit by reducing the amount of future required contributions. In assessing the impact of pension costs on the bottom line, plan sponsors must estimate expected returns. Over time, actual investment returns must keep up with sponsors’ estimates to avoid detrimental impacts on pension costs (and thus a company’s financial statements) in the future.
And therein lies the rub. Even as investment returns can be subject to high degrees of risk and uncertainty, valuations do impact returns over long-term time horizons. Unfortunately, today’s elevated valuations for both growth-oriented global equity and liability-hedging long duration fixed income result in projected future returns for traditional portfolios that are lower than historical averages. Our analysis projects mid-single-digit global equity and low single-digit fixed income returns over the next ten years in a “return to normal” scenario where valuations steadily revert to more normalized levels (Figure 4). 2
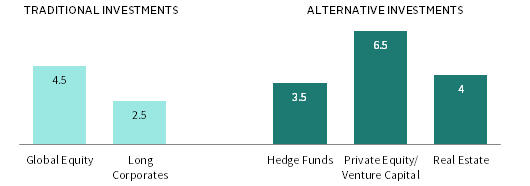
FIGURE 4 TEN-YEAR NOMINAL RETURN TO NORMAL SCENARIOS
As of September 30, 2017
Sources: Barclays, Bloomberg L.P., Cambridge Associates LLC, Global Financial Data, Inc., MSCI Inc., and Thomson Reuters Datastream. MSCI data provided “as is” without any express or implied warranties.
Notes: Projections are in local currency terms and are intended to represent total returns, rounded to the nearest half decimal. Projected global equity returns are based on a weighted average of projections for US, developed ex US, and EM equities using month end weights for the MSCI All Country World Index. The accounting liability return is commensurate with long corporates. Projected hedge fund returns are intended to reflect market-wide performance as defined by particular HFRI indexes, and not the performance or value-added potential of a specific program. The return projection for private equity/venture capital is not calculated using the same “bottom up” methodology as the other asset classes; rather, it is calculated as the projected global equity return plus 2%.
If our projection for muted investment returns proves to be accurate, plan sponsors will be challenged to generate returns in line with their assumptions. One response may be to increase the level of risk via traditional investments to generate higher returns. However, this can have severe reverberations across the organization during an asset drawdown. We believe many sponsors should instead consider changing the type of risk they incur by adding exposure to alternative investments.
For those plans that have the ability to assume illiquidity risk and invest the needed resources in implementation, we believe a more diversified portfolio construction and calibrated use of active management can yield significant benefits to investment returns. Private investments have the potential to add substantial value if the program is rigorously researched and tailored to the specifics of each plan. For instance, private equity investments have generated superior returns relative to public equivalents over long-term time horizons (Figure 5).
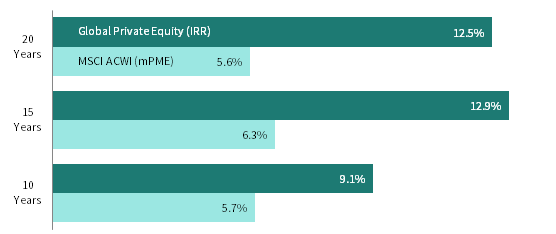
FIGURE 5 COMPARING PRIVATE AND PUBLIC HISTORICAL INDEX RETURNS
As of March 31, 2017 • Annualized
Sources: Cambridge Associates LLC and MSCI Inc. MSCI data provided “as is” without any express or implied warranties.
Notes: The global private equity index is a pooled horizon internal rate of return (IRR), net of fees, expenses, and carried interest. Cambridge Associates modified public market equivalent (mPME) methodology replicates private investment performance under public market conditions and allows for an appropriate comparison of private and public market returns. The mPME analysis evaluates what return would have been earned had the dollars invested in private investments been invested in the public market index instead. Total return data for the MSCI ACWI are gross of dividend taxes through fourth quarter 2000 and net of dividend taxes thereafter.
Yet, many plans overlook such opportunities, allocating far more than they need to traditional investments. This avoidance may result from lack of familiarity or a low comfort level with private investments, concerns over high asset manager fees, long lock-up periods, or uncertainty about future cash contributions. However, willingness to invest in alternatives (and taking the associated illiquidity risk) can be an effective way to enhance return potential for plan assets.
For more information please see “Private Credit Strategies: An Introduction,” Cambridge Associates LLC, 2017.
If a plan termination or larger risk transfer transaction is on the horizon, illiquid assets may not be a realistic solution. However, all alternatives should not be painted with the same “illiquid” brush. Each category of alternative assets has different characteristics in terms of return potential and liquidity profile. Certain private credit strategies offer shorter maturities than many other private investment strategies, and therefore provide greater liquidity with a more income-oriented return profile.
In addition to using the most impactful tools in the asset allocation toolkit, plan sponsors must also ensure that capital is being deployed efficiently; that is, maximizing exposure to growth assets for a given level of risk. De-risking, for instance, need not simply involve exchanging growth assets for fixed income. In a challenging return environment, incorporating low-beta diversifiers or other semi-liquid investments in a plan’s portfolio may be a less risky plan. Liability hedges can also be constructed to maximize “bang for the buck” by using long duration bonds and synthetic fixed income overlays, portfolio tools that are more efficient and allow for additional growth assets to generate returns.
ASSET RETURN LEVER: KEY DECISIONS
- How much illiquidity is realistic for the plan’s investment portfolio?
- Are there opportunities to broaden use of active managers?
- Is capital being deployed efficiently?
Liability Hedge Strategy—Resisting the “Rate Wait”
A pension’s benefit obligation represents an important cash flow commitment over many years. The size of the liability itself may be netted against plan assets for balance sheet purposes, but the interest rate sensitivity of a pension liability remains very real to plan sponsors. In fact, interest rate risk can account for almost half of the expected volatility in a plan’s funded status (Figure 6). Thus, pensions must continually assess the effect of interest rate sensitivity on both sides of the ledger. The discount rate for a plan liability is of course subject to market conditions and impossible to predict or control. What financial executives can control is calibrating the plan’s sensitivity to interest rates.
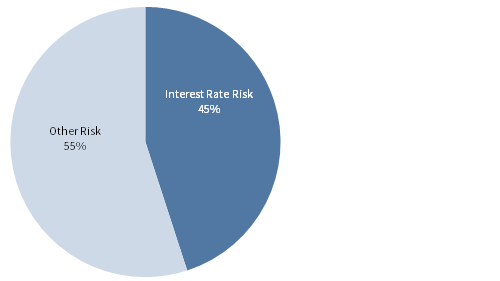
FIGURE 6 CONTRIBUTION TO FUNDED STATUS RISK
Sample 80% funded pension plan with 70/30 equity/long duration allocation
In recent years, liability hedging has been the subject of much discussion in the pension community. At its core, matching the size and duration of a pension liability is a fairly straightforward exercise. The choice of how much to hedge a liability, however, can create dramatic repercussions for the sponsor. Particularly in the current low interest rate environment, a large liability hedging portfolio (“de-risking”) also comes with much lower return, creating the need for higher contributions from the sponsor in the long run.
Some plan sponsors have chosen to stay in a holding pattern when it comes to their liability hedges, keeping hedges intentionally low under the expectation that as interest rates rise, they will provide relief by shrinking the liability. However, if rates take a gradual path upward instead of rising quickly, significant underperformance will be incurred relative to the pension liability. Sponsors that put all their eggs into a “rate wait” basket are making a bold tactical bet on both the timing and magnitude of beneficial discount rate increases. And if recent history is a guide, the bond market reserves the right to defy conventional wisdom.
A deep dive into the “rate wait” dynamic and other elements of liability hedge structuring is beyond the scope of this paper. Most important for financial executives is to continually understand the “cost of carry” of being underweight a long duration liability stream in terms of its yield, and to develop capital efficient and well-calibrated liability hedge structures that optimize how much interest rate risk a plan is intentionally assuming.
LIABILITY HEDGE LEVER: KEY DECISIONS
- How sensitive is the plan to interest rate risk?
- How much interest rate risk should the plan assume?
- Can the pension bear the cost of being underweight a long-duration liability stream?
Contribution Policy—Maximizing Bang for the Buck
Challenging investment returns and extremely low discount rates raise the bar for sponsors when thinking about their policies for infusing money into their plans. While funding minimums are governed by regulations, a sponsor has leeway in terms of the timing and amount of contributions that may be made into a plan above and beyond the minimum required. Contribution policy represents the most direct link between a company’s balance sheet and its defined benefit pension plan, even if the intra–balance sheet flow is initially a zero-sum game. The decision on when to fund and how much to contribute can substantially affect funded status in future years. Given plan contributions are irreversible, sponsors must think carefully about contributions relative to the health and needs of the overall balance sheet.
One of the most important choices in crafting a contribution policy is determining which measure of funded status is most important to monitor. Financial executives may choose to emphasize “GAAP” (accounting-driven) measures of funded status, particularly in situations where shareholder reporting is a chief focus. Conversely, institutions may choose to focus on the liability, as measured by discount rates prescribed by the Internal Revenue Service, including the setting of a minimum required contribution.
As funded status is monitored, a continual tug of war will occur between the carrying cost of the liability (the minimum yield that needs to be earned to offset the plan’s interest cost) and the investment returns of plan assets. To make such analysis more relevant, plan sponsors should develop a contribution budget that aligns with their ultimate goals, as opposed to the artificial smoothing imposed by regulators.
The ability of a company to contribute to its pension plan, unfortunately, does not remain constant. The correlation of capital market returns with a company’s financial health may be high. Periods in which markets perform poorly (creating a need for higher pension contributions) may be the same periods when the company itself faces financial adversity and has less free cash flow to set aside for pension infusions. Therefore, the risk profile of pension assets may be intertwined with the risk profile of the company’s core operations. Another aspect to consider on the “cyclicality” of contribution policy is that when times are good, and a company has more cash to invest in its pension, market valuations may be elevated. Financial executives must monitor the competing forces of ability to fund their pensions versus the attractiveness of deploying cash into higher priced investments.
Low interest rates, while detrimental to plans in terms of pension liabilities, do offer sponsors a valuable advantage—the ability to de-risk plans through thoughtful use of debt. By borrowing to fund contributions to their defined benefit plans, sponsors can achieve multiple goals. These may include reducing ongoing Pension Benefit Guarantee Corporation (PBGC) premiums, lessening future contribution requirements, or potentially undertaking some risk transfers that could further reduce ongoing costs. As an added bonus, the contribution and interest on such loans are tax deductible. Even if use of debt ends up being cost neutral for a given plan, the ability to lessen both cost and liability uncertainty may offer considerable appeal to multiple stakeholders. In evaluating whether to borrow, plan sponsors should of course quantify the degree to which they can take advantage of these benefits in the context of their specific situation, including other outstanding debt, and also evaluate how borrowing fits into their overall plan strategy.
CONTRIBUTION POLICY LEVER: KEY DECISIONS
- Which funded status should be monitored: accounting-based, statutory, or termination?
- How intertwined are the risk profiles of the company’s core operations and pension assets?
- Does borrowing to fund contributions make sense?
Benefit Management—Refining the Obligation
The final key lever plan sponsors can employ is proactively managing policies that govern benefit payouts. Accrued benefits are not adjustable, but benefit payments may be altered for future periods to be more aligned with the current goals and compensation priorities of the company. Opportunities also exist to optimize benefit liabilities relative to plan costs, including the potential cashing out of small balances or terminated vested participants. In more extreme circumstances, financial executives could explore modifying or closing a plan, either partially or fully. For those plans that are hard frozen, sponsors have also been exploring potential risk transfers, offloading pension risk in its entirety to an external provider.
Risk transfer may be a viable option for plan sponsors to consider, but unfortunately is not often the lowest risk or most cost-effective lever for sponsors. Pension risk transfers are frequently large, bespoke transactions with multiple consequences for the company and the plan participants. When exploring such transactions, sponsors must determine their primary objective—e.g., to cut administrative costs, offload a relic of a legacy benefits strategy, or reduce balance sheet risk. In addition, sponsors should be sensitive to potential indirect impacts of a possible risk transfer, such as employee sentiment regarding the transaction, downstream costs associated with the process, and pro forma funded status subsequent to the transfer.
BENEFIT MANAGEMENT LEVER KEY DECISIONS
- Have the current goals and compensation priorities of the company changed sufficiently to
merit modifications to future benefit accruals or payment forms (such as lump sums)? - What are the benefits and costs of a risk transfer?
- How would a risk transfer be perceived by plan participants?
Employing a Balanced Approach to Pension Management
The first step in a balanced approach to managing a pension is for a company to define its top goals, taking into account all of the enterprise’s constituencies (e.g., employees, human resources, finance, and others). This strategy assessment is best left to the company’s executive leadership, as the influence of pension providers, including asset managers, actuaries, and consultants, may cloud the big picture. Once an enterprise has defined its primary goals, the next step is understanding the sensitivity of a plan to asset returns, liability hedging, contribution policy, and benefit management. Reviewing and quantifying the trade-offs to be made within each lever and among levers allows the development of a balanced, multi-lever approach to enable a greater probability of success in managing pension risk.
As we have discussed, the use of one lever to solve all of a pension’s problems is likely not cost effective or practical. Some levers have less uncertainty (contribution policy) but higher explicit costs, while others have far more uncertainty (asset returns and liability hedging) with the potential to be more cost effective. Prudent models and robust scenario tools are necessary to assess the impact of arranging the four levers in different ways to achieve the appropriate “balance” in service of the company’s goals for the pension and in line with its risk tolerance. In an ideal scenario, companies that have solved the puzzle of tying together the four levers can turn their attention to maximizing investment returns within those parameters—minimizing future pension costs to greatest extent possible and mitigating the risks of a pension to the core enterprise.
Index Disclosures
Bloomberg Barclays Long US Corporate Bond Index
The Bloomber Barclays Long US Corporate Bond Index is the long component of the US Corporate Investment Grade Index. The index includes publicly issued US corporate and specified foreign debentures and secured notes that meet the specified maturity, liquidity, and quality requirements. To qualify, bonds must be SEC-registered and an investment-grade credit security.
Cambridge Associates LLC Global Private Equity Index
Cambridge Associates derives its Global Private Equity Index from the financial information contained in its proprietary database of global private equity (buyout, growth equity, private equity energy and mezzanine) funds. As of March 31, 2017, the database comprised 2,471 global private equity funds formed from 1986 to 2016 with a total capitalization of $2.4 trillion. The pooled returns represent the net periodic rates of return calculated on the aggregate of all cash flows and market values as reported to Cambridge Associates by the funds’ general partners in their quarterly and annual audited financial reports. These returns are net of management fees, expenses, and performance fees that take the form of carried interest.
HFRI Fund-Weighted Composite Index
The HFRI Fund-Weighted Composite Index is a global, equal-weighted index of over 2,000 single-manager funds that report to HFR Database. Constituent funds report monthly net of all fees performance in US Dollar and have a minimum of $50 million under management or a 12-month track record of active performance. The HFRI Fund-Weighted Composite Index does not include funds of hedge funds.
MSCI All Country World Index
The MSCI ACWI Index is a free float–adjusted, market capitalization–weighted index designed to measure the equity market performance of developed and emerging markets. As of September 2017, the MSCI ACWI consists of 47 country indexes comprising 23 developed and 24 emerging markets country indexes. The developed markets country indexes included are: Australia, Austria, Belgium, Canada, Denmark, Finland, France, Germany, Hong Kong, Ireland, Israel, Italy, Japan, the Netherlands, New Zealand, Norway, Portugal, Singapore, Spain, Sweden, Switzerland, the United Kingdom, and the United States. The emerging markets country indexes included are: Brazil, Chile, China, Colombia, Czech Republic, Egypt, Greece, Hungary, India, Indonesia, Korea, Malaysia, Mexico, Pakistan, Peru, the Philippines, Poland, Qatar, Russia, South Africa, Taiwan, Thailand, Turkey, and United Arab Emirates.
NCREIF Property Index
The NCREIF Property Index represents the performance of institutionally held, income-producing commercial properties.
Footnotes
- Aggregate funded status and contributions has been estimated by Cambridge Associates based on a compilation of 10-K filings for companies in the S&P 500 Index as of year-end 2016 and year-end 2008, as provided by Bloomberg L.P. These calculations include total pension assets, liabilities, and contributions for a given company, including those for non-US plans and, in some instances, for nonqualified plans sponsored by that company.
- Our return to normal scenario incorporates current valuations and assumes equity valuations revert to fair value over ten years.This scenario makes assumptions about the market environment including mild inflation; moderate real earnings growth; and low corporate default rates, government bond yields, and credit spreads.
About Cambridge Associates
Cambridge Associates is a global investment firm with 50+ years of institutional investing experience. The firm aims to help pension plans, endowments & foundations, healthcare systems, and private clients achieve their investment goals and maximize their impact on the world. Cambridge Associates delivers a range of services, including outsourced CIO, non-discretionary portfolio management, staff extension and alternative asset class mandates. Contact us today.