Policy Benchmarking: Best Practices for Private Investments

Benchmarking is a critical component of a successful investment program; however, measuring private investment performance vexes even the most sophisticated investors.
A number of recent surveys conducted by Cambridge Associates, ILPA, and BNY Mellon found that, on average, about 60% of investors use a public index, just over 30% use a private peer index, and about 10% use something else to represent private investments within their policy benchmark.
The unique characteristics of these investments—the reporting lag, the long lock-up of capital, and the impact of the J curve, among others—make performance measurement and benchmarking difficult. Although investors think about private investment portfolios differently, they tend to review performance from two perspectives: (1) at the total portfolio level, including both liquid and illiquid investments, and (2) at the level of the private portfolio and its sub-components.
In this paper, we address the first perspective. For investors with private allocations, how one incorporates them into the policy benchmark will materially impact the portfolio’s relative performance, making the choice key to informed decision making. We review the various methodologies used and make a series of recommendations on best practices to follow. In considering the performance of private investments within the total portfolio, we anchor to a set of principles: keep it simple, don’t treat private investments differently, and make performance evaluation as meaningful as possible.
Use the Investable Alternative
In the context of evaluating total portfolio performance, the key question investors need to answer is: Was investing in private investments worth it? Most investors agree to lock up capital for long periods of time and deal with the additional administrative burdens because they expect to generate better returns than could be achieved in public markets. In these cases, the capital would otherwise have been invested in the public markets—equities, specifically. Returns generated in the public equity markets represent the opportunity cost of investing in private investments, and therefore a public equity index is the appropriate way to represent private investments in the policy benchmark.
Some argue that investors should use a private investments index within the total portfolio benchmark to account for the private allocation. However, private investment indexes do not represent the opportunity cost and they do not fulfill three widely agreed upon criteria for a benchmark, namely, that a benchmark should be: (1) investable, (2) transparent, and (3) appropriately representative. Although private indexes represent the “asset class” in a generic sense, they are not investable, frequently not transparent, and are not representative of what an investor could have realistically gained exposure to.
Benchmark to a public market index
Furthermore, private indexes are not usually representative of how individual private investment allocations are constructed. For example, a sizable “maturity mismatch” usually exists between an investor’s private allocation and the private index—most indexes contain funds that began investing in the 1980s, and many investors did not consider adding a private investment allocation to their portfolios until the late 1990s or 2000s. In other words, the funds driving the index’s performance are unlikely to have been part of an investor’s own opportunity set.
While private indexes are not an appropriate choice for representing the private allocation in the policy benchmark, they are central to understanding whether an investor selected good managers and made good allocation decisions within the private portfolio. For more on this topic, please see “A Framework for Benchmarking Private Investments,” Cambridge Associates Research Report, 2014, and “Portfolio Benchmarking: Best Practices for Private Investments,” Cambridge Associates Research Report, 2018.
Another issue is that private index returns are often reported by pooling funds (calculated by combining all of the cash flows and valuation changes for all of the underlying funds included in the index to determine the return for a single period), meaning returns are often driven by the largest funds (i.e., those with the largest cash flows), the performance of which can dwarf that of smaller funds in the index. Most investors’ private allocations are not similarly driven by commitments to larger funds, creating another mismatch in using private indexes as a benchmark. Some investors attempt to correct for these differences by applying various customized weighting methodologies to private indexes. However, the introduction of the customizations themselves further weakens alignment with the core benchmark criteria.
What’s the Right Weight?
Typically, the weight of each asset class benchmark within the overall policy benchmark is determined by the policy target to that asset class. For public allocations, overweights or underweights to the policy target can be remedied by increasing or decreasing exposure via the public markets—those weights are controlled by the investor. For private investments, however, an investor has much less control over actual private exposure at a given time. As such, the policy asset allocation targets for private asset classes are typically treated more like goals or guideposts rather than an actual figure to hew closely to on a monthly or quarterly basis. For a nascent private program, reaching the policy target is a long-term endeavor that takes multiple years to achieve; therefore, setting the weight for the private component of the policy benchmark as its policy target introduces issues when trying to gauge relative portfolio performance. For instance, for a newer private program that is only 10% of the portfolio versus its 20% target, the underweight will be an outsized driver of relative out/underperformance versus the policy benchmark until the allocation is much closer to target. This dynamic reduces the efficacy of the policy benchmark as a performance measurement tool since a substantial portion of relative performance will be due to factors outside of the investor’s control (the portfolio’s private exposure at that point in time).
Set the weight of the private component of the policy benchmark to match the actual weight of the private program, and adjust the public equity weight to offset the over/underweight of the private program
To eliminate this distortion, we recommend setting the weight of the private component of the policy benchmark equal to the actual weight of the private program within the total portfolio. In this way, the over/underweight to private investments, which is largely outside of an investor’s control, is eliminated as a factor in relative performance. This method is preferred over setting “interim” policy targets for the private program, since the size of the target and how frequently it is updated is somewhat arbitrary, and repeated changes to the policy targets can be challenging from a governance perspective.
The funding source of the private allocation would see a corresponding increase to its weight in the policy benchmark to compensate for the private investment weight. Using the same index to benchmark the private and the public portfolios eliminates this issue, as both allocations in aggregate would be the same total weight regardless of the share that is private.
Keep it Simple
Choosing a public index doesn’t have to be complicated—it should represent the opportunity cost and benchmark for the source of funding for private investments. If, for example, the MSCI All Country World Index (ACWI) is used to benchmark the global equity allocation, that index should also be used to represent the private allocation within the total portfolio benchmark, because that is the expected source of funding.
For investors that set more granular public equity targets and use a more detailed policy benchmark, appropriate choices should be made for private investments by considering the funding source. For example, if an investor has separate long-term targets for US equities, developed ex US equities, and emerging markets equities, and represents these separately in the policy benchmark, then the appropriate benchmark for private investments would be whichever index represents the allocation that is the source of funds to make the private investment. Choosing a public index that is “most similar” to the private strategy is not always consistent with the foundational principles for benchmarking. Investors that use the Russell 2000® Index, for example, to represent the venture capital allocation within their benchmark need to consider whether that index truly is the funding source for venture capital commitments.
Use a public market index that reflects the funding source/investable public alternative to the private program. Ideally, choose the same benchmark as the public asset class equivalent (e.g., MSCI ACWI for both the public equity and private equity/venture capital allocations)
Considering the funding source becomes even more important for private real assets investments, like private real estate, private energy, and private infrastructure. Private real assets investments can play a variety of roles in a portfolio and will have different funding sources depending on the role. In some cases where a real assets portfolio is intended to generate growth and provide some diversification, the funding source would generally be public real assets and the most appropriate benchmark would be the one used for the public real assets allocation. In other cases, where the allocation to private real assets is meant to generate lower-risk stable income, the funding source would generally be fixed income. However, investors that allocate capital to private real assets with the primary purpose of it serving as a driver of growth within the portfolio, similar to the role of private buyouts, may fund that allocation from equities and thus would benchmark those private real assets against an equity index.
The benchmark for niche private strategies, such as aviation leases and music royalties, also must be carefully considered. These strategies tend to have low correlations to public equities, shorter lock-ups, a current cash flow component, and lower returns compared to traditional private equity. Many investors consider allocations to these strategies as an alternative to fixed income, and thus should benchmark the allocation to the index used for their fixed income allocation. In all these cases, the appropriate benchmark is the one that reflects the intended purpose of the allocation and its funding source.
Use of a public index introduces tracking error. Nonetheless, the expectation of material tracking error does not make a particular index inappropriate or not useful. Investors’ hedge fund allocations typically have substantial tracking error relative to their benchmark, as hedge funds are another challenging area to benchmark. The likelihood of tracking error is important to expect and understand, but should not govern which benchmark is selected for the private allocation, much like it is not a limiting concern for hedge fund benchmark selection.
Don’t Add an Illiquidity Premium
Private investors have been conditioned to expect a premium from their private allocation, and rightfully so! The long lock-up of capital and additional administrative burden should yield returns above those of public equities. Our view is that the private investments allocation should generate at least 300 basis points (bps) of excess return over public equities in the long term. That said, including any such hurdle as part of the total portfolio benchmark is not consistent with the desired properties of a benchmark. Adding a premium mistakes the role of a benchmark for the goal of the private allocation. The premium introduces a non-market force, which is always positive and is not volatile, that distorts comparison. For public equities, the typical goal is for active managers to achieve 50 bps – 150 bps above public indexes and for hedge funds, to generate 200 bps – 300 bps above their respective benchmarks. Yet investors don’t add these premiums to their manager-level or allocation-level benchmarks, much less to the respective component of the total portfolio benchmark. Private investment allocations should not be treated differently from other asset classes. 1
Do not add an illiquidity premium to the public index
What’s the Right Return Metric?
Representing private investment performance in a report detailing the total portfolio’s performance is a challenge. In our view, private investments performance is best evaluated using money-weighted returns, typically internal rates of return (IRRs), rather than time-weighted returns (TWR)s, which are customarily used to report performance for all other types of investments. Nonetheless, the use of TWRs is necessary to incorporate private performance into total portfolio returns and to construct the policy benchmark. For a given quarter, IRRs and TWRs tend to be roughly equal, but they frequently diverge over longer periods of time. Therefore, when breaking out the various components of total portfolio performance for reporting purposes, we recommend removing any reference to private TWRs. Instead, investors should consider creating sub-totals as shown in Figure 1, which demonstrates the “impact” that private investments have had on the total portfolio return, while avoiding reporting TWRs for private investments. Investors should supplement the total portfolio performance report with an exhibit that focuses solely on the private portfolio and that details fund- and strategic group–level performance on an IRR basis.
Match the reporting methodology for the private component of the policy benchmark with the private program itself
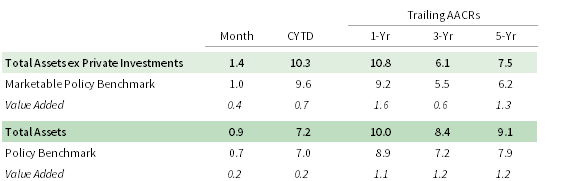
FIGURE 1 IMPACT OF PRIVATE INVESTMENTS ON TOTAL PORTFOLIO RETURN
Source: Cambridge Associates LLC.
How Mature Is the Allocation?
The Lifecycle of a Private Investment: A Long and Winding Road
A unique aspect of private investments is the fund life cycle and the notion of fund maturity or “seasoning.” One aspect of the fund life cycle is often referred to as the “J curve” because as a fund ages the reported returns, when graphed over time, often resemble the shape of the letter “J.” In the early years of a fund’s life the payment of management and other fees, often unaccompanied by significant distributions and/or increases in portfolio company valuation, results in negative returns for the first few years. Once portfolio companies have progressed to the point where managers can distribute proceeds and/or mark up their values, since inception fund-level returns improve materially. Finally, even after a fund has exited the J curve phase, our research indicates that many years can pass before a fund settles into its ultimate performance quartile: on average it takes six to eight years for a fund to settle into its ultimate quartile ranking, and on this journey the vast majority of funds pass through three or four different performance quartiles. See “A Framework for Benchmarking Private Investments” and its recent update “Portfolio Benchmarking: Best Practices for Private Investments” for more detailed explanations of the dynamics of the private fund life cycle.
A complicating factor with benchmarking the private allocation—no matter which benchmark is selected—is how to treat immature private investments, particularly those deep in their J curve.
Given variations in fund development, valuation methodologies, and the J-curve effect, a fund is more than halfway through its typical ten-year life before it can be considered mature and its performance meaningful—in aggregate it should be expected that private allocations may underperform public equities until the private allocation as a whole is considered mature. This not only impacts the private allocation’s relative performance, but it also hampers relative performance at the total portfolio level. While investors can take comfort in the strong historical returns that private investments have generated, living through the J curve takes understanding, patience, and a long-term outlook.
In a worst-case scenario, an investor reviewing performance in the early years of their private investments program may decide to abandon efforts to further build out the allocation due to the negative impact that private investments were having on the overall portfolio. Figure 2 is an example of how a younger program can create a drag on total portfolio performance relative to the policy benchmark. If the investor had been unnerved by this early period of poor returns, or if the key decision-makers were replaced with others who lacked private investment knowledge, any gains linked to the program could be lost to short-termism.
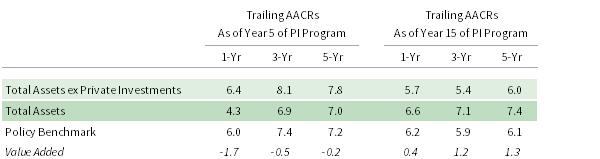
FIGURE 2 IMPACT OF MATURITY OF PRIVATE INVESTMENT ON THE TOTAL PORTFOLIO
Source: Cambridge Associates LLC.
How to Survive on the Road to Maturity
There are three potential means of addressing the issues presented above, two of which add an additional layer of complexity to the benchmarking process. The first is to simply benchmark the private allocation against its public alternative from inception, effectively ignoring the J curve. The second option is to neutralize the performance of the private allocation for a period of time by benchmarking the private allocation against itself until the majority of the program is expected to be mature, and then at that point begin benchmarking the entire private allocation against its public alternative. The third option is to make the neutralization decision on a fund-by-fund basis, i.e., designating which funds should be neutralized and which funds should be benchmarked against a public index based on each fund’s age. For both Option 2 and Option 3, an investor should restate historical performance relative to the benchmark once the portfolio or individual funds are considered mature. Neutralizing solves the optics issue of the J curve, but it is important to restate performance to accurately capture the full opportunity cost. These options are summarized in Figure 3.
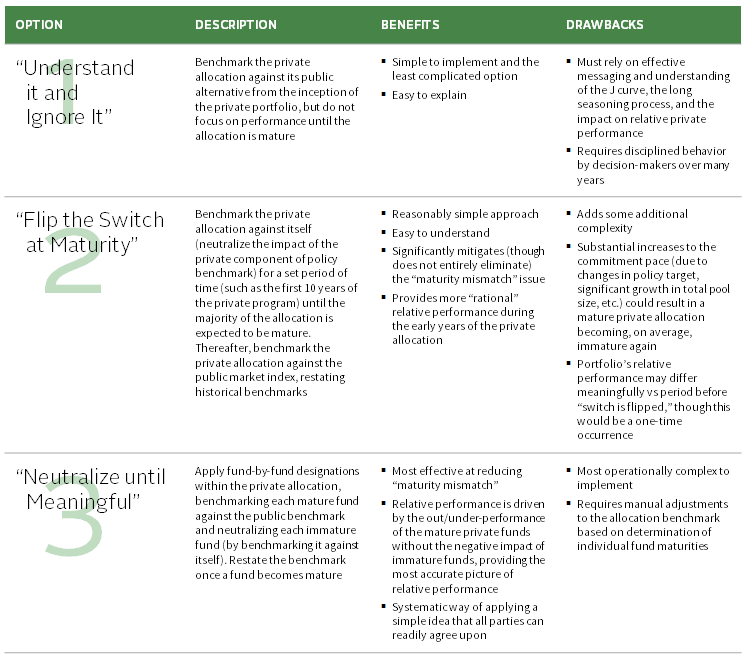
FIGURE 3 OPTIONS FOR ADDRESSING PRIVATE INVESTMENTS MATURITY ISSUES
Source: Cambridge Associates LLC.
Ultimately, the goal is to avoid having ineffective evaluation processes that could cause decision makers to terminate or curtail a private program based on short-term performance. Ignoring the maturity of the portfolio as it ramps up (Option 1) is the most straightforward approach, but, to avoid poor decision making during that time period, investors must understand the potential for there to be a significant drag on early relative performance. Options 2 and 3 help filter out the noise from immature private investment allocations and thus could make the evaluation process more meaningful. Which approach is best depends on the decision-makers’ level of understanding and the investment team’s confidence in their operational capabilities and willingness to expend the necessary effort to neutralize as appropriate. For investors willing to embrace the extra layer of complexity, Option 3 will result in the most accurate picture of relative performance for the allocation versus the benchmark in the early years of the allocation’s development.
Don’t Get Stuck with the Lag
Those responsible for tracking private performance are well aware of the “lag” as private investment managers report valuations one quarter or more after the end of any given performance period. For example, investors typically receive March 31 valuations in June, and they sometimes have to wait until as long as August to receive financials for some investment strategies (e.g., funds-of-funds). This creates a timing mismatch as the most recent valuations available for private investments will be one to two quarters lagged relative to the most recent valuations available for the rest of the portfolio. Investors handle this mismatch in several ways, including estimating private valuations for the current period based on the public market return, lagging the private valuation, or representing the performance of private investments for the current period as a return of 0% and then updating performance once actual valuations are available. These options 2 are summarized in Figure 4.
In most cases, this means using a 0% return for the private component for the most current period
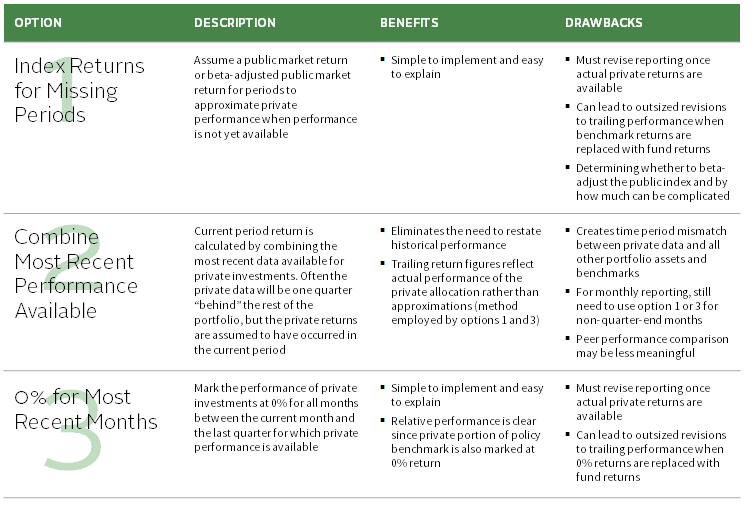
FIGURE 4 OPTIONS FOR ADDRESSING PI VALUATIONS REPORTING LAG
We prefer Option 3—reflecting missing period returns and their corresponding benchmark as a return of zero and then restating the returns when the actual returns become available. Ultimately, however, investors should choose the option that works best for them, ensuring that all decision makers understand the impact of their choice.
Conclusion
The complications presented by the need to represent private investments within the policy benchmark may seem daunting, but it is critical that investors think through these issues and arrive at a solution that is consistent with their approach to portfolio construction and management. We recommend keeping it simple—consider the funding source and don’t treat private investments any differently than you would marketable asset classes. Understanding the impact of policy benchmarking decisions is crucial to facilitate informed decision making.
Footnotes
- It is certainly appropriate and necessary to conduct a more detailed analysis specifically focused on private investments, using the appropriate money-weighted returns and other metrics to measure performance versus the required/expected premium. A description of the recommended analysis is detailed in “Portfolio Benchmarking: Best Practices for Private Investments.”
- Approximately 70% of survey respondents with an allocation to private investments employ Option 3, while 20% use Option 2, and 10% use Option 1 or other methodologies per Cambridge Associates’ Endowment Quarterly for third quarter 2017.
Jill Shaw - Jill Shaw is a Partner for the Endowment & Foundation Practice at Cambridge Associates.
About Cambridge Associates
Cambridge Associates is a global investment firm with 50+ years of institutional investing experience. The firm aims to help pension plans, endowments & foundations, healthcare systems, and private clients achieve their investment goals and maximize their impact on the world. Cambridge Associates delivers a range of services, including outsourced CIO, non-discretionary portfolio management, staff extension and alternative asset class mandates. Contact us today.