VantagePoint: The Bear Awakens


The bear has finally come out of his long hibernation, causing us to dust off our playbook for weathering bear markets. In simple terms, we follow a five-step process:
1. Take a deep breath, stay calm, and accept the uncertainty;
2. Remember that your investment policy is your anchor to windward and has been developed with consideration of bear markets;
3. Stress test portfolios to review sources and uses of cash;
4. Rebalance; and
5. When appropriate, seek opportunities.
In this edition of VantagePoint, we review the circumstances that have abruptly ended the bull market and evaluate the market implications of COVID-19. With that context, we discuss the case for rebalancing and evaluate some early opportunities.
In preview, governments, business leaders, and individuals are putting commerce on hold and disrupting supply chains, accepting the cost of a likely recession to curtail the spread of COVID-19. Markets have made recession-sized adjustments as the United States and Europe begin fighting the spread and China and South Korea re-emerge. We don’t know how long or deep the recession will be, but expect it to be brief, provided measures to contain the spread and policies to address economic disruption are effective. We are preparing for opportunities emerging in credit and real assets, seeking to upgrade to managers that have been hard-closed and now have excess capacity, and getting ready to invest in a US equity put-writing strategy funded from US equities should volatility remain elevated for at least a couple more weeks. Despite the apparent cheapness, we are not attracted to public energy equities. While the energy rout may be overdone, we believe there are better ways to benefit from an eventual economic rebound. Value and small-cap equities are more diversified and looking similarly cheap.
After 11 years and three false starts, the hibernating bear has come out roaring with the sharpest peak-to-trough decline in global equities on record. As of the current trough experienced on March 16, 2020, the MSCI ACWI fell 29% in just 18 trading days from its February 19 peak. Equity markets experienced near misses or short-lived bears in some markets (with a bear defined as a 20%+ decline from peak-to-trough) in 2011 around the European debt crisis and US debt ceiling debacle, in 2015–16 related to the sharp China slowdown and crash in energy markets, and in fourth quarter 2018 as slowing global trade and rising tariffs came face-to-face with tightening US Federal Reserve policy. In all three of these experiences, the seemingly impervious US equity market came close but never quite hit a technical bear market decline of 20%.
This bear market has been more widespread, sudden, and severe. European markets, small caps, and value stocks have been particularly hard hit, especially Eurozone financials and energy stocks. Credit spreads have widened, the commercial paper market has been strained, and liquidity preferences are on display with major gaps between cash markets and more liquid futures, on-the-run and off-the-run US Treasuries, and closed-end funds and ETFs relative to their underlying assets. It remains to be seen how well global central bank activity, including the Fed’s commitment to purchase at least $500 billion in Treasuries and $200 billion in mortgage-backed securities over the coming months and its establishment of a Commercial Paper Funding Facility, will work to alleviate these apparent market strains. Relatedly, coordinated global central bank policy to provide cheaper and longer-term loans through US dollar swap lines offers promise. The recent strength of the US dollar could strain some countries, particularly commodity exporters. Those countries with high levels of external debt relative to GDP and foreign exchange reserves (e.g., Mexico and South Africa) are most vulnerable. Predictably, portfolio flows from these countries by foreign investors have turned sharply negative. Less predictably, China has experienced net inflows for much of this bear market, and its equities have been one of the best performers, while the RMB and Chinese sovereign bonds have remained stable.
Facing Uncertainty
Investors have become conditioned to rely on central banks coming to the rescue when the stock market starts to falter. And, while maintaining liquidity is essential, cheap borrowing rates can only do so much in the current environment (not to mention that policy rates are already at or near zero). The key challenges today are twofold:
• Effectively containing the spread of the virus to prevent strain on healthcare systems that would trigger a broader healthcare emergency; and
• Filling the gaps in cash flow that arise from a temporary shutdown of important parts of the economy to prevent a vicious cycle of constrained supply/demand leading to layoffs, less income, and even less demand.
To alleviate this uncertainty, investors are looking for decisive action on both fronts. These remedies require adequate action from leadership (government at national and local levels and corporations), healthcare providers, and fiscal authorities. They also require accepting a period of economic contraction.
China provides an example of how this strategy may play out. After some struggles in the early weeks, China moved aggressively to place quarantines and prohibit large gatherings of people. These draconian actions have provided swift relief, as the number of confirmed new cases has fallen rapidly. Business activity was hammered, but is beginning to pick up as restrictions are gradually lifted. Reliable high-frequency data are limited, but metrics like air pollution, use of coal, and traffic patterns all suggest that Chinese economic activity is rising. At the same time, the government has announced a battery of policies including debt forbearance, delay of non-performing loan recognition for banks, loans to small- and medium-sized enterprises, and infrastructure spending.
After a rocky start, governments across the globe are starting to follow suit. While coordinated global efforts would arguably be more effective and provide a more calming effect, policy makers and business leaders are starting to act forcefully.
Although lessons from past epidemics and pandemics are of limited use in evaluating prospects for markets and the economy, 1 we can observe that when the daily number of newly identified infections fall, the markets begin to recover. Only then can investors look across the valley to the other side of the temporary disruption and envision a revival in long-term growth prospects. China has reached this point and markets have responded. While it is too early to sound the all-clear—infection rates could spike again in China as restrictions on travel and quarantines are lifted—so far, so good. The United States and Europe are still in the escalation phase of the outbreak, but investors can get a sense of how long the most disruptive part of the pandemic may last by lining up the path of China’s trajectory of new infections with those of other countries. Although the path to containment will vary, China’s experience suggests the United States and France have at least four to six weeks left, while Italy and Iran would see new cases start to decline sooner. However, containment efforts in China were extreme. Absent adequate efforts, infection rates can escalate for longer.
A recent research paper 2 examining the spread of COVID-19 in 29 Chinese provinces uses statistical techniques to model infection paths in Europe, Iran, Italy, Japan, and South Korea. The authors conclude it is highly likely that the outbreak will persist in the coming months, although South Korea is approaching the end. For example, their models suggest the best-case scenario for Italy (the most severe outbreak thus far outside of China) predicts an inflection point will be reached in ten days (March 20), while the pessimistic scenario suggests that point will not be reached until the end of May. Encouragingly, they also find that even countries that are slow to start containment efforts can improve outcomes once they accelerate them.
MAPPING REPORTED NEW INFECTIONS
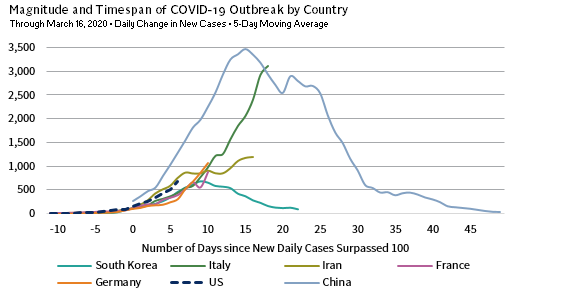
Sources: Johns Hopkins University, Tencent News, and World Health Organization.
Notes: All countries are aligned to the day that the 5-day moving average of new daily cases crossed 100. The five-day average for China excludes the daily change on 12 February 2020, which was the day of Hubei’s COVID-19 diagnosis methodology change. All Italy data are from Johns Hopkins University, except for the most recent day, which is from the World Health Organization. China data are from Tencent News. All other data are from Johns Hopkins University.
No one knows the depth of the economic or earnings impact, but economists and sell-side strategists are cutting economic and earnings growth expectations. China is at the center of global supply chains. Its shuttering of factories has had ripple effects on companies that have the greatest exposure. From a geographic perspective, Asian countries appear most exposed to this channel, while the euro area is also vulnerable. The reduction in Chinese economic activity has dealt a blow to commodities, especially oil. This was further complicated by OPEC+’s failure to reach an agreement on production cuts and the subsequent price war between Russia and Saudi Arabia.
Virus containment efforts will also hit discretionary consumption, which, according to TS Lombard, accounts for roughly 30%–40% of GDP in major economies such as the United States, European Union, and the United Kingdom. Travel, transportation, and lodging industries will be particularly hard hit. Since December 2019, consensus global GDP estimates for 2020 have fallen from 3.1% to 2.5%, with recovery generally expected to begin in the second half of the year. China, which suffered mightily during the first quarter, is expected to begin recovering in the second quarter. Analysts will continue to write down expectations as hard economic data become available. The picture for earnings expectations is similar—consensus estimates for the MSCI ACWI have fallen from 9.8% at the end of 2019 to 8.0% at present. The market appears to be pricing in closer to -10% growth based on the historical relationship between earnings growth expectations and price changes. Prices should fall further if earnings adjustments are more severe, as is often the case during recessions.
EARNINGS GROWTH FORECASTS TEND TO CONVERGE WITH PRICES
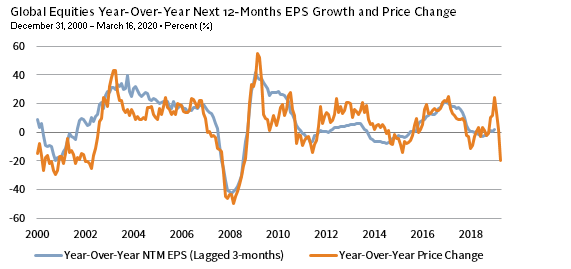
Sources: I/B/E/S, MSCI Inc., and Thomson Reuters Datastream. MSCI data provided “as is” without any express or implied warranties.
Notes: Data are monthly. March 2020 data are as of March 16, 2020.
Following the Bear Market Playbook
Last fall, we published a five-part series entitled Managing Portfolios Through Equity Market Downturns. We emphasized that even as we did not see signs that a recession was probable near term, investors should prepare for the next downturn. We also discussed the importance of stress testing portfolios to evaluate if portfolio liquidity and other cash sources are adequate to support future spending needs and capital calls, of particular relevance today. Periods of stress force investors to think in terms of amounts, rather than percentages, as liabilities often have some fixed cost components. Further, in times of stress, the ability to generate liquidity can decrease as portfolio liquidity dries up and non-portfolio income sources may decline, while demand for spending and other cash needs may increase. Additionally, borrowers might violate debt covenants, and credit ratings could deteriorate during major market declines.
Even investors who regularly stress test their portfolios should re-evaluate whether their assumed stress level is appropriate for this environment (even though economic and markets stress is still unfolding). Only after understanding the ability to meet cash needs should investors move to the next phase of the bear market playbook: rebalancing.
Is It Time to Rebalance?
Rebalancing portfolios is always difficult, especially during bear markets. As discussed in our five-part series on managing portfolios through equity market downturns:
Successful long-term investors are those that, in the event of a major market dislocation, are able to meet their spending requirements, while still keeping strategic portfolio exposures near their policy targets to meet the portfolio’s long-term investment objective. To maintain strategic exposures, investment fiduciaries should delineate a specific rebalancing policy, as well as delegate execution responsibility to a specific subset of stakeholders, be it the investment committee or an execution sub-committee, investment office staff, or their outside investment advisor.
Given this philosophy, we recommend rebalancing portfolios by moving toward policy targets after provisioning for liquidity needs. For investors that need further convincing, consider that the peak-to-trough equity decline in global equities was -29% as of market lows on March 16—the steepest drop seen since the global financial crisis (GFC) and roughly equivalent to the average recession-related bear market decline based on US and UK equity markets for which we have the longest history of performance data. Similarly, the US ten-year Treasury yield has fallen 270 basis points (bps) from its recent peak to its trough on March 9—again, roughly in line with the average recession-related decline. Rates in other major developed markets did not fall as significantly, but they had less room to decline given ultra-low starting points.
WHAT DOES A RECESSION LOOK LIKE?
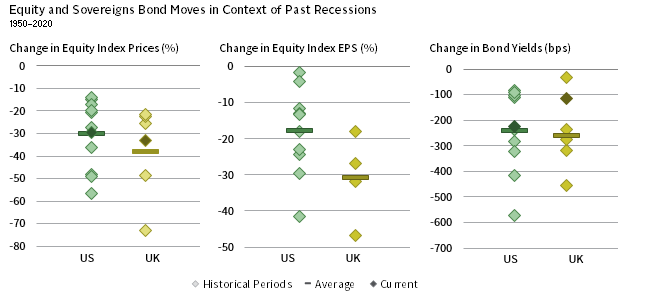
Sources: FTSE International Limited, Global Financial Data, Inc., Standard & Poor’s, and Thomson Reuters Datastream.
Notes: Data for 2020 are as of March 16. The “current” periods for equity index EPS are not shown because earnings data are not yet reflecting the impact from the drop in economic activity related to the COVID-19 outbreak.
From a valuation perspective, sub-1% sovereign bond yields seem far inferior to global equities valued near their historical medians based on cyclically adjusted price-to–cash earnings ratios (CAPCE). Even US equities, which started the year at the 93rd percentile of their historical distribution, now trade at the 59th percentile. While earnings will decline over the next quarter or two, equities offer more appealing long-term prospects than bonds, broadening the benefit of rebalancing to include long-term return enhancement rather than just risk management.
What to Do About Sovereign Bonds?
Investors are particularly concerned over what to do about sovereign bonds. Ultra-low yields offer paltry expected returns and little diversification benefit, assuming the effective lower bound for yields is somewhere near zero. Should investors extend duration to increase sensitivity to falling rates, or take investment-grade credit risk to boost yields and expected returns? We don’t recommend either. If economic weakness proves transitory, as we expect, the ultimate sell-off in the bond market could be sharp and longer duration could bite hard. Also, we certainly can’t rule out a more protracted recession, which would push credit spreads wider.
Investors are understandably looking for better answers. Not only do low yields mean low expected returns over the intermediate to long term, but the ability for bonds to provide protection is limited from a low-yield base. From a ten-year Treasury yield of 0.7%, the one-year nominal return would be 16% if yields fell to -0.84%, the all-time low for the German ten-year bund. There is not much powder left in the keg.
What have we seen in practice? The only live example we have experienced with rates this low was the 2015–16 bear market (which was not a recessionary period). At the Europe ex UK equity market peak in April 2015, bund yields were already sitting at just 0.16%, and as equities lost more than a quarter of their value over the next 10 months, bunds eked out a return of just 1.8%. Investment-grade credits weren’t much help either, returning -2%. There are no simple answers. We recommend maintaining policy allocations to high-quality sovereign bonds at neutral duration.
Getting Opportunistic
Markets have gone through significant adjustments over recent weeks. Some liquidity- motivated selling has been indiscriminate, and we are keenly monitoring market developments. During this bear market, volatility and oil have seen the sharpest price moves. As such, we evaluate potential opportunities in selling volatility through collateralized put-selling and public energy equities.
Positive on US Equity Put Writing
One opportunity we may soon recommend is an overweight to a US equity put-writing strategy, funded from US equities. This position seeks to capitalize on the volatility risk premium, or the compensation that investors earn for providing protection against market volatility. At first glance, providing protection against market volatility sounds like a rough business to be in during an equity bear market. But, systematically writing near-dated US equity puts on an index regularly experiences less severe drawdowns than the option’s underlying index.
A key reason for this reality is the behavioral bias against losses, which manifests in an overestimation of downside risk. An easy way to see this overestimation is to compare the expected short-term volatility implied by options prices (implied volatility) relative to the volatility that actually transpires over the same period (realized volatility). Using data since 1990, we find that option prices bake in short-term volatility of 19.1% on average, which has turned out to be 4.4 percentage points (ppts) too high. The divergence has been consistent, with expected volatility higher than realized for nearly 90% of observations across the three decades. 3
As volatility increases in markets, investors overestimate downside risk to a greater extent. In fact, by dividing the same dataset into four buckets based on the level of implied volatility, there is a clear pattern. In those periods when expected future volatility was low—the bottom quartile of all observations—the difference between implied volatility and realized volatility has averaged 3.0 ppts. For those periods when expected volatility was high, the difference averaged 5.8 ppts. These differences are reflected in the position’s relative returns.
Over the long term, both a US equity put-writing strategy and US equities have had similar levels of return, but the former has been far less volatile than the latter. To increase our chances of making this position profitable, we need to understand whether markets have firmly moved into a high-volatility environment, which should benefit put writers given historical patterns. Market volatility has tended to exhibit regime-like behavior, in which periods of time are dominated by high volatility or low volatility. Considering recent market action, evidence is piling up that we are in a new regime.
Investors Tend to Overestimate Downside Risks
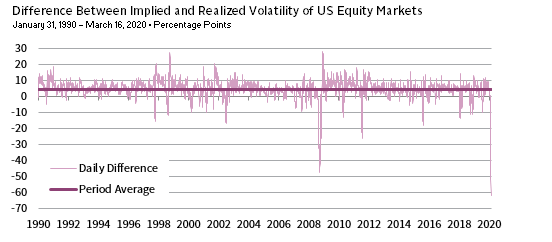
Sources: CBOE, Standard & Poor’s, and Thomson Reuters Datastream.
Notes: Implied volatility is represented by the VIX and realized volatility by the S&P 500. Implied volatility data are lagged by 22 days and compared to the 22-day annualized standard deviations of S&P 500 price returns.
Unenthusiastic on Public Energy
One opportunity that we are unlikely to lean into is public energy. More than a week ago, Saudi Arabia stunned oil markets by both cutting its oil prices and announcing its intent to rapidly boost output, following the collapse of a Russia-OPEC arrangement to prop up oil prices by restricting production. This came at a terrible time for oil markets; they were already weak, with the virus undercutting global demand. These twin oil supply/demand challenges appear set to limit public energy equity performance for some time, particularly relative to other risk assets.
To be sure, shares of energy firms are priced very cheaply, at least when you compare present valuations to historical levels. As of March 16, energy equities traded at just 3.0 times cyclically adjusted cash earnings. That multiple, which normalizes cash earnings to account for cyclical imbalances, is the lowest we’ve observed since data began in 2004. In addition, that pricing is just 29% of the same multiple for its parent benchmark, the MSCI World Index, which is the lowest discount that any developed markets sector has traded at historically.
Still, we suspect energy is cheaply priced for good reason. Many US producers—which tend to have meaningful weights in energy portfolios—will struggle to generate sufficient cash flows to cover operating costs and planned development at current oil price levels. This is despite many hedging 40% to 60% of their 2020 production prior to the oil market downturn. As a result, many producers will have to cut planned growth projects and sell non-core assets in a heavily saturated market. A complicating factor is that the reserve-based loan facilities that many US producers rely on will likely come under pressure in April as banks revisit their terms.
That said, our view on energy isn’t that it is doomed. We suspect that the pessimism built into prices at present may be a bit much. But, markets are likely to be awash in oil for quite some time, and given the negative investor sentiment linked to environmental, social, and governance concerns, we lack confidence that energy will outperform other risks assets in a market recovery. Instead, we believe there will be better ways to position as virus fears dissipate. Two areas we’re exploring—value and small-cap equities—are more diversified and looking similarly cheap. Potentially more to come on those topics…
We’ve Made Our Short List
We are monitoring a range of other opportunities and will share investment ideas as they develop. High-yield bonds are just starting to get interesting. Much of the spread widening so far has been related to the energy sector, where 1,924 bp spreads are the highest on record based on their post-2000 history, while spreads excluding the energy sector remain around 700 bps. Still, we expect credit trading opportunities will develop in the near term, while distressed-for-control opportunities will build if a recession persists longer than the consensus expects. If you haven’t done so already, now is a good time to identify credit and distressed managers capable of generating outsized returns as the cycle progresses.
Both real estate and infrastructure equity and credit strategies provide beneficial diversification and income properties and are available in open-ended fund structures that provide some liquidity (but can gate assets during stressed periods). These investments tend to get beaten up during recessions, offering attractive value opportunities that rebound sharply during recoveries. We expect some real estate and infrastructure strategies will become attractive on a valuation basis and believe that adding real assets will help investors diversify and generate income, though it is still too early to say which sub-strategies will be best positioned. As markets begin to stabilize, we will provide more insight into strategies to focus on and strategies to avoid.
Such investments offer another potential secondary benefit. Today, policymakers are faced with battling deflationary risks at the cusp of a recession. Yet, the policy combatting this recession could eventually set up conditions favoring a sustained period of elevated inflation if fiscal policy—aided by debt monetization—is overused. In addition, with corporations experiencing disruptions in supply chains in China and elsewhere, they are likely to recognize the value of diversifying suppliers and/or moving production closer to end markets. Such moves are inflationary in nature because by doing so they give up some economies of scale and the ability to use their lowest-cost production. Whether they result in a one-time step up in costs or more persistent increases remains to be seen. At attractive purchase prices, such investments would deliver competitive returns, diversification, and income benefits even without meaningfully higher inflation.
Finally, sell-offs also create an opportunity to upgrade manager rosters. If you have not already done so, develop a short list of managers across asset classes that have been hard closed and reach out to them regarding your interest in gaining access.
Concluding Thoughts
Bear markets are difficult to navigate, so take a deep breath, stick to your playbook, make sure you have adequate sources of cash to meet your obligations, and rebalance. Opportunities are beginning to unfold, and we will continue to share our views on what we regard as attractive over the course of the bear market.
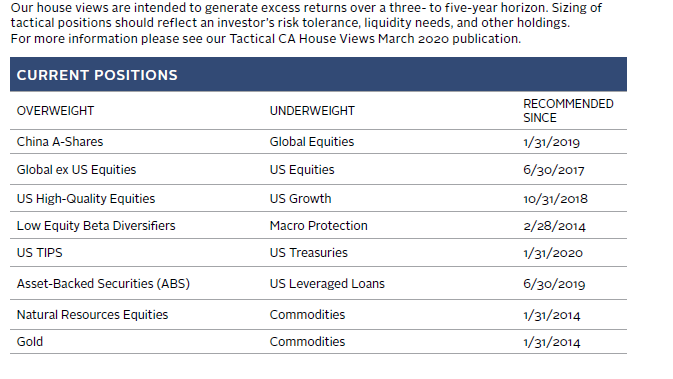
OVERVIEW OF TACTICAL CA HOUSE VIEWS
February 29, 2020
Index Disclosures
CBOE Volatility Index
The CBOE VIX Index represents one measure of the market’s expectation of stock market volatility over the next 30-day period. The VIX is quoted in percentage points and translates, roughly, to the expected movement in the S&P 500 Index over the next 30-day period, which is then annualized.
S&P 500 Index
The S&P 500 Index gauges large-cap US equities. The index includes 500 leading companies and captures approximately 80% coverage of available market capitalization.
Footnotes
- Past epidemics provide limited guidance due to a variety of factors, including the coincidence of such outbreaks with various other events (e.g., Spanish Flu came at the end of WWI and SARS occurred during the 2002–03 downturn), China’s more central role in the global economy, and shifts in China’s economic growth drivers from exports and industrial production to services, as well as continued advancement in medical treatments and diagnostics.
- Please see, Ke Wu, et al., “Generalized logistic growth modeling of the COVID-19 outbreak in 29 provinces in China and in the rest of the world,” Cornell University, March 12, 2020.
- Analysis relies on daily data from the CBOE Volatility Index, CBOE PutWrite Index, and S&P 500 price index. The earliest common data between the two indexes for which quality data exists is January 1990. VIX data, which is lagged by 22 days, is compared to 22-day annualized standard deviations of S&P 500 price returns. The Put Write Index is designed to sell a sequence of one-month, at-the-money, S&P 500 Index puts and invest cash at one- and three-month Treasury Bill rates. For more information about this index, please see www.cboe.com/PUT.
Kevin Rosenbaum, CFA, CAIA - Kevin Rosenbaum is Head of Global Capital Markets Research and Investment Communications at Cambridge Associates.
Celia Dallas - Celia Dallas is the Chief Investment Strategist and a Partner at Cambridge Associates.
About Cambridge Associates
Cambridge Associates is a global investment firm with 50+ years of institutional investing experience. The firm aims to help pension plans, endowments & foundations, healthcare systems, and private clients achieve their investment goals and maximize their impact on the world. Cambridge Associates delivers a range of services, including outsourced CIO, non-discretionary portfolio management, staff extension and alternative asset class mandates. Contact us today.