VantagePoint: Reflation, Inflation, or More of the Same?


Policymakers’ responses to the pandemic have given Monetarists and Keynesians alike reason to be concerned about inflation. Monetarists fret over the massive increase in the money supply and worry that the end of the pandemic could unleash a surge in the circulation of money (i.e., velocity) sparking inflation. Keynesians are worried that the aggressive fiscal policy response, particularly in the United States, combined with the economic rebound already underway may overstimulate demand relative to available supply.
In this edition of VantagePoint, we review the drivers of inflation globally and conclude that widespread inflation concerns are likely overdone. We think it is unlikely developed markets inflation will rise beyond 3% for a sustained period over the next year or two. However, a sharp, transitory spike may occur in the coming months, as current price levels are compared to depressed levels last year and as a burst in economic activity amid rising vaccination rates meets with pockets of supply bottlenecks. Longer term, the most likely path is for more of the same—a muddle-through environment of modest growth and low inflation. High inflation (e.g., 5%+) remains a tail risk, but is more likely than has been the case in more than 30 years. Policy shifts and secular forces now allow for a wider range of potential outcomes.
Investors should avoid excessive opportunity costs by over-allocating to assets that might protect against inflation. However, investors should maintain well-constructed, diversified portfolios informed by scenario analyses and associated liabilities to understand implications for different inflation outcomes. For investors concerned about the risks of inflation, we refresh our analysis on the complex relationship between asset classes and inflation and dig deeper into the implications of higher inflation on equities.
Money Supply Has Spiked, but Where’s the Inflation?
Milton Freidman famously quipped, “Inflation is always and everywhere a monetary phenomenon.” Money supply, notably “high-powered money,” has rapidly increased, yet inflation has remained tame. An increase in money supply will not spur inflation if it primarily consists of reserves that remain in the banking system, as it does today. Inflation transpires when reserves beyond those needed to meet regulatory requirements are loaned out. In other words, as money supply has been increasing, velocity of money has been decreasing. These two factors offset each other, keeping prices stable. 1
THE INCREASE IN MONEY SUPPLY HAS NOT BEEN INFLATIONARY BECAUSE VELOCITY HAS FALLEN
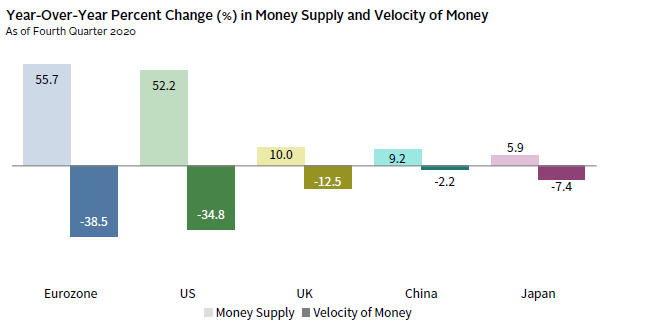
Sources: IMF – International Financial Statistics and Thomson Reuters Datastream.
Notes: Money supply is represented by the “monetary base” (also known as M0), the sum of currency in circulation and reserve balances (deposits held by banks and other depository institutions at central banks). All data are from national sources except for Eurozone, which is based on IMF – International Financial Statistics data.
When central banks purchase assets, such as sovereign bonds, they use banks as intermediaries, buying bonds from the banks and crediting bank reserve balances electronically. Central banks can only grow their assets (sovereign bonds) if liabilities (bank reserves) grow along with their holdings. Central banks hold onto the increase in liabilities by paying interest on excess reserves. 2 Central banks set this rate where they want their policy rates to be. Holding all these reserves on deposit does, however, constrain bank lending and subsequently, the velocity of money and inflation. 3
As central banks acquire assets, their share of markets owned, and bank assets held has increased. For example, the US Federal Reserve presently holds 30% of outstanding US Treasury debt (up from about 15% before the pandemic), paid for with reserves equal to 16% of commercial bank assets (10 percentage points [ppts] more than its pre-COVID-19 share). There must be a limit to how high these holdings can go. As we saw in the United States in 2018, unwinding central bank balance sheets will be difficult, because doing so puts upward pressure on rates that, if sustained, would ultimately increase interest expenses. In other words, efforts to fight inflation could ultimately tighten financial conditions and depress economic growth.
What Do You Get When Pent Up Demand Meets Strong Fiscal Stimulus?
From a Keynesian perspective, the inflation risks lie in the potential for a sharp economic recovery to quickly absorb excess capacity. Indeed, the IMF now expects 6% global GDP growth this year and 4.4% next year, driven by the lifting of lockdown measures, increase in vaccinations, and supportive policy, although conditions vary significantly across the globe. With strong fiscal stimulus putting substantial income into households’ coffers, consumers should increase spending meaningfully, which may push demand beyond available supply, fanning inflationary pressures. However, it is quite difficult to understand the degree to which stimulus may be too excessive because the output gap is subject to significant estimation error. In a pandemic, these estimations are especially challenging since both supply/demand have been affected.
A Services Spending Spree
Globally, fiscal spending has been significant, with roughly half of approved G20 fiscal stimulus put into place in 2020–21 yet to be spent. However, there is considerable dispersion across the globe, with the United States on the high end and continuing to spend, while China is not engaging in new stimulus. Such generous fiscal policy, along with the typical recessionary concerns related to job security, have resulted in an extraordinary buildup of excess savings over the last year.
PENT-UP DEMAND WILL BOOST SPENDING AS ECONOMIC ACTIVITY NORMALIZES
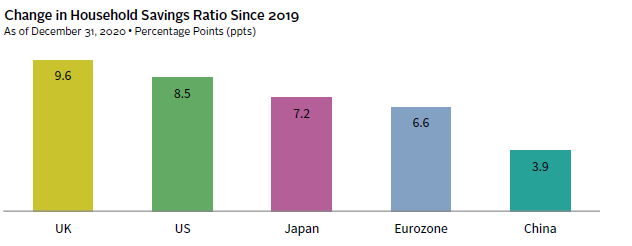
Sources: Oxford Economics and Thomson Reuters Datastream.
Much of this income will be spent rapidly as consumers become more able and willing to travel and consume services that require contact with others. However, the spending spree may not be as significant as many anticipate, since high income households that have accrued the lion’s share of excess savings are less likely to spend incremental savings than are low income households. For example, TS Lombard estimates that during the first three quarters of 2020, the wealthiest 20% of US households held 75% of the increase in financial assets and two-thirds of the increase in liquid assets. Similar trends have been documented in other regions. Overall, we expect a positive shock to spending, while recognizing that much of this liquidity may find its way instead into longer-term assets like equities and home purchases.
As spending on services increases, employment should increase as well, as much unemployment globally has been concentrated in lower-paying service sector jobs. This has two consequences regarding inflation. First, price pressure in services is likely to increase, at least temporarily, amid a sharp increase in demand. Second, unemployment rates may fall rapidly as service companies seek to rehire employees. Since these employees are the low-paid workers who suffered disproportionately during the pandemic, central banks may see their more inclusive employment objectives met quickly and move to tighten sooner than they currently expect.
A “High-Pressure” Economy
Following the disappointingly slow economic recovery from the GFC, an increasing number of economists have advocated running a high-pressure economy; a strategy that requires sustained easy monetary and fiscal policy to push economies above full capacity. This idea has gained traction based on the view that recessions have the potential to result in “permanent scarring” that leaves economic potential lower than it was in prior business cycles.
EXCESS CAPACITY IS ESTIMATED TO BE SUSTAINED FOR SEVERAL YEARS

Source: IMF World Economic Outlook, April 2021.
While difficult to measure, the IMF’s estimates indicate that meaningful economic slack is expected to persist throughout 2022–23 for much of the world. In contrast, the United States is estimated to run above potential next year, which leaves the country poised to possibly be the first among major economies to experiment with this strategy. 4 Elected politicians are likely to continue to pursue fiscal policy stimulus to the degree politics will allow, as many voters in most advanced economies have felt left behind. However, central banks’ commitment to running a high-pressure economy is less clear. While the Fed is emphasizing a flexible average inflation target to allow the economy to run a bit hotter than its 2% target for a period of time, and has committed to maintain an accommodative status until actual (not expected) economic data reflect broad-based employment improvement, the degree and length of time over which they will run hot are unclear.
FISCAL SUPPORT HAS BEEN ACCOMMODATIVE WITH THE US IN THE LEAD
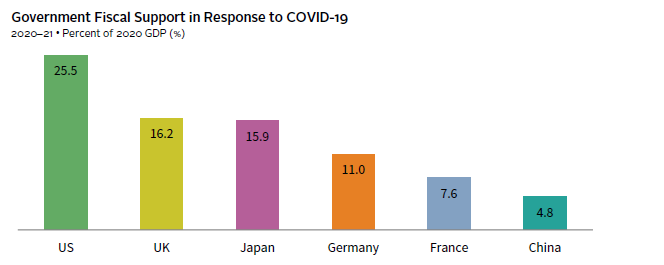
Source: IMF Fiscal Monitor, April 2021.
Note: Fiscal support is additional general government spending and foregone revenue from 2020–21, and excludes loans, equities, and guarantees.
Some analysts believe that the Fed is explicitly financing the expansion in US debt by buying US Treasuries. While the central bank is currently supporting the debt expansion, this is indirect and is happening at a time when the central bank’s mandate requires it maintain easy policy. However, the Fed maintains its independence and there will come a time when the Fed considers conditions to no longer support a bloated balance sheet. Should fiscal spending require debt financing, the Fed should not be expected to be a ready buyer, unless and until economic conditions justify such activity.
In sum, it is by no means certain that countries will run a high-pressure economy and even if they do, it may not lead to a revival in economic growth or higher inflation. What is clear is that to the degree that policymakers keep their foot on the gas for longer than typical, the distribution of potential economic growth and inflation prospects widens and skews to the upside.
Secular Forces Have Put a Lid on Inflation
To evaluate prospects for inflation, investors must also understand why inflation has been absent in recent decades, even in the face of expansive monetary and fiscal policy. Increasing globalization, aging demographics, technological advances, and high-debt levels have contributed to the disinflationary environment. Some of these trends are slowing or reversing and may allow inflation pressures to increase over time. Below we briefly discuss two key secular forces that have been shifting—globalization and demographics—along with debt, which has accelerated in importance with the response to the pandemic.
Globalization, Demographics, and the Rise of China
The most significant disinflationary shock since WWII has been globalization, particularly as it relates to the expansion of the global workforce. In the 1990s, China, India, and the ex-Soviet bloc integrated into the world economy, effectively doubling the global labor pool from 1.5 billion to 2.9 billion workers overnight. During recent years, the globalization trend has leveled off, with global trade at around 60% of global GDP. One reason for the stabilization is the convergence of labor costs—Chinese wages are now 20% of US wages, up from 3% in 2000. According to McKinsey, labor cost arbitrage motivates only 18% of traded goods, with the other 82% related to access to skilled labor and natural resources, proximity to customers, and quality of infrastructure. In addition, the COVID-19 pandemic has raised awareness of the perils of just-in-time manufacturing and a highly optimized supply chain. To the degree that manufacturers build in redundancies and “just-in-case” production into their supply chains, costs will rise, hitting profits and/or consumer prices.
THE LONG GLOBALIZATION TREND HAS STALLED AND MAY REVERSE

Source: World Bank.
At the same time, there have been significant shifts in dependency ratios, or the share of the young and elderly relative to the working-age population (aged 15–64). As the baby boom generation began entering the labor force in the late 1960s, the dependency ratio had fallen, bottoming globally in 2015. This trend has reversed across advanced, and some developing economies.
While the demographics are clear, the implications for inflation are not. Economists are engaged in considerable debate on this topic. 5 Some believe that an increasing ratio of consumers (dependents) to producers (workers), as proxied by dependency ratios, should mean higher price levels. 6 However, much depends on spending and savings patterns over the life cycle, the ability to improve labor participation rates, and productivity.
In short, the adjustment to a global labor supply has largely played out at the same time that demographics are slowing growth of the labor pool and backlash against industry concentration (and hence employers) that has reduced labor’s negotiating power have potential to shift the balance of power in favor of labor. Further, increased longevity and decreased fertility rates will increase medical costs and pension payout requirements pressuring government finances.
The Heavy Weight of Debt
Rising debt levels have been a deflationary force in recent decades. Between 2019 and 2020, global sovereign debt-to-GDP has advanced 17 ppts to 105%, with more fiscal spending this year. High debt makes governments vulnerable to an increase in yields that may be needed to attract buyers, especially if fiscal spending continues. Low interest rates have held down interest expenses, even as debt has increased, but should interest rates rise above the rate of economic growth, government finances will be challenged. Governments have three main means for reducing debt to GDP ratios: practice austerity, increase GDP growth, or inflate the debt away.
FALLING INTEREST RATES HAVE IMPROVED DEBT AFFORDABILITY BUT ARE NOW A VULNERABILITY
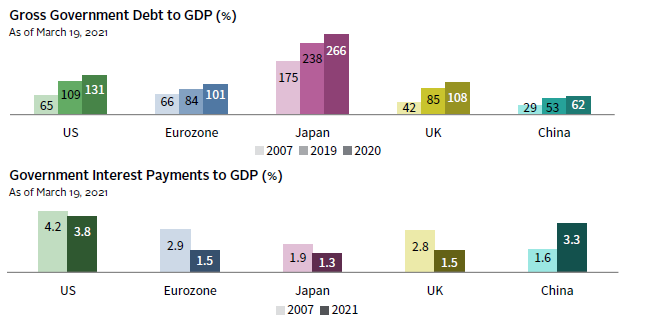
Sources: Oxford Economics and Thomson Reuters Datastream.
Notes: Government Interest Payments to GDP (%) for Eurozone represents aggregate data of 12 countries: Austria, Belgium, Finland, France, Germany, Greece, Ireland, Italy, Netherlands, Portugal, Slovakia, and Spain. Data for 2021 are forecast.
Bringing down debt levels through austerity will be challenging, especially given rising costs associated with an aging population, climate change, and populist political pressures. Increasing growth is obviously the most desirable path. With slowing workforce growth across most of the globe, higher economic growth will require a pick-up in productivity, which in turn requires an increase in investment that has been lacking since the GFC. However, most investment spending in recent years has been on technology that requires less capital outlay than the property, plant, and equipment investments that historically have been necessary. The pandemic also accelerated the deployment of new technologies by the private sector into a wider range of businesses and industries, which could also help lift economic growth. Further, while government spending (and ultra-low rates) can result in capital misallocation, if it is done well, such spending could improve productivity and boost growth. Higher GDP growth is possible, however higher inflation may well be part of the solution.
Inflation Prognosis?
Inflation will almost certainly increase in the coming months, but these inflationary forces should be short lived. We think it is unlikely developed markets inflation will rise beyond 3% for a sustained period over the next year or two. Should policy makers sustain easy monetary and fiscal policy and run a high-pressure economy, the range of potential inflation outcomes will be wider than has been the case in decades. At the same time, some of the most powerful secular deflationary forces are fading. The main check against very high inflation taking root longer term is that major central banks are unlikely to relinquish their independence and allow inflation to increase beyond 3% for very long. Finally, the challenges associated with normalizing policy rates could be disinflationary, or at the very least, disruptive.
As a result, a more-of-the-same, muddle-through environment remains the most likely case once the pandemic-fueled fiscal policy runs its course over the next couple of years. High inflation (i.e., 5%+) is a tail risk, but with a slightly higher probability than has been the case in decades. Prospects for improvement in global GDP growth relative to trend is also a relatively low but elevated relative to recent decades.
Investment Considerations
Predicting the future path of inflation is notoriously difficult, making the best protection a well-constructed diversified portfolio designed to meet the asset owner’s risk tolerance, portfolio objectives, and spending needs. Protecting against macro risks, both unexpected inflation or deflation, requires accepting lower returns. Investors must carefully consider the role of the long-term investment pool and the degree to which such protection is necessary to meet investment goals and objectives. To make such assessments, investors should use robust scenario analyses on portfolios and associated liabilities to understand implications for different inflation outcomes.
The relationship between asset classes and inflation is complicated. To provide a better sense of the risk to various investments during rapid changes in the pace of inflation and over longer periods of elevated inflation, we update an analysis we undertook in 2020 using nearly 50 years of data across ten asset classes for which we have a full history of data. We also take a deeper dive into consequences of rising inflation for equities, given high portfolio exposures and their somewhat surprising resilience over long-time horizons.
Reviewing the Complex Relationship of Assets and Inflation
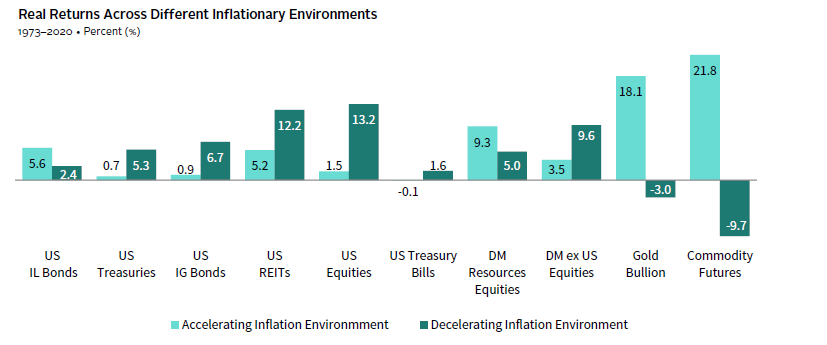
When comparing performance of asset classes during periods of high and rising inflation, we find that protecting against short bursts of inflation is quite different than preserving real values over the longer term. During short periods of accelerating inflation, commodity futures and gold have been the best performers. Unfortunately, they also lost a lot of ground when inflation was decelerating and experienced the worst performance (absolute and risk adjusted) other than cash over the full period. Further, the pattern of performance was not stable, with the strongest relationship to inflation persisting during the first half of the period (1973–96), when inflation was high and volatile.
In contrast, natural resources equities had a more meaningful relationship with inflation in the second half of the period reviewed; likely a function of the declining power of OPEC that enabled energy prices, and thus energy equities, to have a closer relationship with inflation.
REAL ASSETS CAN BE BENEFICIAL DURING ACCELERATING INFLATION, BUT THERE IS A COST
Sources: Bloomberg Index Services Limited, FTSE International Limited, London Bullion Market Association, MSCI Inc., National Association of Real Estate Investment Trusts, Standard & Poor’s, Thomson Reuters Datastream, and US Bureau of Labor Statistics. MSCI data provided “as is” without any express or implied warranties.
Notes: An accelerating (decelerating) inflation environment is when the annual change in the inflation rate is positive (negative). Returns are adjusted by inflation and arithmetic averages across environments.
We anticipate that the relationship between inflation and carbon-based commodity futures and natural resources equities will continue to evolve with the changing energy landscape. Over time, the contribution of energy price changes to future inflation levels will be less dependent on oil prices and more reliant on renewable energy sources. Commodity futures and natural resources strategies that account for these dynamics may be positioned to offer stronger returns but may do so with potentially less inflation sensitivity. A new crop of commodity-related products that account for climate change transition and adaptation considerations have recently been launched and more are in development. Such strategies may also incorporate newer futures contracts, such as water and regulated carbon markets aimed at reducing the carbon emissions, that may materially alter the characteristics of the investments. We are watching these developments with great interest.
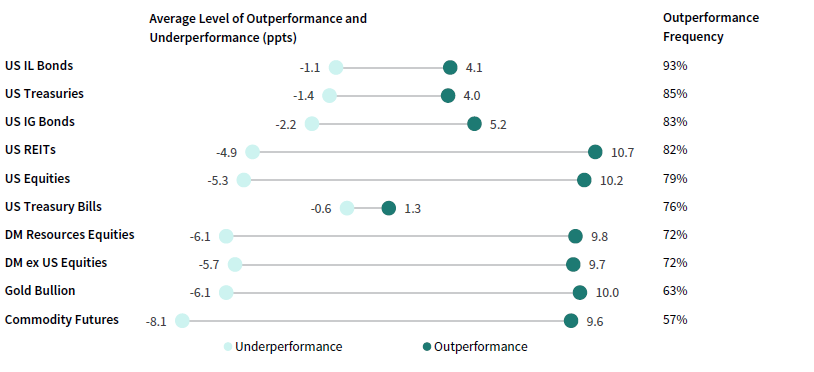
To evaluate the utility of this range of asset classes over a longer, five-year horizon, we used a random sampling of five individual years of data from our original 48-year dataset and compared asset performances over the full five-year period to inflation. While this approach has its weaknesses—including the assumption that future return patterns will resemble prior return patterns—it gives us one lens to view the probability of an asset class outperforming inflation over a long-time horizon.
EQUITIES HAVE KEPT UP WITH INFLATION OVER LONGER PERIODS
1973–2020 • Relative to Inflation Over 5-Yr Period
Sources: Bloomberg Index Services Limited, FTSE International Limited, London Bullion Market Association, MSCI Inc., National Association of Real Estate Investment Trusts, Standard & Poor’s, Thomson Reuters Datastream, and US Bureau of Labor Statistics. MSCI data provided “as is” without any express or implied warranties.
Notes: Data summarizes 1,000 random samples of five years of annual data between 1973 to 2020. Each sample compares the total asset performance over the five-year period to how much price levels change. The average level of outperformance is cumulative across the full five-year period.
The results are somewhat surprising. As expected, inflation-linked bonds outperformed inflation in 94% of the 1,000 samples, with the degree of outperformance unlikely to be repeated in the current negative real yield environment. The other fixed income assets also kept up with inflation with relatively high frequency, but like inflation-linked bonds, past may not be prologue given today’s ultra-low yields. Equities, somewhat surprisingly, kept up with inflation at least 72% of the time and did so with a high degree of outperformance. Commodity futures and gold were the least consistent performers, with the former underperforming inflation 43% of the time by an average of 8.1 ppts.
A Closer Look at Equities
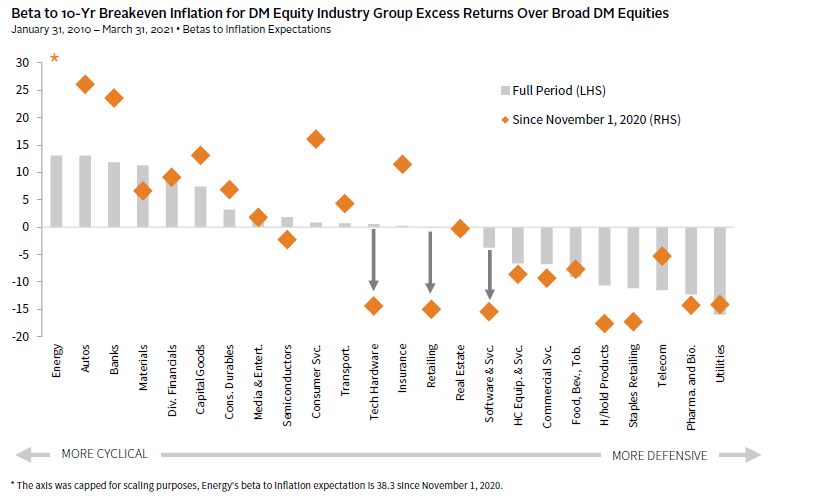
Cyclicals—such as energy, materials, and banks—typically outperform in rising inflation environments, to the detriment of defensives and bond proxies; however, the relationship between rising inflation and technology companies has been inconsistent.
TECH HAS BEEN MORE VULNERABLE THAN USUAL TO RISING INFLATION EXPECTATIONS
Sources: FactSet Research Systems, MSCI Inc., and Thomson Reuters Datastream. MSCI data provided “as is” without any express or implied warranties.
Notes: Data are the slope (beta) of trailing 12-month excess total returns (MSCI World Index industry groups relative to MSCI World Index returns) versus trailing 12-month changes in ten-year breakeven inflation (BEI). BEI data are the weighted average of ten-year BEI for Australia, France, Germany, Japan, UK, and US, weighted based on MSCI World Index market values. “Full Period” data are based on a monthly frequency and “Since November 1, 2020” data are based on a daily frequency. Total returns are gross of dividend withholding taxes and are in local currency terms.
Much of the dispersion in performance across industries may be linked to changes in earnings estimates. Analysts have upgraded next 12-month (NTM) earnings forecasts for cyclical industries at a much higher rate than the broader market. For instance, since November, year-over-year NTM EPS growth for energy, materials, and banks has improved by 63 ppts, 36 ppts, and 19 ppts, respectively, compared to just 13 ppts for the broad market.
Historically, share prices for technology companies have not been sensitive to rising inflation expectations. Over the long term, earnings upgrades for tech have generally kept pace with the broad market in cyclical upswings, as was the case coming out of the 2007–09 recession. However, tech stocks have struggled since November 2020 as rates started to climb. There are several reasons for this contrast. First, COVID-19–related restrictions initially led to an unprecedented increase in earnings for technology-related companies; however, a re-opening of the economy is likely to weigh on demand for tech-related products, which has caused tech-earnings expectations to fade. Second, even as earnings showed strength during the pandemic, valuations escalated, making tech stocks more vulnerable to rising rates. Third, tech stocks are more defensive/less cyclical today, and defensive stocks typically perform poorly in cyclical upswings.
If inflation continues to rise on economic optimism, it is likely that equities markets will go along for the ride and the rotation into cyclicals will continue. As illustrated by the Gordon Growth Model, when the discount rate (r) rises faster than the growth rate (g), then the intrinsic value of a stock (P) will decline. 7
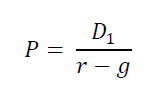
Applying this concept to earnings, if earnings growth increases at the same pace as the discount rate, then the intrinsic value of a stock will remain stable. Should inflation increase faster-than-expected, pushing up the discount rate, companies that are able to increase earnings in such an environment, like cyclicals and value stocks, should perform disproportionately well. However, if central banks tighten faster-than-expected in the face of an increase in inflation, such a tightening of financial conditions would likely cause discount rates to increase faster and earnings growth rates to slow, which would cause equities to re-rate lower. Over the long term, high-quality equities with pricing power should be best positioned to keep up with inflation even if they suffer in the short term as they adjust to rising yields.
Conclusion
While an increase in inflation in the coming months is probable, we expect it will rapidly fade and developed markets inflation is unlikely to be sustained above 3% over the next year or two. Longer term, prospects for higher inflation are elevated, but so, too, are prospects for higher growth. In other words, the distribution of potential economic outcomes has widened. As such, diversification and careful portfolio construction informed by scenario analysis are central to meeting long-term investment objectives. We continue to explore means for creating more resilient portfolios, looking for assets or combinations of assets that could hold value during a wide variety of economic outcomes without incurring high opportunity costs. We are intrigued by the development of sustainable commodity-related products and are evaluating new products in this space. In sum, remain thoughtful about protecting against tail risk, but don’t get caught up in the hype about inflation.
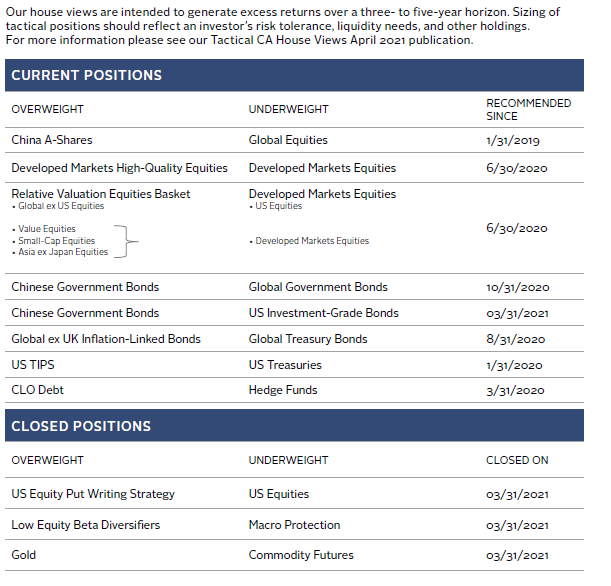
OVERVIEW OF TACTICAL CA HOUSE VIEWS
As of March 31, 2021
Index Disclosures
Bloomberg Barclays US Corporate Index
The Bloomberg Barclays US Corporate Bond Index measures the investment-grade, fixed-rate, taxable corporate bond market. It includes USD-denominated securities publicly issued by US and non-US industrial, utility, and financial issuers. The US Corporate Index is a component of the US Credit and US Aggregate Indices, and provided the necessary inclusion rules are met, US Corporate Index securities also contribute to the multi-currency Global Aggregate Index. The index was launched in July 1973, with index history backfilled to January 1, 1973.
Bloomberg Barclays US Treasury Bond Index
The Bloomberg Barclays US Treasury Bond Index includes public obligations of the US Treasury (i.e., US government bonds). Certain Treasury bills are excluded by a maturity constraint. In addition, certain special issues, such as state and local government series bonds (SLGs), as well as US Treasury TIPS, are excluded.
Bloomberg Barclays US Treasury Inflation-Linked Bond Index
The Bloomberg Barclays US Treasury Inflation-Linked Bond Index (Series-L) measures the performance of the US Treasury Inflation Protected Securities (TIPS) market. Federal Reserve holdings of US TIPS are not index eligible and are excluded from the face amount outstanding of each bond in the index.
Index Disclosures (cont.)
Federal Reserve Three-Month Treasury Bill Index
The Three-Month Treasury Bill Rate is the yield received for investing in a government issued treasury security that has a maturity of three months. The three-month Treasury yield is included on the shorter end of the yield curve and is important when looking at the overall US economy. The three-month Treasury yield hovered near 0 from 2009 to 2015 as the Federal Reserve maintained its benchmark rates at 0 in the aftermath of the Great Recession.
FTSE/NAREIT All Equity REITs Index
The FTSE NAREIT All Equity REITs Index is a free float–adjusted, market capitalization–weighted index of US equity REITs. Constituents of the index include all tax-qualified REITs with more than 50% of total assets in qualifying real estate assets other than mortgages secured by real property.
MSCI World Index
The MSCI World Index represents a free float–adjusted, market capitalization–weighted index that is designed to measure the equity market performance of developed markets. As of March 2021, it includes 23 developed market country indexes: Australia, Austria, Belgium, Canada, Denmark, Finland, France, Germany, Hong Kong, Ireland, Israel, Italy, Japan, the Netherlands, New Zealand, Norway, Portugal, Singapore, Spain, Sweden, Switzerland, the United Kingdom, and the United States.
MSCI EAFE Index
The MSCI EAFE Index is an equity index which captures large- and mid-cap representation across 21 developed markets countries around the world, excluding the United States and Canada. Developed markets countries in the MSCI EAFE Index include: Australia, Austria, Belgium, Denmark, Finland, France, Germany, Hong Kong, Ireland, Israel, Italy, Japan, the Netherlands, New Zealand, Norway, Portugal, Singapore, Spain, Sweden, Switzerland, and the United Kingdom. With 918 constituents, the index covers approximately 85% of the free float–adjusted market capitalization in each country.
S&P 500 Index
The S&P 500 Index measures the stock performance of 500 large companies listed on stock exchanges in the United States. The S&P 500 is a capitalization-weighted index and the performance of the ten largest companies in the index account for 21.8% of the performance of the index. The average annual total return of the index, including dividends, since inception in 1926 has been 9.8%; however, there were several years where the index declined more than 30%.
S&P GSCI™ Total Return Index
The S&P GSCI™ is designed as a benchmark for investment in the commodity markets and as a measure of commodity market performance over time. The S&P GSCI™ is calculated primarily on a world production-weighted basis and comprises the principal physical commodities that are the subject of active, liquid futures markets. There is no limit on the number of contracts that may be included in the S&P GSCI™; any contract that satisfies the eligibility criteria and the other conditions specified in this methodology are included. The S&P GSCI™ Total Return Index is composed of the principal physical commodities futures contracts.
Footnotes
- More formally, money supply * velocity = GDP. Velocity reflects the circulation of money, or how many times the money supply turns over to produce GDP.
- The US Federal Reserve and Bank of Japan instituted this policy in 2008 and the Bank of England in 2009, joining other central banks, such as the European Central Bank and People’s Bank of China.
- Of course, it may also be the case that bank reserves remain high due to a lack of demand, in which case expanding the money supply is futile in stimulating the economy. There is some evidence that this has been the case, as rather than borrow to invest, US corporations have largely borrowed to fund buyback activity over the post–Global Financial Crisis (GFC) period.
- This strategy was also broadly employed in the period following World War II, although amid vastly different circumstances.
- For more discussion on demographics see Charles Goodhart and Manoj Pradhan, “The Great Demographic Reversal: Ageing Societies, Waning Inequality, and an Inflation Revival,” Basingstoke, United Kingdom: Springer Nature, 2020, Mikael Juselius and Előd Takáts, “The Enduring Link between Demography and Inflation,” BIS Working Paper No. 722, 2018, and Adrien Auclert et al., “Demographics, Wealth, and Global Imbalances in the Twenty-First Century,” NBER Working Paper, 2020.
- Economic analysis is typically done on a global basis, as each country balances its supply/demand for capital through its current account, increasing imports relative to exports when demand is higher than supply and increasing exports more than imports when supply is higher than demand.
- The discount rate can be decomposed into the sum of the real risk-free rate, the inflation premium, and the equity risk premium.
Celia Dallas - Celia Dallas is the Chief Investment Strategist and a Partner at Cambridge Associates.
About Cambridge Associates
Cambridge Associates is a global investment firm with 50+ years of institutional investing experience. The firm aims to help pension plans, endowments & foundations, healthcare systems, and private clients achieve their investment goals and maximize their impact on the world. Cambridge Associates delivers a range of services, including outsourced CIO, non-discretionary portfolio management, staff extension and alternative asset class mandates. Contact us today.