VantagePoint: Modern Portfolio Diversification


Investors are facing a challenging period for earning what they spend and achieving adequate portfolio diversification. With most developed markets sovereign bond yields near or below zero, expected returns for bonds are at all-time lows. Further, given the discounted present value of all assets increase as discount rates fall, valuations have received a boost from falling interest rates that may not be repeated. As investors face prospects of a regime shift in which bond yields remain flat or increase, portfolios may benefit from more robust forms of diversification.
In this edition of VantagePoint, we evaluate defense and diversification options to identify a modern approach to diversification. Our diversification objectives are to support liquidity needs during periods of stress and diversify to smooth portfolio returns. We approach this as a thought piece in which we take a step back to find creative solutions to inform investor deliberations. We evaluate three solutions suitable to different types of investors: 1) Substitute sovereign bond allocation with a diversified basket of defensive assets; 2) Use a barbell approach incorporating a cash liquidity reserve accompanied by a higher allocation to private investments; and 3) Allocate a sizeable percentage of assets to high-quality, cash distributing investments to support liquidity needs across the portfolio. Unfortunately, there is no solution that meets all investors’ needs. The first two options may hold greater appeal to endowments, foundations, and private wealth investors, while the third may be most attractive to investors with long-dated liabilities that are total return oriented, like US public pension funds and UK pension schemes.
Assessing the Challenge
In a companion paper, “Playing Defense in a Low-Rate Environment,” we discuss the limited ability of sovereign bonds to offer upside in bear markets since nominal yields have an effective lower bound 1 below which they cannot fall, capping prospective returns. Bond markets with negative nominal yields early in 2020 (e.g., Germany, France, Switzerland, and Japan) notably failed to meaningfully appreciate during the equity bear market. Even for markets with positive yields, prospective returns are constrained. Nominal yields would need to fall to -1.0% (the lowest yields on record) in Australia, Canada, and the United States to approach the double-digit peak-to-trough returns seen around many prior equity bear markets.
Many investors have been willing to continue to hold bonds with positive yields as they have fallen, in large part, because of their superior diversification qualities. In recent years, as yields have fallen and expected returns have declined, the utility of such bonds has been sustained as correlations with equities have fallen deep into negative territory, providing substantial diversification benefits. With yields at or near the effective lower bound and negative real yields across most developed markets, these benefits have largely evaporated.
DIVERSIFICATION BENEFITS OF SOVEREIGN BONDS CANNOT BE SUSTAINED AT LOW YIELDS

Sources: Bloomberg Index Services Limited and MSCI Inc. MSCI data provided as is without any express or implied warranties.
Notes: Treasuries are represented by Bloomberg Barclays US Treasury Index total returns. Global equities are represented by MSCI World Index total returns (net of dividend withholding taxes) through December 31, 1987, MSCI All Country World Index total returns (gross of dividend withholding taxes) from December 31, 1987 through December 31, 2000, and MSCI All Country World Index total returns (net of dividend withholding taxes) thereafter. All returns data are monthly and in USD terms.
More Tools in the Toolbox
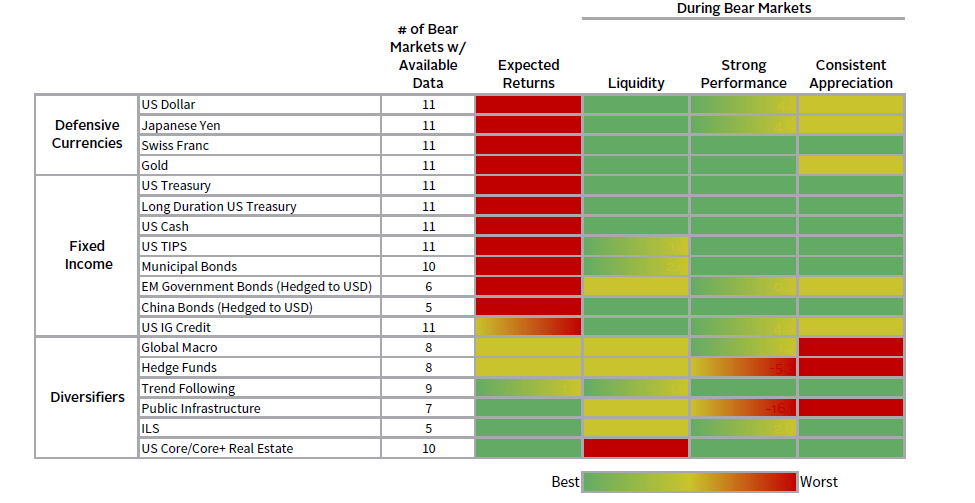
Sovereign bonds have been an ideal diversifier of equity risk over recent decades because they have offered the following three desirable characteristics for fulfilling this role in portfolios: 1) liquidity; 2) reasonable expected returns; and 3) strong and consistent appreciation during equity bear markets. Today, yields on offer on most high-quality sovereign bonds relegate them to serve primarily as a liquidity reserve.
The following matrix provides a high-level summary of how various defensive assets and diversifiers stack up against our ideal traits of portfolio diversifiers. The expected return column reflects our return estimates under steady state conditions: current valuations and trendline fundamentals, with no assumption of valuation mean reversion. 2 We base the liquidity and diversification characteristics on historical performance during global equity bear markets (i.e., declines of 20% or more). The underlying performance data can be found in Appendix A of this report.
EVALUATING THE TRADE-OFFS IN SELECTING PORTFOLIO DIVERSIFIERS
January 31, 1970 – December 31, 2020
Sources: Bank for International Settlements, Barclay Trading Group, BlackRock, Inc., Bloomberg Index Services Limited, Bloomberg L.P., Cambria Investment Management, LP, FTSE International Limited, Goldman, Sachs & Co., Hedge Fund Research, Inc., Invesco Ltd., J.P. Morgan Securities, Inc., National Council of Real Estate Investment Fiduciaries, ProShare Advisors LLC, Societe Generale, Standard & Poor’s Financial Services LLC, State Street Corporation, Swiss Re Capital Markets Limited, and Thomson Reuters Datastream.
Notes: Bear markets are defined as declines of 20% or greater in global equities (represented by MSCI World prior to 1987 and MSCI ACWI thereafter) without an interceding gain of 20% or greater based on daily data. Liquidity is quantified using the bid-ask spread for the most liquid ETFs that track each respective asset class, where applicable. Liquidity rankings were determined by calculating the median liquidity during the 2020 market downturn relative to the median liquidity during the preceding 63-trading days. Strong performance during bear markets is based on the average cumulative total return for each bear market period; green indicates an average return of 5% or greater, green/yellow is an average return of 0% to 5%, and yellow/red indicates that returns were negative on average but were typically less than half the drawdown of global equities. Consistent appreciation is based on the frequency that an asset class experiences positive returns during a bear market; green indicates a greater than 70% hit rate, yellow is a hit rate between 50% and 70%, and red is a less than 50% hit rate. Expected returns are based on relative three-year steady state return estimates, with green representing the highest steady state return expectations and red, the lowest, among diversifiers. All returns are in USD terms. Calculations are based on the longest available history for each asset class.
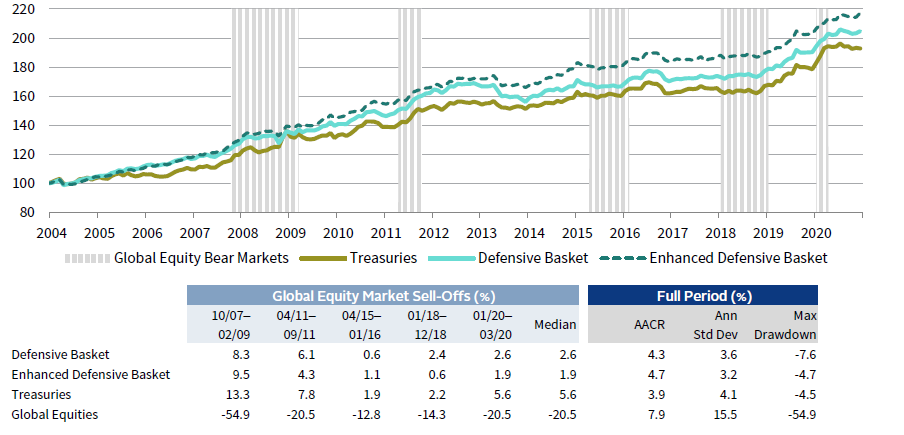
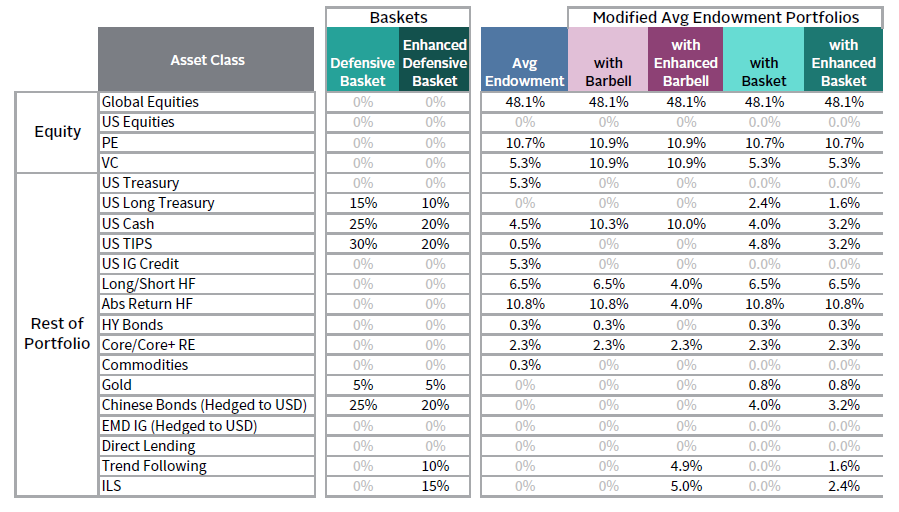
As a brief recap, our companion paper “Playing Defense in a Low-Rate Environment” examines the merits and drawbacks of a range of defensive assets; it finds that we could construct a basket that has provided comparable protection to high-quality sovereign bonds historically, while offering comparable-to-better performance prospects under a range of future scenarios. The defensive basket is composed 3 of cash (25%), long-duration US Treasuries (15%), US TIPS (30%), Gold (5%), and Chinese sovereign bonds hedged to US dollar (25%). 4
A More Diversified Defensive Basket
The main attribute of the defensive basket discussed above is that it offers more robust diversification in a range of economic scenarios than high-quality sovereign bonds alone. However, like sovereign bonds alone, long-term return prospects are poor. Therefore, it is worth exploring if we can improve the return prospects of the basket without meaningfully deteriorating its diversification capabilities. To do so, we focused on evaluating insurance-linked securities (ILS) and trend following, as these strategies historically have demonstrated superior diversification characteristics. They also offer higher return prospects than the components in the original basket, albeit in exchange for some complexity and illiquidity. (See Appendix B for a brief discussion of the characteristics of ILS and trend following strategies.) ILS are one of a number of specialty finance strategies, along with life settlements and music and pharmaceutical royalties that can provide competitive expected returns for portfolios with little economic exposure.
To observe the benefits of ILS and trend following, we added them to our defensive basket taking the same risk-weighted approach 5 used in forming the original basket. This enhanced basket is composed of 15% ILS, 10% trend following, 10% long-duration US Treasuries, 5% gold, and 20% each in cash, US TIPS, and Chinese sovereign bonds hedged to US dollars. As shown below, the enhanced basket’s performance is better than both the original defensive basket and Treasuries over the period for which we have data. The maximum drawdown of the enhanced basket was also an improvement over the original defensive basket and similar to that of Treasuries over this period.
ENHANCED BASKET OUTPERFORMS WITH SIMILAR BEAR MARKET CHARACTERISTICS
January 1, 2004 – December 31, 2020 • December 31, 2003 = 100
Sources: Bloomberg Index Services Limited, Bloomberg L.P., MSCI Inc., Societe Generale, Swiss Re Capital Markets Limited, and Thomson Reuters Datastream. MSCI data provided “as is” without any express or implied warranties.
Notes: See Appendix D for details about portfolio construction. Bear markets are defined as declines of 20% or greater in global equities (represented by MSCI World Index prior to 1987 and MSCI ACWI Index thereafter) without an interceding gain of 20% or greater based on daily data. Cumulative wealth calculations are based on monthly portfolio total returns in USD terms.
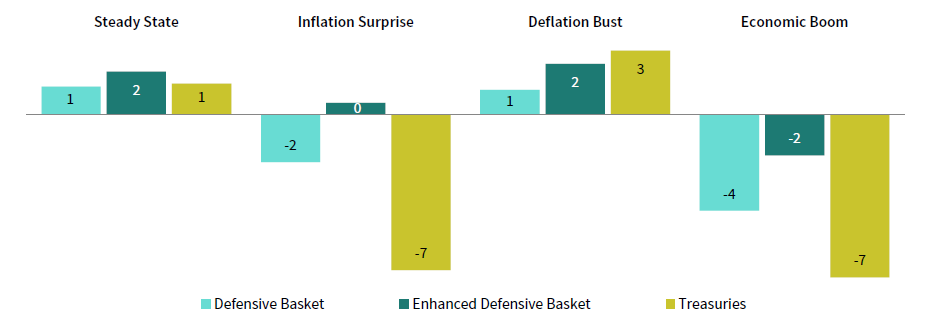
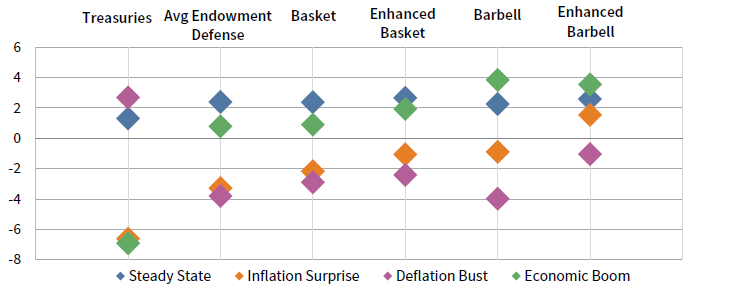
To understand how these portfolios may behave prospectively under varied environments, we estimated their performance in different economic scenarios. In addition to the steady state scenario described above, we explored the following scenarios: 6
- An inflation surprise, in which inflation increases to an average of 3.5% over three years, nominal rates rise to 5%, and economic growth contracts;
- A deflation bust, in which inflation falls to an average of -1% over three years, economic growth contracts, and nominal yields fall to 0.0%; and
- An economic boom, in which inflation averages 2%, nominal yields increase to 5%, and the economy grows faster than inflation.
Looking across these scenarios, the enhanced defensive portfolio is the most resilient. The only environment Treasuries are expected to outperform is a deflationary bust. Such baskets offer even more potential relative to lower yielding sovereign bonds than is available in most other developed markets.
ENHANCED DEFENSIVE BASKET IMPROVES PROSPECTS UNDER MOST SCENARIOS
Nominal Returns Over the Next Three Years (%)
Sources: Bloomberg Index Services Limited, Bloomberg L.P., Hedge Fund Research, Inc., Societe Generale, Swiss Re Capital Markets Limited, and Thomson Reuters Datastream.
Note: See Appendix D for details about portfolio construction and see Appendix C for details about return projection assumptions used for each scenario.
A Simple Barbell Approach
The diversification strategies discussed above are generally small shares of diversified portfolios. Investors rarely hold enough defensive assets to hedge equity risk. More typically, diversification is intended to dampen drawdowns and provide a source of relatively stable liquidity for spending, capital calls, and potentially rebalancing, to enable risky assets to recover. A defensive basket is not the only way to provide that liquidity. Another means for meeting this need is to hold a barbell portfolio, replacing defensive assets like bonds with a combination of cash to serve as a liquidity reserve, and higher returning investments such as venture capital and private equity to offset the performance drag from cash.
To see how this strategy would have worked historically, we compare it to a typical endowment portfolio. We create a pro forma performance series for a “typical” endowment based on market index returns weighted by the current average endowment’s asset allocation. We then adjust the average endowment’s asset allocation to create a barbell portfolio by reallocating the 16% in investment-grade bonds, cash, and commodities to cash (10%) and private equity and venture capital (6%). This scenario maintains the allocation to other portfolio investments, such as public equities, real estate, and hedge funds. 7 We also construct a modified version of the barbell that diversifies the remaining portfolio diversifiers into trend following and ILS strategies to see if they would prove as beneficial to enhancing our barbell portfolio as they did to our defensive basket. To add these strategies, we reduce the 17% average endowment hedge fund allocation to 8%, eliminate the high-yield allocation, and reallocate 5% each to trend following and reinsurance.
BARBELL PORTFOLIOS HAVE OUTPERFORMED THE AVERAGE ENDOWMENT WITH SIMILAR BEAR MARKET CHARACTERISTICS
First Quarter 2004 – Second Quarter 2020 • Fourth Quarter 2003 = 100 • US Dollar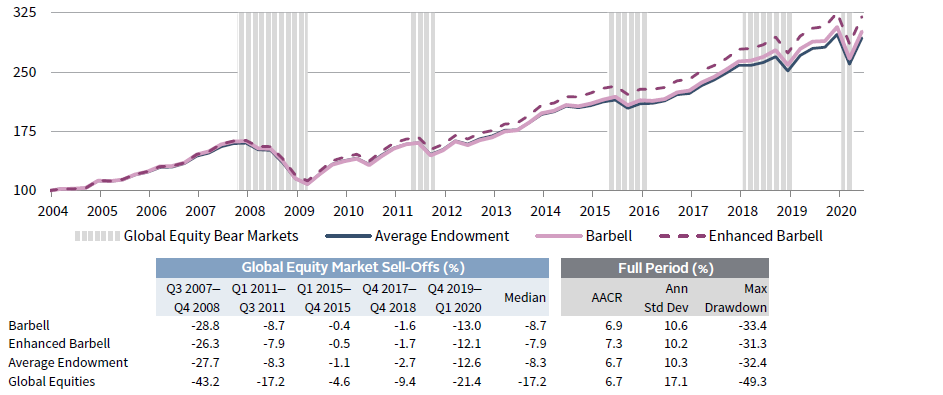
Sources: Bloomberg Index Services Limited, Bloomberg L.P., Cambridge Associates LLC, Hedge Fund Research, Inc., MSCI Inc., National Council of Real Estate Investment Fiduciaries, Societe Generale, Swiss Re Capital Markets Limited, and Thomson Reuters Datastream. MSCI data provided “as is” without any express or implied warranties.
Notes: See Appendix D for details about portfolio construction. Bear markets are defined as declines of 20% or greater in global equities (represented by MSCI World Index prior to 1987 and MSCI ACWI Index thereafter) without an interceding gain of 20% or greater based on daily data. Cumulative wealth calculations are based on monthly portfolio total returns in USD terms.
As seen above, the barbell performed comparably to the average endowment portfolio, although the enhanced barbell outperformed while maintaining similar risk characteristics. Provided an increased allocation to cash is accompanied by an increase in high-returning investments, the barbell can offer comparable returns, volatility, and drawdown characteristics to a portfolio with a higher allocation to bonds and lower allocation to equities. The change in strategy has the benefit of creating a liquidity reserve that should be valuable in a variety of scenarios and at 10%, could be sufficient for a wide range of investors to meet cash needs. However, because such a portfolio has vastly lower bond duration, we would recommend codifying such a strategy in investment policy and reflecting it in benchmarks.
We caution that while cash does not create a drag on portfolios when included as part of a barbell strategy, investors with an already-high allocation to illiquid assets may not have capacity to increase illiquidity sufficiently to offset the cash drag. Investors must evaluate their ability to tolerate higher levels of illiquidity when considering a barbell strategy. The average endowment holds 18% of assets in private investments. An increase to 24%, given the nature of the remainder of the portfolio, offers plenty of liquidity. Finally, allocations to private investments take time (and liquidity) to build, so investors need to carefully consider the transition to a barbell strategy. Secondary purchases can help, but the transition cannot take place over night. In short, investors should be thoughtful in establishing the appropriate barbell strategy to meet their specific needs.
Baskets versus Barbells
To pull this all together, we compare these diversification strategies on a prospective basis using the four scenarios discussed above. To do so in a consistent manner, we converted the average endowment portfolio to incorporate the defensive basket and the enhanced defensive basket in the same manner that we adjusted that portfolio to create a barbell. In the case of the defensive basket, rather than reallocating the 16% in investment-grade bonds, cash, and commodities to cash and private equity and venture capital (PE/VC) as we did for the barbell, we instead allocate the capital to the defensive basket and the enhanced defensive basket. 8 We then isolate the non-equity component (defined here as anything other than public equities and PE/VC) of these strategies and compare them on a prospective basis. Treasuries are included as a reference to represent the diversification component of a simple 70/30 or 60/40 portfolio.
BASKETS AND BARBELLS MAY PROVE MORE RESILIENT ACROSS MARKET ENVIRONMENTS
As of December 31, 2020 • Scenario Return Projections • Three-Year AACR (%)
Sources: Bloomberg Index Services Limited, Bloomberg L.P., Cambridge Associates LLC, Hedge Fund Research, Inc., MSCI Inc., National Council of Real Estate Investment Fiduciaries, Societe Generale, Swiss Re Capital Markets Limited, and Thomson Reuters Datastream. MSCI data provided “as is” without any express or implied warranties.
Notes: See Appendix D for details about portfolio construction; the asset classes categorized as “rest of portfolio” are the ones included in this analysis. Details about scenario return assumptions can be found in Appendix C. Return projections are in nominal USD terms.
Both the defensive basket and barbell approach offer better performance characteristics in every scenario other than a deflation bust. Given the estimation error in our scenario assumptions, it is difficult to conclude that one of these alternatives is definitively better than any other, but combining some attributes of improved diversification along with the barbell strategy seems to lead to the most improvement with the least opportunity cost relative to Treasuries in a deflationary bust. Ultimately, the success of a strategy is linked to investor comfort and both approaches merit consideration.
A Bird in the Hand
The final strategy we discuss is the prospect of making a sizable allocation to asset classes that generate high-quality cash flows that can be used to meet a meaningful portion of liquidity needs without forcing sale of assets that have fallen in value. Such investments may be equity, credit, or real asset related. In fact, a diversified basket may be ideal. The fundamental characteristics to focus on are the likelihood that adequate cash flows will persist during a variety of economic scenarios and that total return prospects for the total portfolio remain sufficient to meet long-term investment objectives.
Consider the example of direct lending. Senior secured debt managers typically target 6% to 8% net IRRs, unlevered. The coupon is approximately 5.5% today with a 1% LIBOR floor and a 450 basis points (bps) credit spread. Our research finds that losses during the worst part of the global financial crisis were 9% to 10% of vintage year par value, suggesting coupons after losses could persist at a rate of nearly 5%. Coupon payments could be exchanged for payments in kind (PIK), further lowering near-term payouts, so a 4.5% cash flow stream might be a more reasonable estimate of cash flow in times of stress. A 20% allocation to a diversified portfolio with 4.5% income in stressed periods would cover cash needs of nearly 1% of pre-bear market total portfolio market value. The higher the allocation and the higher the yield, the greater the ability for such a strategy to prove helpful. Investments in private ILS and other less economically sensitive specialty finance strategies (e.g., reinsurance, life settlements, pharmaceutical royalties), critical infrastructure, and defensive core real estate can offer comparable or higher stable cash flows to direct lending and provide diversification.
Another benefit of such investments is that historical returns have been competitive with that of global equities, unlike more defensive assets. 9 In building such exposures, investors must consider the degree to which demand patterns are changing and not be too reliant on sectors like core office real estate that may see demand soften by more than current market pricing suggests.
INCOME-ORIENTED STRATEGIES CAN BE HELPFUL DURING DOWNTURNS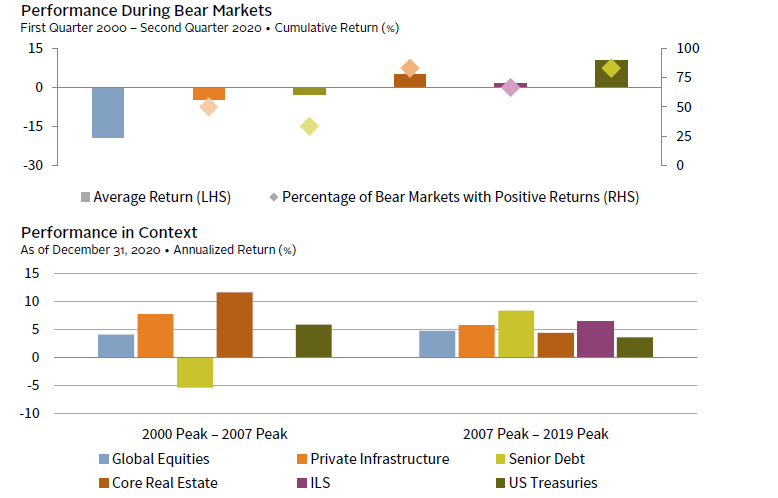
Sources: Bloomberg Index Services Limited, Cambridge Associates LLC, MSCI Inc., National Council of Real Estate Investment Fiduciaries, Swiss Re Capital Markets Limited, and Thomson Reuters Datastream. MSCI data provided “as is” without any express or implied warranties.
Notes: “Global Equities” represents MSCI ACWI, gross of dividend withholding taxes prior to 2001 and net thereafter; “Private Infrastructure” represents the Cambridge Associates Private Infrastructure Index; “Senior Debt” represents the Cambridge Associates Senior Debt Index; “Core Real Estate” represents the NCREIF Open-Ended Diversified Core Equity Index, net of fees; “ILS” represents the Swiss Re Catastrophe Bond Index; and “US Treasuries” represents the Bloomberg Barclays US Treasury Bond Index. Private Infrastructure returns are based on less than 10 funds prior to third quarter 2004 and Reinsurance data are not available prior to 2005. Bear markets are defined as declines of 20% or greater in global equities (represented by MSCI World Index prior to 1987 and MSCI ACWI Index thereafter) without an interceding gain of 20% or greater. All data are quarterly.
The main challenges we see in executing this strategy are that in the low-yield environment, investors need to look toward illiquid assets to generate adequate income and many return-oriented investors are unwilling to invest in illiquid assets with lower expected returns than private equity or venture capital. Second, such income-oriented investments are typically not appropriate for US families, as the after-tax income and returns are far less appealing. Third, such an approach is more difficult to implement than a sovereign bond allocation, but is comparable to the complexity of many diversifier portfolios that include a mix of public and private credit, real assets, and hedge funds. And finally, investors must transition into such a portfolio, using up valuable cash inflows to meet capital calls for drawdown funds until a mature portfolio can be built several years down the road.
With regard to the first observation, we would note that investors anticipating 15% plus returns from private equity and venture capital should consider that if equity returns are lower, given limited ability for falling interest rates to further boost returns, any return premium from privates is unlikely to fill the void. In other words, if you are underwriting a 300 bp to 500 bp premium to public equities, if they return 5% or 7%, 15% PE/VC returns are unlikely. Secondly, to the degree that illiquid assets provide meaningful diversification benefits, they can compound at a lower rate of return without compromising total portfolio returns—the free lunch of portfolio diversification.
Conclusion
Low yields on high-quality sovereign bonds provide a challenge to investors. Such bonds provide negative expected real returns and offer a limited ability to appreciate with yields near their effective lower bound. Eventually, yields will increase, and bonds will become compelling again, but today, they primarily serve as a liquidity reserve.
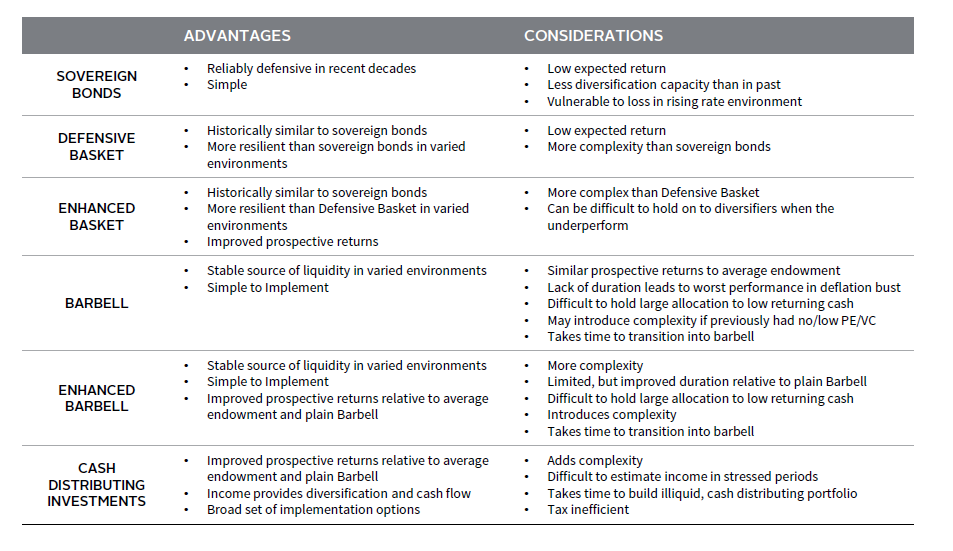
However, investors are not without means for improving return prospects in a variety of potential economic environments. Using a diverse basket of defensive assets, a barbell approach of cash and PE/VC, a cash flow–oriented approach to fund spending, or some combination of the three may offer an improvement over a simple stock/bond portfolio or the average allocation of endowed institutions. The benefits come with trade-offs as highlighted in the matrix below. All three strategies discussed involve some level of complexity and behavioral risk, as they suggest taking a different tact than is typical. Further, a meaningful allocation to cash requires an underweight to bond duration that should not be taken lightly. Such a change should be incorporated into investment policy and that policy should be evaluated over longer time horizons (e.g., three to five years).
SIZING UP THE DIVERSIFICATION OPTIONS
APPENDIX A: ASSET CLASS BEAR MARKET STATISTICS
January 31, 1970 – December 31, 2020
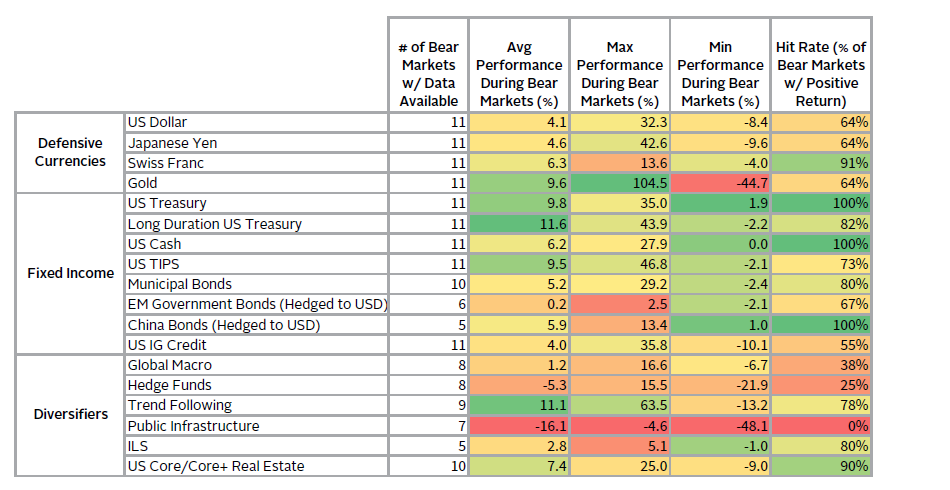
Sources: Bank for International Settlements, Barclay Trading Group, Bloomberg Index Services Limited, Bloomberg L.P., FTSE International Limited, Hedge Fund Research, Inc., J.P. Morgan Securities, Inc., National Council of Real Estate Investment Fiduciaries, Societe Generale, Swiss Re Capital Markets Limited, and Thomson Reuters Datastream.
Notes: Bear markets are defined as declines of 20% or greater in global equities (represented by MSCI World prior to 1987 and MSCI ACWI thereafter) without an interceding gain of 20% or greater based on daily data. All returns are in USD terms.
APPENDIX B: A Brief Review of the Insurance-Linked Securities and Trend Following
Insurance-Linked Securities (ILS). ILS are one of a number of specialty finance strategies that provide competitive expected returns with little economic exposure. ILS provide a means for reinsurance or insurance companies to transfer risk to investors. Investor capital serves as collateral to pay (re)insurance companies when contingent events transpire as specified in insurance contracts. Investors receive coupons that are transformed from premiums collected, returns on their capital held as collateral, and the return of capital not used to meet insurance losses at maturity. The diversification characteristics highlighted in the matrix above are based on catastrophe (Cat) bonds, the most liquid form of ILS. Private ILS are illiquid and privately traded, but they are generally shorter dated (one-year contracts) with no liquidity and generally pay higher premiums. Managers of private ILS typically have liquidity events every six months as a large proportion of contracts expire on either June 30 or December 31. ILS funds can be gated and often some capital will be kept in side pockets for long periods as collateral is held back until difficult-to-estimate liabilities are quantified. Managers have varying degrees of skill in managing these risks, which should be evaluated carefully before investment.
Cat bonds and private ILS maintain many characteristics of corporate bonds. The upside is limited; the best returns are generated by not losing money. However, losses are not based on credit ratings or credit events, which are highly correlated with equities and economic circumstances. Rather, ILS losses are based on the frequency and magnitude of catastrophic events. The historical cat bond loss rate since the inception of the Swiss Re Index in 2002 is 2.1% annualized. According to the National Association of Insurance Commissioners, since the inception of cat bonds in the 1990s, only ten of the more than 300 transactions have resulted in a loss of investor principal and four of these were related to credit events associated with collateral investments. As a result, since the global financial crisis, collateral has been largely held in US Treasury money markets, which has increased cat bonds’ diversification properties.
Primary perils, such as hurricanes and earthquakes, are well modeled and tend to be uncorrelated with economic distress. In contrast, bonds with commercial risk, like business interruption, are naturally more correlated with the global economy. Investors need to be cautious about the impact of climate change on insured losses, regulatory risk, and risk of asymmetric information relative to the (re)insurance companies offloading risk. Climate change adds material uncertainty, but this is somewhat mitigated by the short-term nature of contracts, which allow for frequent updating of loss models. In addition, ILS have little interest-rate duration risk. While cash collateral returns are determined by short rates, premiums are independent of rates and based on the risk and liquidity of the (re)insurance markets in which they participate.
Trend Following. Trend following is another diversifying strategy that checks most of the boxes for a good diversifier. Based on index returns for the strategy, trend has exhibited positive returns in seven of the last nine global equity bear markets, generating an average bear market return of 11%. The strategy is liquid and has shown a capacity to generate returns consistent with public equities over long periods with similar volatility.
While this would seem ideal, the reality is that trend following can be hard for investors to stomach. Trend following can and does perform poorly during some equity bull markets with no guarantee that it will do well during equity bear markets. Performance was mixed in 2020 and managers showed wide dispersion. During the first quarter, the equity market turmoil was short lived, and the reversal was swift. Trend managers with fast signals were more likely to perform well, while those with slower signals were not able to catch the change in the markets’ direction. The number of markets traded also matters. The contribution of sovereign bonds should be expected to diminish relative to historical contributions given that bonds have little room to appreciate further as discussed above. As it may be difficult for trend following models to get short fixed income in a rising rate environment because of the positive carry, managers trading currencies and possibly commodities are more likely to benefit.
Trend following performance is lumpy and inconsistent, yet its diversification characteristics hold appeal for those that understand and believe in the strategy. For those who can’t tolerate the inconsistency of returns, it’s best not to participate.
APPENDIX C: BASIC ASSUMPTIONS USED TO MODEL SCENARIO RETURNS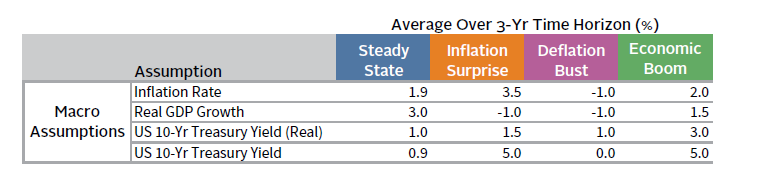
Source: Cambridge Associates LLC.
Note: Return projections are calculated based on three-year discounted cash flow models, except for Gold and Commodities, which are calculated using multiple regression models.
APPENDIX D: PORTFOLIO WEIGHT
Source: Cambridge Associates LLC.
Notes: Barbell Portfolio is a modified version of the Average Endowment; the Barbell Portfolio reallocates defensive asset classes (Treasury, Cash, TIPS, IG Credit, and Commodities) to just Cash and PE/VC. The Enhanced Barbell Portfolio reallocates diversifiers (Long/Short HF, Abs Return HF, and HY Bonds) to just Long/Short HF, Abs Return HF, Trend, and ILS. The Defensive Baskets are only the Defensive/Diversified component of a Total Portfolio. The baskets are risk weighted. The Enhanced Basket includes Trend and Reinsurance.
INDEX DISCLOSURES
Bloomberg Barclays US Treasury Index
The Bloomberg Barclays US Treasury Index measures USD-denominated, fixed-rate, nominal debt issued by the US Treasury. Treasury bills are excluded by the maturity constraint, but are part of a separate Short Treasury Index. STRIPS are excluded from the index because their inclusion would result in double-counting. The US Treasury Index was launched on January 1, 1973.
Cambridge Associates Core/Core+ Private Infrastructure Index
The Cambridge Associates Core/Core+ Private Infrastructure Index is based on data compiled from 49 infrastructure funds, including fully liquidated partnerships, formed between 2003 and 2017. All returns are net of fees, expenses, and carried interest.
MSCI All Country World Index
The MSCI ACWI is a free float–adjusted, market capitalization–weighted index designed to measure the equity market performance of the full opportunity set of large- and mid-cap stocks across 23 developed and 27 emerging markets. It covers more than 3,000 constituents across 11 sectors and approximately 85% of the free float–adjusted market capitalization in each market. The developed markets country indexes included are: Australia, Austria, Belgium, Canada, Denmark, Finland, France, Germany, Hong Kong, Ireland, Israel, Italy, Japan, the Netherlands, New Zealand, Norway, Portugal, Singapore, Spain, Sweden, Switzerland, the United Kingdom, and the United States. The emerging markets country indexes included are: Argentina, Brazil, Chile, China, Colombia, Czech Republic, Egypt, Greece, Hungary, India, Indonesia, Korea, Malaysia, Mexico, Pakistan, Peru, the Philippines, Poland, Qatar, Russia, Saudi Arabia, South Africa, Taiwan, Thailand, Turkey, and the United Arab Emirates.
MSCI World Index
The MSCI World Index represents a free float–adjusted, market capitalization–weighted index that is designed to measure the equity market performance of developed markets. As of December 2017, it includes 23 developed markets country indexes: Australia, Austria, Belgium, Canada, Denmark, Finland, France, Germany, Hong Kong, Ireland, Israel, Italy, Japan, Netherlands, New Zealand, Norway, Portugal, Singapore, Spain, Sweden, Switzerland, the United Kingdom, and the United States.
NCREIF Open-Ended Diversified Core Equity Index
The NCREIF Open-Ended Diversified Core Equity Index is an index of investment returns reporting on both a historical and current basis the results of 38 open-end commingled funds pursuing a core investment strategy, some of which have performance histories dating back to the 1970s. The NFI-ODCE Index is capitalization-weighted and is reported gross of fees. Measurement is time-weighted.
Swiss Re Catastrophe Bond Index
The Swiss Re Catastrophe Bond Index is a market value–weighted index of cat bonds, excluding life and health bonds. It is gross of fees and transaction costs and has data since 2002.
Footnotes
- The effective lower bound refers to the lowest level interest rates can fall before they become counterproductive. This is a theoretical bound, as limits are yet unknown. To date, the lowest ten-year nominal yields on sovereign bonds have fallen to is -1%.
- We are not making a judgement on currency appreciation/depreciation, but are reflecting the view that over the long term, currency returns are flat. High-quality developed markets bonds offer low returns as yields are the best predictor of subsequent long-term returns, and other diversifiers shown offer moderate to high returns relative to the available opportunity set. Many growth-oriented assets are not shown and should be expected to exhibit stronger performance than most diversifiers over time.
- The basket is equal weighted by active risk relative to US Treasuries. This weighting limits the ability of any one member of the basket to dominate performance relative to US Treasuries. Active risk combines both tracking error (standard deviation of excess returns over Treasuries) and capital allocation weight in the portfolio, to quantify the potential impact on relative returns versus Treasuries in basis points (bps).
- We also looked at a Euro Area basket to provide a perspective from a region with negative yields. The performance of the basket relative to global sovereign bonds hedge to euros looks even more appealing.
- Like the original basket, the enhanced basket is weighted such that each constituent has an equivalent amount of active risk relative to US Treasuries.
- See Appendix C for more detail on our scenarios.
- See Appendix D for a summary of portfolio allocations.
- Please see Appendix D for portfolio asset allocations.
- While senior debt is shown to have returned -5% during the 2000–07 market cycle, a small set of funds existed at that time, and from a vintage year IRR perspective, returns were in the mid-single digits during that period with positive multiples of capital. Median IRRs for later vintage years (2011–18) are in the 5% to 8% range net to LP, with top quartile funds returning as much as 10% (some with a turn of leverage).
Celia Dallas - Celia Dallas is the Chief Investment Strategist and a Partner at Cambridge Associates.
About Cambridge Associates
Cambridge Associates is a global investment firm with 50+ years of institutional investing experience. The firm aims to help pension plans, endowments & foundations, healthcare systems, and private clients achieve their investment goals and maximize their impact on the world. Cambridge Associates delivers a range of services, including outsourced CIO, non-discretionary portfolio management, staff extension and alternative asset class mandates. Contact us today.