
The start of the year is a good time for planning and reviewing your investment strategy. In this edition of VantagePoint, we facilitate that effort by setting the record straight on some commonly held investment myths.
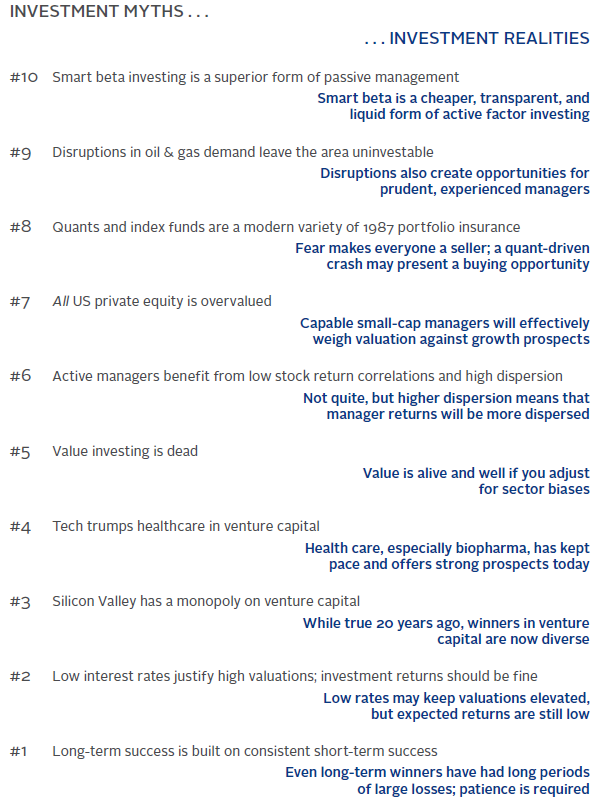
Top 10 Investment Myths
10. Smart beta investing is a superior form of passive management
9. Disruptions in oil & gas demand leave the area uninvestable
8. Quants and index funds are a modern variety of 1987 portfolio insurance
7. All US private equity is overvalued
6. Active managers benefit from low stock return correlations and high dispersion
5. Value investing is dead
4. Tech trumps health care in venture capital
3. Silicon Valley has a monopoly on venture capital
2. Low interest rates justify high valuations; investment returns should be fine
1. Long-term success is built on consistent short-term success
Myth 10: Smart beta investing is a superior form of passive management
Investment strategies can be arrayed along a continuum from passive to active. Pure passive investments seek to replicate “the market,” which by definition is market capitalization weighted. Smart beta strategies share some similarities with traditional market cap–weighted indexes and can be additive to portfolios, but they are far from passive and are not guaranteed to provide results superior to traditional indexes.
Over the last several decades, quants have been hard at work seeking to turn alphas into betas through researching and developing systematic approaches to more reliably capture market anomalies, or factor returns. More recently, these strategies have been democratized by smart beta providers who have come on the scene differentiating their products from quants by moving toward the index fund ideals of low cost, full transparency, scalability, and liquidity. While sharing these characteristics with index funds, these strategies are not passive. All smart beta strategies make the key decision to weight portfolio holdings by characteristics other than market capitalization. This fundamental decision is an active choice that moves investors decisively away from “the market,” which can only be defined in market cap–weighted terms. Additionally, smart beta factors are defined in numerous ways—the industry has not settled on a standard for calculating minimum volatility, momentum, or other factors—and methodological differences can result in performance differentials that are larger than those seen in market cap–weighted indexes covering the same market.
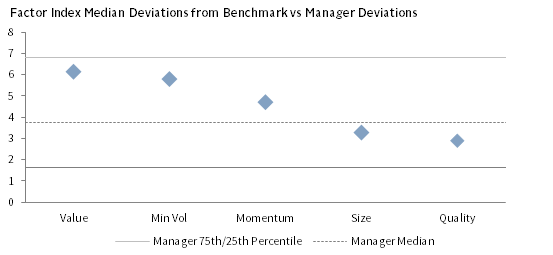
December 31, 1999 – December 31, 2017 • Annualized Excess Return (%)
Sources: Cambridge Associates LLC., MSCI Inc., and Thomson Reuters Datastream. MSCI data provided “as is” without any express or implied warranties.
Notes: “Deviation” is the absolute value of the difference between the factor index and benchmark over rolling one-year periods. The benchmark is the MSCI World Index. Total returns are gross of dividend withholding tax and in USD terms. Factors are represented as follows: “Value” is the MSCI World Enhanced Value Index, “Min Vol” is the MSCI World Minimum Volatility Index, “Momentum” is the MSCI World Momentum Index, “Quality” is the MSCI World Sector Neutral Quality Index, and “Size” is the MSCI World Equal Weighted Index. Cambridge Associates LLC’s (CA) manager universe statistics are derived from CA’s proprietary Investment Manager Database. Managers that do not report in US dollars, exclude cash reserves from reported total returns, or have less than $50 million in product assets (for 1998 to the present) are excluded. The sample of managers includes the following active asset strategies: Global Core Equity, Global Diverse Equity, and Global Opportunistic Equity.
Smart beta performance differs considerably from market cap-weighted indexes, creating significant tracking error over time (similar to that of traditional active managers). Of course, few, if any, investors would fully implement their equity exposure using one smart beta strategy, just as few would implement using one concentrated active manager. In practice, investors add smart betas into existing portfolios to capture a factor that is missing or underrepresented (often momentum or minimum volatility), or they combine smart beta indexes or strategies to create a total market exposure, most often using multi-factor products. Which alternative beta provider, which factors, what weights, and if weights are static or dynamic are important active decisions that must be made by the investor or outsourced to a manager. And like active managers, that combined portfolio can either add or detract value over different periods relative to the broad market index. Does this sound like passive management?
Smart beta strategies can be additive for investors’ portfolios as an alternative—and typically lower cost—form of active management. They can also be used as a means for evaluating the value that other, more expensive, active strategies bring to the table. If active managers can outperform factor exposures net of fees, they are well worth pursuing, while managers engaged in closet factor indexing and charging full active fees should be avoided.
Myth 9: Disruptions in oil & gas demand leave the area uninvestable
Rising competitive pressures and technological advancements have fundamentally changed the energy investment landscape. Such disruptions will provide capable managers with opportunities, but inexperienced managers that are not attuned to these shifting dynamics will likely struggle. The diversification benefits for energy investments are valuable, and the risk/reward trade-off can be attractive, suggesting that investors should think twice before abandoning oil & gas investments.
Expectations for alternative energy over the next 10–15 years are divergent. Estimates for renewable energy penetration range from 10% (BP’s base case) to roughly 50% (Bloomberg New Energy Finance), while electric vehicle penetration estimates range from 6% (ExxonMobil) to just over 90% (IMF fast adoption case). Most major energy forecasting agencies expect fossil fuel demand to increase over this horizon as increasing global energy demand is expected to offset some of the market share loss. At the same time, forecasters have been revising expectations for penetration upwards as costs for renewable energy have collapsed in recent years. A report from asset manager Lazard examined the cost competitiveness of alternative energy and estimated that the unsubsidized levelized cost of utility-scale solar photovoltaic energy has plummeted by 86% and of wind by 67% since 2009, making it cost competitive with conventional generation technologies in some circumstances. 1
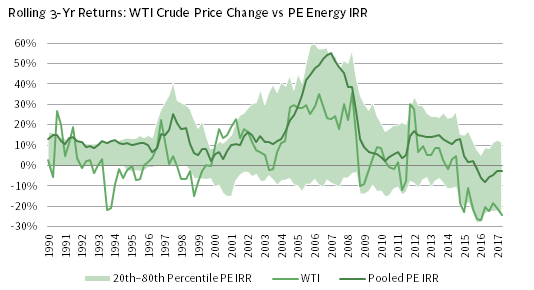
First Quarter 1990 – Second Quarter 2017
Sources: Cambridge Associates LLC, New York Mercantile Exchange, and Thomson Reuters Datastream.
Notes: Performance based on funds included in the CA Energy Upstream & Royalties and Private Equity Energy Index, excluding alternative and mining funds. Private energy performance represents pooled horizon internal rate of return calculations, net of fees, expenses, and carried interest for the 329 funds of vintage years 1986–2016. WTI represents three-year average annual compound returns for front-month NYMEX crude oil prices for the period beginning first quarter 1990 and ending second quarter 2017.
Please see Real Asset Dynamics: May 2017.
Private oil & gas returns have a positive relationship with oil prices, so downward pressure on oil & gas prices should be damaging to returns. However, the relationship has been somewhat convex; increases in oil prices have put more upside pressure on fund returns, while declines in oil prices have hurt, but returns have generally remained positive at the fund level. More recently, as energy price declines have been particularly severe, pooled private equity returns have been negative. Still, the best managers have been able to generate positive three-year trailing returns. In fact, despite oil price declines of 20% annualized over the most recent three-year period shown, the top 20% of managers returned more than 10%. One reason for this dynamic is the ability for good exploration and production firms to manage well-head economics by cutting costs and improving efficiency in the face of falling oil & gas prices. Land prices, which have been rising as oil prices come down (particularly in the Permian region of the United States) must also be taken into consideration. Private investors flush with dry powder may make purchase discipline more challenging. The amount of capital raised by private energy funds has trended up over the long term, with 2017 looking like a banner year for the industry as a number of large brand-name funds returned to market. In aggregate, the industry has raised in excess of $200 billion across the five-year period ended 2016, pushing dry powder to a record $130 billion and raising the odds of negative implications for asset entry pricing, expected returns, and risk.
Transformation in the energy industry should create both risk and opportunity. It is critical that investors seek out best-in-class managers. Attributes to look for include a laser-focus on buying discipline and cost management, very judicious use of leverage, flexibility to operate in less efficient segments of the market, and the ability to diversify across the energy spectrum including niche strategies designed to reduce production costs. We advise patience when making new fund commitments during this cycle, particularly to managers of larger, diversified funds with meaningfully unfunded legacy portfolios. Patience can be used to negotiate preferential fees and terms and to mitigate blind pool risk. For investors that have large allocations and/or unfunded commitments, venture capital investments may provide a hedge of sorts to the degree they invest in technologies seeking to benefit from oil & gas disruption.
There may also be opportunities in public oil & gas investments. However, the liquidity available in such investments is a double-edged sword. It provides flexibility to exit the market easily if conditions change, which opens the door to behavioral risk in a volatile investment. The risk of missing out on a recovery should investors overreact to market declines is an important factor.
Myth 8: Quants and index funds are a modern variety of 1987 portfolio insurance
As quantitative strategies and index funds have grown in popularity, some analysts have become increasingly concerned about prospects for such strategies to serve as an accelerant in a market sell-off, similar to the role portfolio insurance served in the market crash of October 1987. The reality is that there is plenty of blame to go around when markets crash. The main culprit, as evidenced over the long history of markets extending before the rise of quants, is human nature and the propensity to sell when greed turns to fear whether systematically through quant strategies or on a discretionary basis through qualitative processes. The higher the valuations and the greater the leverage when sentiment shifts, the bigger the market decline.
Sharp market downturns create vicious cycles where selling begets more selling, ultimately leading to forced sales to meet margin calls, redemptions by panicked investors, and sales by quant trading systems designed to sell when markets fall and/or volatility increases. Managers, institutions, and individuals with qualitative approaches to investment—the majority of the market, particularly in terms of trading volume—typically account for most of the selling. Index funds, while participating fully in market crashes, do not enhance downside risk.
It is wrong to generalize about quant strategies because they are not all designed to move in the same direction at the same time, even if they pursue the same broad strategy. The prevalence of risk management systems incorporating volatility and investment strategies targeting volatility levels provide the greatest cause for concern today. Because volatility is so low, some managers targeting a level of portfolio volatility will have increased leverage to get there. This leverage can perpetuate sell-offs in a downturn interacting with risk management systems designed to sell off equities as volatility rises. The risk of such practices is entirely dependent on how these systems are managed. Quant managers, exchanges, and regulators have learned valuable lessons from past crashes including the “flash crash” of May 2010 and the “quant crash” of August 2007 in which leverage played a significant role. Subsequently, most funds put in guardrails to prevent indiscriminant selling in the face of rising volatility. Many managers have adopted leverage caps and set bands within which volatility can move before the quant systems will trade. Concurrently, regulators and exchanges have refined their playbooks to more quickly and effectively reset the markets in the event of a flash crash.
What about index funds? Their role in creating stock market bubbles or accelerating market declines has been hotly debated. However, broad market index funds are simply price takers. It is active managers that determine relative valuations. By definition the allocation of the aggregate holdings of all active managers in a market must equal the aggregate allocation of index funds covering that market. 2 However, index funds and ETFs that address a subset of the market or that are not capitalization weighted (e.g., alternative beta funds) can be subject to crowding such that valuations become elevated and strategies become over-owned, putting them at risk of sharp reversals when sentiment changes. Of course, the same risk is posed by managers with discretionary investment processes that take more concentrated bets in crowded participants, with Valeant serving as a recent example.
Quantitative strategies have grown in popularity and as such may play a bigger role in market downturns. However, outflows from such strategies will be accompanied by even larger outflows from panicked discretionary investors and leveraged investors meeting margin calls. To the degree that a market sell-off is a correction based on an unwinding of crowded positions held by quants, or other transitory factors, the sell-off may represent a buying opportunity as 1987’s Black Monday ultimately proved to be.
Myth 7: All US private equity is overvalued
With average buyout market EBITDA purchase price multiples (PPMs) into the double digits—the highest level on record since our data begin in 2000—private equity in the United States is undeniably expensive. In a low yield world investors have flocked to private equity in search of higher returns, and general partners have complied with record setting fundraising in 2017. However, as we dial in to the details, we see more rational pricing in the small-cap segment of the market, even as EBITDA PPMs are up across all size segments.
Average PPMs for buyout deals with an enterprise value below $250 million (10.0 times in 2016) are still high, but well below averages for midsized companies (11.2 times for EVs up to $1 billion) and large caps (13.4 times). The distribution of multiples across deals in all size segments is wide, suggesting there is more opportunity for reasonable acquisition pricing than the averages suggest. Experienced firms in the small-cap segment are still able to purchase companies at PPMs of 6.0 to 8.0 times.
While entry valuations are an important driver of returns, they are not the only determinant. In fact, an analysis conducted by our research analytics team on over 1,000 portfolio companies that have completed exits concluded that entry multiples were not a statistically significant determinant of returns. Companies with the lowest EBITDA PPMs (6.0 to 8.0 times) had both the largest share of losses and big wins, while the most expensive deals at entry had the lowest share of losses and nearly 60% had a multiple-on-invested-capital (MOIC) of at least 2.0.
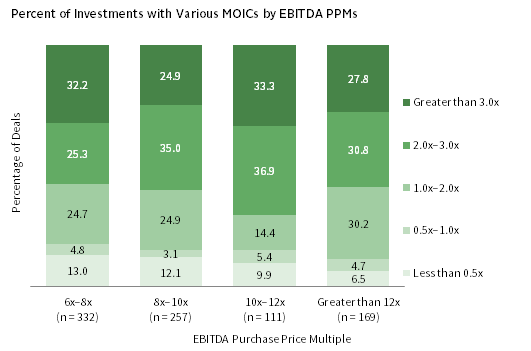
As of June 30, 2017
Source: Cambridge Associates LLC Private Investments Database (as reported by investment managers).
Notes: MOIC is analyzed for investments through June 30, 2017. Universe includes 869 fully realized US private equity companies acquired from 2000 to 2015.
The most likely differentiator among deals in buyouts is EBITDA growth, where the spread is also wide, with stronger growth experienced in the tech and health care sectors than the consumer discretionary and industrials sectors, on average, in recent years. The higher growth in these sectors has come with premium multiples suggesting that managers must find the right balance between valuation and growth, and only pay higher multiples when they can improve portfolio companies’ EBIDTA growth meaningfully.
In short, valuations are high for US private equity, particularly for larger buyouts. However, there is much dispersion behind the averages in both entry valuations and growth potential. Skilled, experienced managers can find the right companies at the right price, particularly in the small-cap segment of the market.
Myth 6: Active managers benefit from low stock return correlations and high dispersion
“Stockpickers, Rejoice! Correlations Are Falling Again” So reads a recent headline in The Wall Street Journal 3 providing yet another example of the perpetuation of the myth that lower pair-wise correlations or wider dispersion of stock returns across the market create a tailwind for active managers.
We are hard pressed to understand what investors should be rejoicing, other than prospects for diversification to better mute portfolio volatility. Correlations tell you nothing about expected performance of stock pickers. Consider the simplified example of two alternative worlds with two stocks in each world. In both worlds, all four stocks earned an annual return of 10%. However, in the low correlation world, the two stocks have a correlation of zero, meaning their movements are completely unrelated to each other throughout the year. In the high correlation world, the two stocks were perfectly positively correlated. In both worlds, it would not be possible for a stock picker to gain an advantage even as correlations were very different, as the individual stocks and the portfolio of two stocks would each have a return of 10%. Stock selection would not benefit from low correlation or suffer from high correlation. However, if a manager in the low correlation world had good timing skills (or was lucky), the manager could benefit from switching positions over the course of the year. Statistically, we see no meaningful relationship between correlations and managers’ ability to outperform the market.
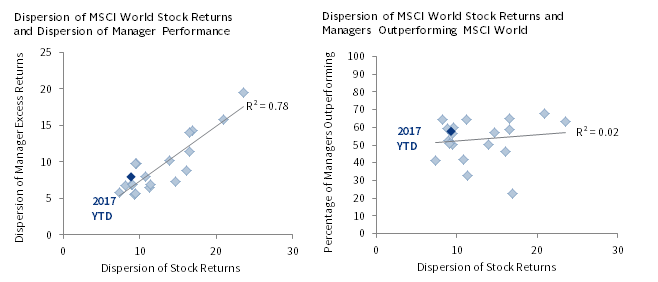
1998–2017
Sources: Cambridge Associates LLC, FactSet Research Systems, MSCI Inc., and Thomson Reuters Datastream. MSCI data provided “as is” without any express or implied warranties.
Notes: Cambridge Associates LLC’s (CA) manager universe statistics are derived from CA’s proprietary Investment Manager Database. Performance is generally reported gross of investment management fees. Managers that do not report in US dollars, exclude cash reserves from reported total returns, or have less than $50M in product assets are excluded. Returns for inactive (discontinued) managers are included if performance is available for the entire period measured. Dispersion is represented by the square root of the sum of the squared differences between returns for each constituent and the index return multiplied by the weight of the constituent in the index. Dispersion of return for managers represents managers in the middle 50% of the return range for global equity managers. Percent of managers outperforming is measured against the fee-adjusted index. Data for 2017 are through September 30.
Stock dispersion offers more promise as a useful tool to understand the backdrop for active managers. Higher dispersion of stocks provides more opportunities for active managers to post differentiated returns. The challenge is that the differentiation cuts both to the downside and the upside. The relationship between stock dispersion and manager excess return dispersion is fairly strong for global equity managers, especially in comparison to the weak relationship between stock dispersion and the percentage of managers outperforming the market. Such analysis varies over time and the manager universes analyzed, with long-short managers having a slightly higher edge relative to the broad market when dispersion is high, while global ex US equity managers’ ability to outperform has virtually no relationship with stock dispersion.
Over the last 12–18 months, correlations have come down from peak or near-peak levels of the cycle, while dispersion remains low, although slightly improved. To those who believe that low correlations and high dispersion are good signs for managers, this may create a puzzle. The reality is that these statistics measure different characteristics, neither of which provides strong indications of the ability of managers to outperform the market in the aggregate. The increase in dispersion, should it continue, does offer some opportunity for investors to benefit in a more meaningful way from manager selection.
Myth 5: Value investing is dead
Among global developed markets, value has underperformed growth since the end of 2006 marking the longest stretch of underperformance on record. As tends to be the case during extended periods of underperformance, investors have conjured up a variety of reasons as to why value investing is dead. Such justifications range from the increase in index fund and quantitative investment strategies that are not reliant on valuations to an intervention by central banks that seek to support asset markets, preventing markets from clearing to levels that represent clear value.
However, our analysis suggests that the dominant factor in value’s underperformance has been related to sector performance, not the value style itself. Performance attribution of the MSCI World Value Index relative to MSCI World Growth Index over the trailing ten years during which value underperformed indicates that 91% of the performance differential is attributable to sectors, with financials responsible for over half of the underperformance. On a cumulative basis, the value index has underperformed the growth index by 26%. Yet adjusting for sector biases by equally weighting sectors in growth and value, the value style underperformed growth by less than 5% on a cumulative basis and was on par with growth as recently as year-end 2016.
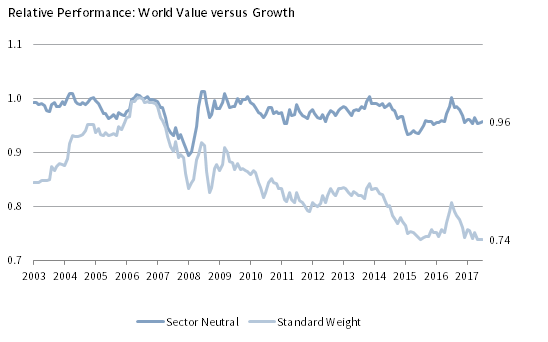
June 30, 2003 – December 31, 2017 • December 31, 2006 = 1
Sources: FactSet Research Systems and MSCI Inc. MSCI data provided “as is” without any express or implied warranties.
Notes: Returns are net of dividend withholding taxes. Data are monthly.
Value continues to be a viable strategy and will again have its day in the sun. Conditions for the strategy appear to be improving. Indeed, momentum in financials has turned positive over the last year or so, and the sector stands to benefit should interest rates increase more than expected provided the yield curve remains positively sloped. In addition, natural resources equities, another value heavy weight, trade at reasonable valuations amid improving fundamentals, setting the stage for an improved 2018. Oil supply and demand also appear to be moving into balance, providing further support for earnings among energy companies. Relative valuations for the MSCI World Value Index relative to the MSCI World Growth Index are near levels where they have historically seen a turnaround, but have been at such levels since the middle of 2015. We are neutral to constructive on value today, but do not see justification for large overweights. Rather, for investors that have been underweight value, we would seek to move to more neutral positions.
Myth 4: Tech trumps health care in venture capital
Health care venture capital has been staging a strong rebound, but you might not know it if you haven’t been paying close attention. While tech IPOs and unicorns dominate the headlines, US venture capital health care has outperformed US venture capital as a whole over the last five years. Biopharma—consisting of pharmaceuticals, biotechnology, and life sciences—has experienced a stellar decade.
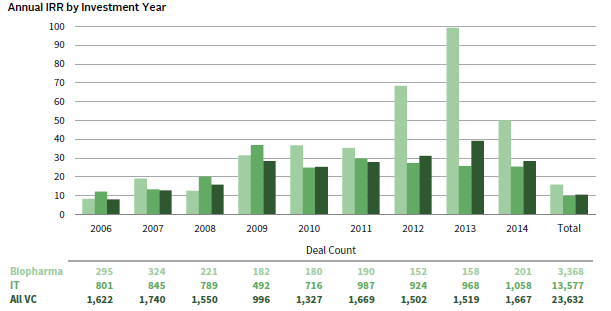
2006–2017 • Gross IRR (%)
Source: Cambridge Associates LLC Private Investments Database.
Notes: Industry classifications are based on GICS sector codes. Investment-level IRRs are gross of fees, expenses, and carried interest. Pooled gross IRRs since inception by initial investment year includes both fully and unrealized deals. Biopharma includes all pharmaceuticals, biotechnology, and life sciences deals.
The early 2000s were difficult for health care as high hopes around human genome investments didn’t materialize, and medical devices delivered disappointing returns. Generalist VC managers largely abandoned the area and the dedicated health care VC field consolidated as a number of managers were unable to successfully raise new funds. Despite a spike in activity in 2007, fundraising and investments remained subdued relative to venture as a whole until 2013, when activity began to pick up.
Today, opportunities abound driven by improvements in science, particularly genomics, gene therapies, and immunotherapies. An aging population is increasing demand for treatments for untreatable diseases such as Alzheimer’s, and prospects for curing certain untreatable cancers are increasing. Just last year, the FDA approved the first two gene therapies—chimeric antigen receptor T-cell (CAR-T) therapy treatments—designed to treat blood cancers. Human genome sequencing is now a source of rational exuberance as the cost of sequencing has dropped from its $100 million price tag in 2001 to under $1,000. The intersection of computing/big data with biology is increasing the efficiency of drug discovery. The reduced cost of sequencing has paved the way for the development of new targeted therapeutics, increasing the investment opportunity set. These advances have been facilitated by the FDA’s more transparent regulatory process in the United States, most recently in the case of digital health products, which has helped reduce the cost and complexity of obtaining approval.
As would be expected in this environment, fundraising for health care venture capital has picked up, although the number of funds raised by health care–focused funds remains well below the highs of the early 2000s, which were retested in 2007. At the same time, investments into VC–backed companies are increasing at a faster pace. Exits—both M&A and IPOs— are also robust. Big pharma and biotech firms have come to rely on smaller, often private, companies to develop new drugs and therapeutics, expanding the M&A opportunity set.
The health care venture capital investment landscape is thriving. Even as capital has returned to the sector, it remains a less crowded space than IT, and it needs to be given higher barriers to entry such as specialized knowledge requirements, regulatory hurdles, and reimbursement risk not seen in IT. As a result, fewer active, traditional venture funds are in the market today, reducing competition for high-quality investment opportunities. In this environment, managers with strong brand recognition, strong existing networks, and a record of success are well positioned to demonstrate competitive returns in the high risk/high reward sector. Tech is not the only game in town.
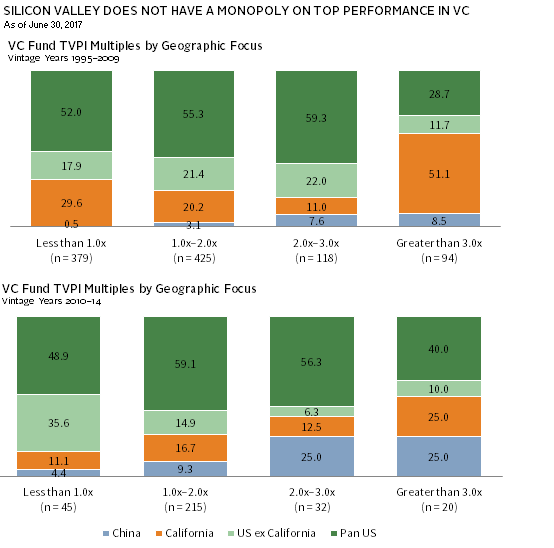
Myth 3: Silicon Valley has a monopoly on venture capital
Prior to 2000, there was some truth to this old wives tale. However, in recent years the industry has matured, as the technology and health care sectors have evolved, as the costs of starting technology companies have come down, and as the time required to bring products and services to market has shortened. This environment has enabled the venture capital ecosystem to become more dynamic. Startups have gained success outside of the traditional venture capital hubs in regions that offer a lower cost of living, lower operating costs, and access to talent pools often near high quality universities. The creation of new and innovative venture capital firms has forced established firms to innovate their own business models.
“Venture Capital Disrupts Itself: Breaking the Concentration Curse,” Private Investment Series, November 2015.
Gone are the days of top franchise firm dominance. Indeed, in a comprehensive year-by-year study of the top 100 portfolio holdings in terms of value creation from 1995–2012, we found: (1) an average of 61 firms account for the value creation in the top 100 venture capital investments per year; (2) over the last ten years of the period, new and emerging firms consistently account for 40% to 70% of the value creation; and (3) at least 20% of US company gains came from outside of the venture capital hubs of California, Massachusetts, and New York, while 20% of the total gains in the top 100 came from outside the United States since 2000.
This broad company–level success is mirrored in venture capital firms’ success. A comparison of vintage years 1995–2009 and 2010–14 shows that California-focused firms moved from generating just over half of funds with an MOIC of over 3.0x to just a quarter of such funds. The majority of top performing funds have been focused outside of Silicon Valley and California, and China has become a significant source of venture capital success. Even VC funds that invest across the United States have made the majority of their investments outside of California and with strong results. Between 2010–14, 55% of their portfolio investments were in companies based outside of California and 18% of those had MOICs greater than 3.0x.
As of June 30, 2017
Sources: Cambridge Associates LLC.
Notes: “US ex California” includes funds that specialize in US regions outside of California and the West Coast. “Pan US” includes funds that invest in the United States without a regional mandate. Thus “Pan US” funds may invest in California-based companies. For vintage years 1995–2009, approximately 40% of “Pan US” deals were based in California, based on deal count. For vintage years 2010–14, approximately 45% of “Pan US” deals were based in California, based on deal count.
Established franchises continue to produce admirable results, but in a highly competitive environment, casting a wider net to find best-in-class managers with more specialization and the relevant experience, networks, and skills for success wherever they may be based is wise in building portfolios that will stand the test of time. Rigorous due diligence and a long time horizon (e.g., 10–15 years) are critical in constructing successful portfolios, particularly when including newer managers operating in developing VC hubs.
Myth 2: Low interest rates justify high valuations; investment returns should be fine
Low rates do influence valuations in practice, and the relationship between rates and valuations is tighter than theory suggests it should be. This fact, however, is beside the point. The presumption investors often make is that equity returns will still be attractive with high valuations as long as yields are low. This is not the case. Low earnings yields are still predictive of low returns and high earnings yields of high returns over subsequent long-term periods, regardless of interest rate levels. This is clear based on investment theory behind low rates influencing valuations and the empirical relationship between Treasury yields, earning yields, price-earnings (P/E) ratios, and subsequent returns.
Using dividend discount model (DDM) math, the market P/E ratio can be expressed as follows:
P/E = Dividend Payout Ratio / [Discount Rate-Dividend Growth Rate]
As expressed with this formula, theory suggests that the lower the discount rate and the higher the dividend growth rate, the higher the P/E. Often overlooked is the fact that the forces pushing down the discount rate should also depress the dividend growth assumption. 4 To the degree that these two assumptions move in tandem, the denominator of the P/E formula remains unchanged meaning that there should be no effect on P/E ratios. The discount rate has three components: inflation expectations, the real yield (which should equal the real economic growth rate), and the equity risk premium (ERP). The growth assumption has two components: inflation expectations and real growth (which should also equal the real economic growth rate over the long term). If interest rates are low because inflation expectations are low, that should in no way effect P/E ratios, as the discount rate and dividend growth rate should be adjusted down by the same amount, leaving the spread between the two variables and the P/E ratio unchanged. Similarly, changes in real economic growth expectations that directly affect real yields should also affect growth expectations. If the real yield and the growth rate fall by the same amount, the P/E would remain unchanged. In contrast, the ERP is only reflected in the discount rate, not the dividend growth rate. Therefore, when the ERP increases, P/E ratios tend to fall, and when the ERP decreases, P/E ratios tend to rise.
Empirical evidence shows that bond yields and earnings yields have tended to move in tandem, at least in recent decades. 5 However, earnings yields and P/E ratios are better predictors of future stock returns than a stock-bond model. Equity returns show little, if any, relationship to bond yields or the spread between stock and bond yields.
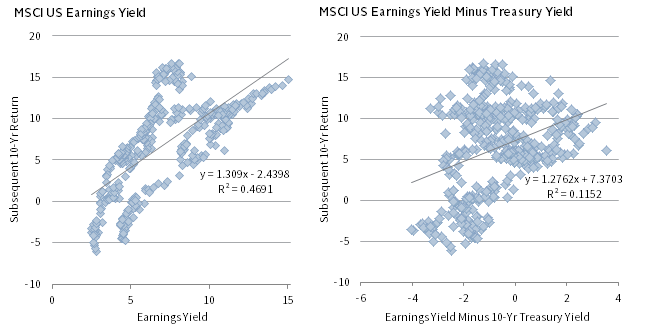
December 31, 1969 – November 30, 2017 • Percent (%)
Sources: MSCI Inc. and Thomson Reuters Datastream. MSCI data provided “as is” without any express or implied warranties.
Notes: The earnings yield is the inverse of the composite normalized price-earnings (P/E) ratio. The composite normalized P/E ratio is calculated by dividing the inflation-adjusted index price by the simple average of three normalized earnings metrics: ten-year average real earnings (i.e., Shiller earnings), trend-line earnings, and return on equity–adjusted earnings. All data are monthly. CPI data are as of November 30, 2017.
The bottom line is that US equities are very overvalued today, suggesting trouble for long-term returns. Even if interest rates remain low, then low sustained growth expectations should dampen aggregate market returns. Leaning into more attractively valued global ex US equities (both developed and emerging) is sensible.
Myth 1: Long-term success is built on consistent short-term success
Contrary to common belief, it is not necessary to outperform over every short-term period to build to a successful long-term track record. In fact, the majority of US equity managers that have outperformed their relevant style indexes over the last 20 years have underperformed by a considerable margin from time to time.
The first hurdle to long-term success is mere survival. Among the 1,368 US equity managers in our database at the start of 1996, a striking 73% are no longer reporting returns. However, of the 27% that survived for 20 years—370 managers—85% outperformed the relevant style index.
These 317 winners did not outperform over every short-term period. In fact, 60% experienced at least one three-year period in which they underperformed in each consecutive calendar year and more than 90% underperformed in two consecutive calendar years. The underperformance was often severe. On an annualized basis, 18% underperformed by 10 percentage points (ppts) or worse over three years and by more than 5 ppts per year over five years. Only one manager suffered no bouts of underperformance over a three-year period.
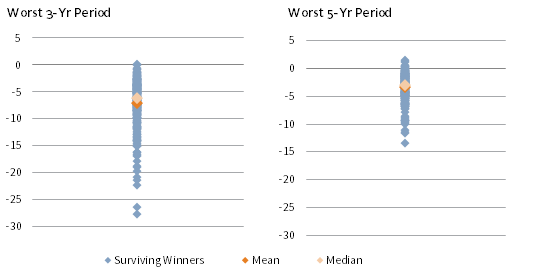
First Quarter 1997 – Fourth Quarter 2016 • Average Annualized Compound Return (%)
Sources: Cambridge Associates LLC Investment Manager Database and Frank Russell Company.
Notes: Analysis includes 317 managers that have outperformed their benchmark over the 20-year period. Manager returns are compared to their respective Russell 1000® or Russell 2000® style index. Data are quarterly.
Surviving into the long term appears to be more important in determining long-term winners than performance. Indeed the distribution of survivors and non-survivors in terms of percentage of years they outperformed their style index is quite similar. Organizational factors such as good governance, alignment of principal and agent issues, firm culture, and a loyal investor base are among the factors that influence success. Our experience in working with institutions and families for over 40 years has also revealed these factors as critical for success for total portfolios, not just for individual managers.
Investors should seek to understand managers’ performance history to appropriately set expectations for conditions under which managers will outperform and underperform, as well as the nature of performance under different environments. However, using even intermediate-term performance as a hiring and firing tool is misguided. Consider that the dollar-weighted returns of institutional shares of mutual funds are much lower—nearly 200 basis points—than the time-weighted returns that the funds report. This is because investors, even institutional ones, tend to sell managers when they are at or near their lows and buy in after a run of good performance. Active managers can be additive to portfolios, but it is difficult to do. If you cannot resist the temptation to fire good managers when they are down, it is probably best to not try as you are likely to underperform the market.
Index Disclosures
MSCI World Index
The MSCI World Index represents a free float–adjusted, market capitalization–weighted index that is designed to measure the equity market performance of developed markets. As of September 2017, it includes 23 developed markets country indexes: Australia, Austria, Belgium, Canada, Denmark, Finland, France, Germany, Hong Kong, Ireland, Israel, Italy, Japan, the Netherlands, New Zealand, Norway, Portugal, Singapore, Spain, Sweden, Switzerland, the United Kingdom, and the United States.
MSCI World Enhanced Value Index
The MSCI World Enhanced Value Index represents a subset of securities from the parent index (the MSCI World Index) that exhibit overall value style characteristics relative other securities within the corresponding sector. Characteristics evaluated for inclusion are defined using three variables: price-to-book value, price-to-forward earnings, and enterprise value-to-cash flow from operations.
MSCI World Minimum Volatility Index
The MSCI World Minimum Volatility Index represents a subset of securities from the parent index (the MSCI World Index) that exhibit the characteristics of a minimum variance strategy. It is calculated by analyzing securities within the parent index for lowest absolute risk within a given set of constraints. Constraints can include index turnover limits or minimum and maximum constituent, sector, or country weights relative to the parent index, for example.
MSCI World Momentum Index
The MSCI World Momentum Index represents a subset of securities from the parent index (the MSCI World Index) that exhibit overall characteristics of an equity momentum strategy. It is calculated by analyzing securities within the parent index that reflect high price momentum while maintaining reasonably high liquidity, capacity, and moderate index turnover. Momentum values are calculated using a stock’s recent 12-month and six-month local price performance, and is then risk adjusted to determine a momentum score.
MSCI World Sector Neutral Quality Index
The MSCI World Sector Neutral Quality Index represents a subset of securities from the parent index (the MSCI World Index) that exhibit stronger quality characteristics relative to other securities within the corresponding sector. Characteristics evaluated for inclusion are defined using three variables: high return-on-equity, low leverage, and low earnings volatility.
Cambridge Associates LLC Energy Upstream & Royalties and Private Equity Energy Index
The index is a horizon calculation based on data compiled from 368 energy-related funds (including 92 energy upstream & royalties, 204 US private equity energy, and 72 ex US private equity energy funds), including fully liquidated partnerships, formed between 1986 and 2017. Private indexes are pooled horizon internal rate of return (IRR) calculations, net of fees, expenses, and carried interest.
Cambridge Associates LLC US Venture Capital Index
The Index is a horizon calculation based on data compiled from 1,762 US venture capital funds (1,127 early-stage, 207 late- & expansion-stage, and 428 multi-stage funds), including fully liquidated partnerships, formed between 1981 and 2017. Private indexes are pooled horizon IRR calculations, net of fees, expenses, and carried interest.
MSCI World Value Index
The MSCI World Value Index represents a subset of securities from the parent index (the MSCI World Index) that exhibit overall value style characteristics relative other securities within parent index. Characteristics evaluated for inclusion are defined using three variables: book value to price, 12-month forward earnings, and dividend yield.
MSCI World Growth Index
The MSCI World Growth Index represents a subset of securities from the parent index (the MSCI World Index) that exhibit overall growth style characteristics relative other securities within parent index. Characteristics evaluated for inclusion are defined using five variables: long-term forward EPS growth rate, short-term forward EPS growth rate, current internal growth rate, long-term historical EPS growth trend, and long-term historical sales per share growth trend.
MSCI US Index
The MSCI US Index is designed to measure the performance of the large- and mid-cap segments of the US market. With 617 constituents, the index covers approximately 85% of the free float–adjusted market capitalization in the United States.
Russell 1000® Growth
Russell 1000® Growth Index contains those Russell 1000® securities with a greater-than-average growth orientation. Securities in this index tend to exhibit higher price-to-book and price-earnings ratios, lower dividend yields, and higher forecasted growth values than the value universe.
Russell 1000® Value
The Russell 1000® Value Index contains those Russell 1000® securities with a less-than-average growth orientation. It represents the universe of stocks from which value managers typically select. Securities in this index tend to exhibit low price-to-book and price-earnings ratios, higher dividend yields, and lower forecasted growth values than the growth universe.
Russell 2000® Growth
Russell 2000® Growth Index contains those Russell 2000® securities with a greater-than-average growth orientation. Securities in this index tend to exhibit higher price-to-book and price-earnings ratios, lower dividend yields, and higher forecasted growth values than the value universe.
Russell 2000® Value
The Russell 2000® Value Index contains those Russell 2000® securities with a less-than-average growth orientation. Securities in this index tend to exhibit lower price-to-book and price-earnings ratios, higher dividend yields, and lower forecasted growth values than the growth universe.