China remains top of mind for investors in 2019. Amid the toxic combination of an intensifying trade war with the United States, slowing domestic economic growth, and a weakening currency, China had one of the worst-performing stock markets in 2018.
Despite the uncertainty and negative sentiment toward China, we believe investors should take a more comprehensive and systematic approach to investing in China. Rather than delegating the China allocation to global or EM managers, investors should determine their own desired allocation level and consider adding dedicated China managers in both public and private markets. Further, the public equity allocation should incorporate domestic A-share stocks, either via an A-share mandate or an All-China mandate. 1
Such an approach entails determining the target allocation to China and actively monitoring the actual allocation across the total portfolio (including dedicated China managers, as well as regional or global emerging markets mandates across asset classes). There is no universally appropriate level of China allocation within a portfolio; we believe long-term investors should overweight China relative to its current weight in market capitalization–weighted global equity indexes. This conclusion is based on China’s underrepresentation in global benchmarks, the quality of the public and private manager universe, and appealing public market valuations.
China’s weight and importance in global investment benchmarks likely will continue to rise. Thus, investors need to be cognizant of their overall allocation to Chinese assets and the impact the allocation may have on portfolios (especially their EM allocations).
This publication puts China’s markets into a global context, makes the case for and against dedicated China allocations, and provides guidance on the level of portfolio exposure to China and implementation options.
China’s Growing Importance in Global Benchmarks
China is the second-largest economy in the world, accounting for 16% of global GDP. 2 Yet, at the end of 2018, China accounted for less than 4% of global equity benchmarks and effectively 0% of global fixed income benchmarks. Rather than reflecting the size of China’s domestic markets, this gap reflects limits on foreign investor access, as well as issues regarding free float and liquidity. However, these constraints are set to change given recent reforms aimed at opening China’s domestic markets and decisions by leading index providers to increase China exposure in global indexes.
Public Equities
The majority of China exposure in global equity benchmarks reflects the “offshore” universe of stocks listed in Hong Kong and the United States, not the “onshore” A-share market. By some measures, the A-share market on its own is the second-largest stock market in the world, but it has been largely closed to foreign investors until recently. However, the expansion of the Stock Connect programs 3 and other reforms have greatly improved access, encouraging MSCI in 2018 to incorporate A-shares into the MSCI All Country World Index and MSCI Emerging Markets Index, albeit at tiny initial levels of 0.1% and 0.7%, respectively. Despite the turmoil in the A-share market in 2018, the initial inclusion was deemed a success, with no major implementation issues reported and a near doubling of Stock Connect inflows into the A-share market. As a result, MSCI will further increase the index weight of A-shares over the course of 2019 to 0.4% of ACWI and 3.3% of EM, which was announced at the end of February 2019. 4
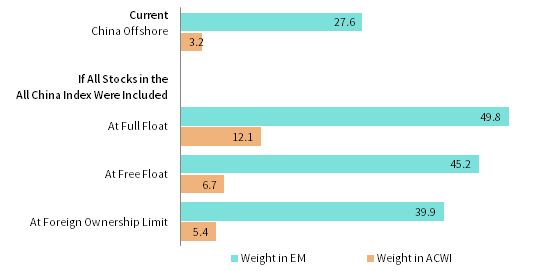
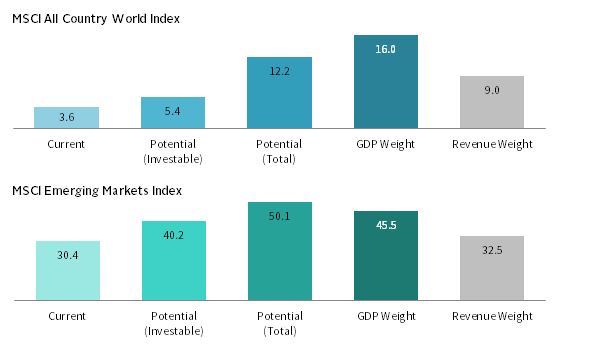
However, these weights represent only a fraction of the A-share market. 5 MSCI estimates that if they included A-shares at 100% of their investable free-float market cap, they would compose nearly 15% of the MSCI EM index (Figure 1). This would boost China’s overall weight in the MSCI EM and ACWI indexes to 39.9% and 5.4%, respectively (including A-shares and offshore listings). These figures could potentially rise further should foreign ownership limits and free-float increase. Based on full market cap, China could be 49.8% of EM and 12.1% of ACWI, although this is unlikely to occur anytime soon given strategic government holdings of A-shares.
FIGURE 1 CHINA AS PERCENT OF MSCI ACWI AND MSCI EM INDEXES
As of December 31, 2018
Sources: FactSet Research Systems, MSCI Inc., Oxford Economics, and Thomson Reuters Datastream. MSCI data provided “as is” without any express or implied warranties.
Notes: Potential (Investable) weight of China equity market is based on the sum of free-float market capitalization of MSCI China Index and MSCI China A International Index. Potential (Total) weight of China equity market is based on the full-float market capitalization of MSCI All China Index. GDP data are in nominal USD terms. GDP weight in the MSCI ACWI chart is based on the Oxford Economics definition of total world GDP.
Fixed Income
Unlike equities, onshore RMB-denominated bonds are currently not included in any major global index, but this is changing soon. The US$8+ trillion market was closed to most foreign investors until the 2016 launch of the China Interbank Bond Market Direct program and the 2017 China Bond Connect program. These programs allow registered foreign investors the ability to trade RMB bonds with no quotas or repatriation restrictions.
In 2018, Bloomberg-Barclays Indexes announced their plan to begin including RMB bonds in the flagship Global Aggregate Bond Index starting in April 2019, with a 20-month phase-in period ending in December 2020, at which point RMB bonds could account for 5.5% of the index, the fourth-largest currency exposure. Rival index providers FTSE/Citigroup and J.P. Morgan are likely to follow suit. As of now, only Chinese government bonds and policy bank bonds are to be included due to the liquidity and quality issues in the rest of the market. The inclusion of RMB bonds should add both extra yield and diversification to global bond benchmarks; their inclusion in EM local currency government bond indexes may be more problematic, since RMB bonds could account for up to 50% of an unconstrained index, potentially changing the risk/return characteristics of the asset class. Thus, most index providers will be offering constrained versions of EM local currency government bond indexes that cap China’s exposure.
Private Investments
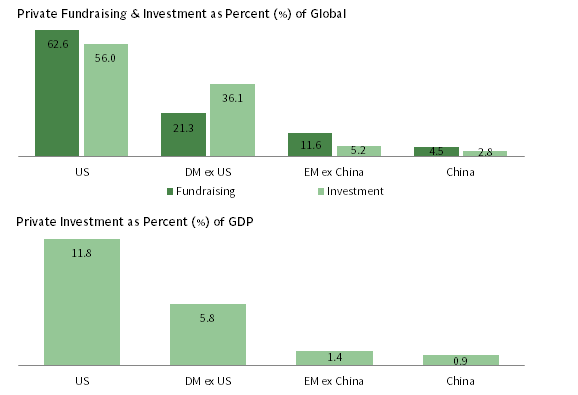
China still accounts for a limited share of private global fundraising and investment (Figure 2). According to data from the Emerging Market Private Equity Association, 6 China-focused PE/VC funds raised US$139 billion from 2008 to 2017; only 4.5% of global fundraising PE/VC fund investment into China (by all funds, not just China-focused) during the period totaled US$114 billion, or 2.8% of global private fund investment and only 0.9% of China’s 2017 GDP. For context, the United States accounted for 62.6% of global fundraising and 56.0% of global investment, which equates to 11.8% of 2017 US GDP. Although it is hard to have confidence in the accuracy of China fundraising and investment statistics (which may not fully capture the rapidly growing domestic private equity industry), it seems reasonable to assume that China private investments are also under-represented in portfolios relative to the size of the opportunity set.
FIGURE 2 GLOBAL PRIVATE FUNDRAISING & INVESTMENT
2008–17
Notes: EMPEA classifies investments into one of three asset classes—private equity, private credit or private infrastructure, and real assets—and into one of the following deal types: buyout, growth, venture capital, PIPE, mezzanine, or debt. Fundraisng share is based on fundraising over 2008–17. Private investment as a percent of GDP is calculated by dividing investment over 2008–17 by 2017 nominal GDP in the respective regions.
How Much China Do You Need?
Overall, most investors are arguably underweight China because of the lack of inclusion in global benchmarks. This is set to change as index providers gradually increase China weightings, given the steady opening of the market to foreign investors. As a result, China’s weight in a global 60/40 equity/bond portfolio could rise from 2.2% today to 5.4% over the next few years. Though the exact timing is uncertain, the trend is clear.
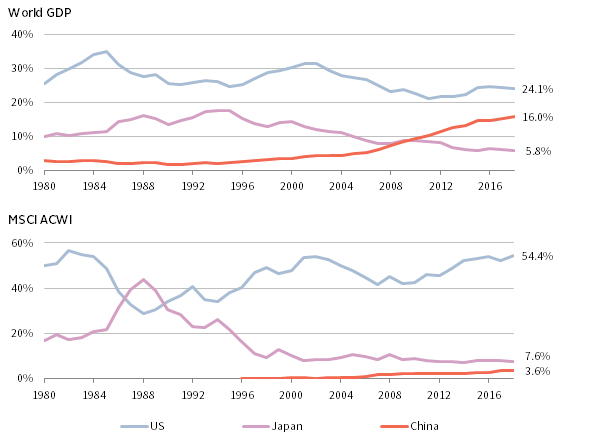
If China is under-represented in global benchmarks and portfolios, how much China do you need? Unfortunately, there is no easy answer. It is tempting to simply look at China’s share of global GDP (16%) and assume it is an appropriate target (Figure 3). However, we strongly advise against using such a heuristic, as there is no link between the size of an economy and its share of global capital markets or of investment portfolios. 7 In fact, the US economy’s share of global GDP has been steadily declining (from 34.9% in 1985 to 24.1% today), but its share of global stock market capitalization has been rising and today stands at 54.4%, compared to an average of 45.4% since 1980.
FIGURE 3 SELECT COUNTRIES’ SHARE OF WORLD GDP AND MSCI ACWI
1980–2018 • Percent (%)
Sources: MSCI Inc., Oxford Economics, and Thomson Reuters Datastream. MSCI data provided “as is” without any express or implied warranties.
Notes: GDP data are in nominal USD terms. World and US GDP as of 2018 are forecasts. China equity data start December 31, 1996, and are based on the MSCI China Index.
In the case of China, looking at the country’s share of global GDP overstates the size of the investable universe. Even on the most optimistic scenario, China’s share of global market cap is only 12.1% (combining onshore and offshore equities and even including shares that aren’t free floating), whereas MSCI data put the investable market cap at 5.4% (reflecting free-float and foreign ownership limits). At the same time, investors need to be aware that portfolios have both direct and indirect China exposure via global company revenues and other economic links to China. For instance, FactSet calculates that China accounts for 9.0% of ACWI company revenues, much larger than China’s 3.6% weight in the index. Increasing direct China allocations without taking into consideration indirect exposure could result in portfolios becoming overexposed to “China risk” broadly defined. This is especially the case for portfolios that might already be overweight EM or natural resources equities, which have stronger links to China. If investors are already meaningfully overweight emerging markets, increasing dedicated China allocations may require scaling back existing EM manager mandates, rather than simply adding direct China managers.
As a result, investors need to look holistically across the portfolio, including global equities, EM equities, hedge funds, and private investments. There is no magic number, but total portfolio allocations to Chinese assets of 5% to 10% seem reasonable, with some portion of this via dedicated China managers. This approach also recognizes that “true” portfolio exposure may be twice as large in light of indirect exposure to China via non-Chinese investments.
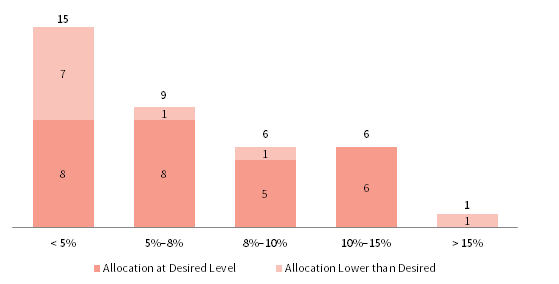
In early 2018, we surveyed 37 major endowment and foundation investors on their total portfolio allocations to Chinese assets on a “look-through basis” across all public and private asset classes and managers. The median allocation was 5.9%, with most respondents having allocations within public and private equity, but limited holdings within hedge funds and fixed income.
The distribution of allocation levels was relatively balanced, with 40% of respondents reporting allocations between 5% and 10%, 40% less than 5%, and 20% greater than 10% (Figure 4). The majority of respondents were happy with their current level. Of those with allocations less than 5%, half wanted to increase their holdings over the next three to five years, with a median stated target of 10%. No respondent at the time wanted to reduce their China allocations.
FIGURE 4 PERCENTAGE OF TOTAL PORTFOLIO INVESTED IN CHINA
2018 • Number of Institutions
Investors interested in incorporating dedicated China managers will need to determine the appropriate allocation for their specific portfolio. Rather than make a decision based on a market’s weight in an index or share of global GDP, allocation targets need to be a function of the opportunity set, valuations, and implementation options.
The Case For Dedicated Target Allocations to China
Even though China’s weight in global benchmarks looks set to rise, we think investors should consider adding dedicated stand-alone China public equity and private investment mandates, rather than relying solely on allocations within global or regional emerging markets mandates. We believe dedicated China fixed income allocations are less compelling today than the other two asset classes discussed.
Public Equities
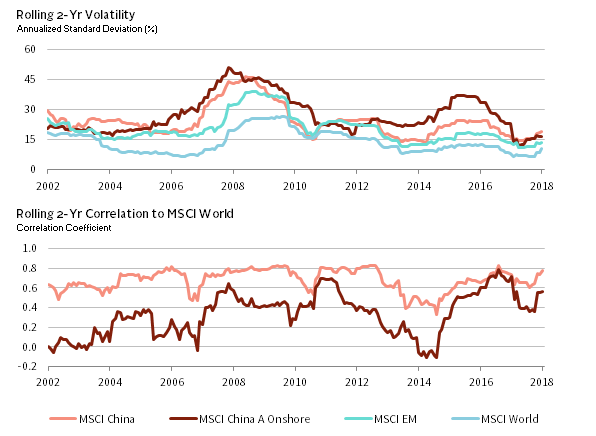
First, aside from the sheer size and breadth of the Chinese public equity market, there is a modest diversification benefit from boosting China allocations. China A-shares are not highly correlated to DM equities and EM equities as a whole, and this is also true for combined onshore/offshore “All China” or “Greater China” mandates. Indeed, at times Chinese equities behave quite differently than global equities. This is due in part to the largely domestic shareholder base, the partly closed nature of the Chinese economy, and different economic/monetary cycles. Thus, while Chinese A-Share equities are volatile, adding dedicated China allocations to portfolios should increase diversification, especially considering the large concentration in global equity indexes and investor portfolios to US equities and the US dollar (the United States accounted for nearly 55% of ACWI at the end of December 2018) (Figure 5).
FIGURE 5 VOLATILITY AND CORRELATION OF CHINA INDEXES
December 31, 2002 – December 31, 2018 • USD Terms
Sources: MSCI Inc. and Thomson Reuters Datastream. MSCI data provided “as is” without any express or implied warranties.
Notes: Data are monthly. Total return data for all MSCI indexes are net of dividend taxes.
Second, China is a market wherein active managers seem to have greater potential to add value. The A-share market is volatile and retail driven, with a large number of listed securities (more than 3,000 if small caps are included). For instance, retail investors compose an estimated 80% of turnover for A-shares and nearly 30% for HK-listed H-shares, but only account for approximately 15% of US trading volume. The scarcity of domestic institutional investors results in greater market inefficiency and dispersion than in other markets, and may boost opportunities for active managers. Yet, unlike 16 years ago when the A-share market first partially opened to foreign investors, today investors can find institutional-quality managers with credible and impressive track records. Of the institutional China A-share managers that were in existence five years ago, 55% went on to outperform their benchmark net of fees over the subsequent five-year period (this compares to five-year success ratios of 16%, 30%, and 52% for actively managed US large-cap, global, and EM mutual funds, respectively).
Third, a valuation opportunity exists today. Chinese equities have been crushed by concerns over slowing growth and the trade war. The A-share market fell more than 35% from its 2018 high and more than 55% from its 2015 peak; valuations are near record lows and at levels that preceded large rallies in the past (Figure 6). A similar story applies to the tech-dominated offshore-listed Chinese equities, which fell nearly 33% from their 2018 highs. Although their valuations are below historical median, they are not as depressed.
FIGURE 6 DRAWDOWN AND VALUATION OF CHINA A-SHARES

Sources: MSCI Inc. and Thomson Reuters Datastream. MSCI data provided “as is” without any express or implied warranties.
Note: Drawdown data are based on price levels in local currency terms.
The earlier arguments are somewhat temporary in nature, meaning there may be an early mover advantage. Valuations will eventually rise, the correlation benefit should fade as foreign investors increase exposure (just as EM-DM equity correlations have shifted higher over the past decade), and an influx of foreign institutional investors may diminish the alpha potential as the market becomes more efficient. However, for the time being, the A-share market will remain largely driven by domestic retail investors, as foreigner investors only account for 3% of the market and an even smaller share of daily turnover. In fact, the A-share market fell steadily over 2018, despite rising foreign flows amid MSCI inclusion. In light of the volatility and risks facing the market, many investors are likely to remain on the sidelines. Overall, we think Chinese equities (both A-shares and All China or Greater China mandates) represent an interesting opportunity for long-term investors, and early adopters may reap benefits from active management.
Private Investments
The arguments are similar for private investments. China provides diversification to global private equity and venture capital portfolios, which tend to be US centric. Furthermore, China private investments offer opportunities and exposures not found in the public markets, especially in technology, healthcare, and consumer investments. At the same time, the pool of institutional-quality managers with compelling track records is deepening, and the venture capital ecosystem in China, in particular, is perhaps second only to the United States. Nonetheless, valuations today are much higher for privates than for public equities (though now cooling, especially in the venture space).
Fixed Income
We are less supportive of dedicated Chinese fixed income allocations, especially for growth-biased investors. Current government bond yields offer little buffer against further RMB depreciation, while hedging costs may reduce returns, especially for non-USD based investors. The credit space (both onshore and offshore) offers pockets of opportunity, but these are better accessed via lock-up vehicles (either private investments or hedge funds), often as part of regional strategies. Indeed, the universe of dedicated pure-play China fixed income and private credit strategies is limited, raising implementation challenges. For these reasons, global bond, EM debt, and Asia private credit strategies are the best avenues to gain exposure to Chinese fixed income and credit. 8
The Case Against Dedicated Target Allocations to China
The case against dedicated target allocations to China stands on three broad legs. The first leg involves the uncertainties facing the Chinese economy, the second deals with the risks facing foreign investors in China, and the third entails the added implementation complexity of dedicated exposures.
Macro Uncertainty
China faces several economic and geopolitical challenges at the moment that may delay or derail the opening of its markets to foreign investors, and that may impair future returns. Concerns include high domestic debt levels, the risk of an economic hard landing, and potential currency devaluation. At the same time, a geopolitical confrontation with the United States could have systemic implications that are not yet fully factored into market valuations. In other words, China may be a “value trap,” much like Japan has been over the post-1989 period.
These risks are real, but we view them as manageable—especially in light of the low valuations on offer in the public markets. Furthermore, because of China’s importance to the global economy, these same risks would likely impact global markets, not just Chinese assets. Yet global equity valuations (and US equities in particular) do not seem to reflect the risks of a macro accident in China, leaving them perhaps just as vulnerable. Regarding the risk of China becoming a “value trap,” only time will tell. But even value-trap Japan has significantly outperformed global equities during several discrete periods over the past three decades, with each burst of outperformance occurring when starting valuations in Japan were low. Furthermore, Japan’s long spell of underperformance followed a period when its size in global benchmarks was quite large (and overstated), rather than low and set to expand. 9
Foreign Investor Risks
Macro risks aside, many investors are hesitant to increase allocations to Chinese assets due to concerns over the Chinese legal system and protections for foreign investors. Specifically, investors worry about financial fraud and the risk of expropriation or assets being “trapped” inside China.
It is true that the quality of corporate disclosure and accounting standards are lower than global norms, and that the Chinese legal system is not transparent or independent. Yet EM investors face similar risks in other jurisdictions, and China continues to take steps to improve the regulation and integrity of its capital markets. 10 We agree that investing in China involves taking on an extra layer of risk, and we view active management as a key way to help navigate a market that is both complex and volatile.
We see expropriation risks as somewhat overblown. Despite the US-China trade tensions, China has not turned hostile to overseas capital and has taken steps to further open its domestic markets and attract foreign investors. As it happens, foreign inflows are needed to help offset the decline in China’s current account surplus and to help support the RMB. If Western economies continue to become more hostile to Chinese capital and block Chinese investors from Western markets, China may be forced to retaliate for domestic political purposes. However, retaliation would likely take the form of forced divestment, rather than expropriation. Expropriation tends to occur in situations where foreign investors own controlling stakes in key domestic companies or industries, or own large amounts of domestic debt. Neither is the case in China, where foreign ownership of assets is low.
Complexity
Finally, adding dedicated allocations to Chinese assets does increase implementation complexity, particularly for investors that typically eschew single-country mandates and prefer global/regional mandates. Considering the current lack of global ex China or EM ex China mandates, adding dedicated China allocations may introduce some overlap with existing manager holdings of Chinese assets, especially as China’s weight in benchmarks (and especially EM benchmarks) grows over time. Many investors will also be reluctant to define a target allocation to a single country, preferring to outsource the sizing decision to existing active managers (both in public and private markets) or let the allocation grow passively via index inclusion.
Although there is no denying the added complexity introduced by adding dedicated China allocations, we do not see this as insurmountable. Many investors have multi-region and multi-manager global equity allocations, and we anticipate more and more investors will move toward incorporating dedicated China allocations in the coming years. Please see Appendix 1: China Implementation for more discussion on implementation considerations.
Putting it All Together
It is true that China faces several economic and political challenges. Yet—despite the negativity and uncertainty facing the country—we see opportunities for long-term investors, especially considering the quality of the manager universe (both public and private) and current market valuations.
China’s weight in global benchmarks is set to rise over the coming years, and today most investors are underweight China relative to its investment opportunity set. As a result, investors should think holistically about their current and future allocations to Chinese assets, looking across long-only, hedge funds, and private investment mandates.
Investors should realize that indirect economic exposure to China is greater than direct allocations to Chinese assets in light of global revenues and economic links to China, the world’s second-largest economy and the largest customer for many companies worldwide.
As a result, we think 5%–10% is a reasonable range of total portfolio allocation to Chinese assets, and reflects the investable opportunity set. Some portion of the allocation to China should be via dedicated China mandates, rather than fully delegated to global or regional emerging markets managers. Indeed, EM ex China mandates may become more common in coming years, as EM indexes become even more dominated by China.
As there is no magic number for how much China a portfolio should have, investors should focus on building allocations where they have the highest conviction in both the investment opportunity and the investment manager.
Aaron Costello, Managing Director
Han Xu, Senior Investment Associate
Appendix 1 China Implementation
Active or Passive?
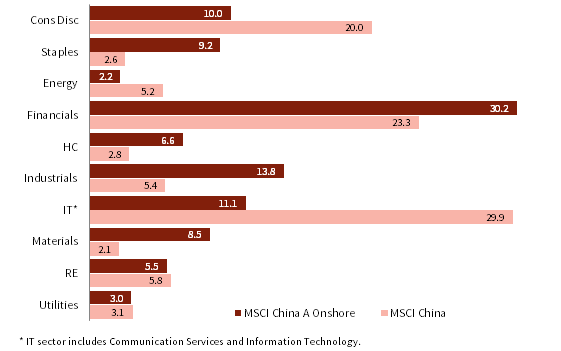
We believe there is a compelling case for implementing dedicated China equity allocations via active management. The A-share market, in particular, is volatile and largely driven by retail investors, which creates a higher dispersion of returns—providing active managers increased room to add (or subtract) value. A-share market indexes are top-heavy and concentrated in banks and industrial State-Owned Enterprises (SOEs) that remain at risk from China’s economic slowdown. Furthermore, fees on passive options remain high, making the fees of active managers more palatable in comparison. However, active managers may lag the market amid big beta-driven rallies (and have done so in the past).
A-shares or All-China?
Both approaches have merits and drawbacks. The case for implementing Chinese equities via A-share-only mandates is that the market is large and differentiated from what is already in the portfolio (i.e., the offshore-listed companies in the MSCI China). It is this segment of the market that will be added to global indexes over time, and therefore is what portfolios are missing. The cons are higher volatility, as well as more exposure to SOEs and industrial companies and less exposure to the tech and consumer sectors that increasingly drive China’s economy. In reality, A-shares offer more exposure to “old China” and less to “new China.” But the higher dispersion and retail-driven nature of this market arguably offer higher alpha potential for managers.
CHINESE EQUITIES SECTOR COMPARISON
As of December 31, 2018
Sources: FactSet Research Systems and MSCI Inc. MSCI data provided “as is” without any express or implied warranties.
All-China mandates (also called Greater China mandates), on the other hand, allow the manager to invest in both the onshore and offshore markets. Investing in both markets offers the broadest opportunity set and allows the portfolio manager to determine whether onshore or offshore equities are more attractive (many companies have shares listed in both markets that trade at different valuation levels). All-China mandates can potentially be less volatile than A-share mandates and may include larger allocations to tech (assuming the manager finds these stocks attractive). The downside is the potential for more overlap with existing allocations via EM/global managers, thus requiring either smaller allocations to the All-China manager or reducing the EM/global managers. All-China mandates may or may not have less alpha potential, since managers have two ponds in which to fish. From a big picture standpoint, if China continues to open its market over the coming years, the distinction between “onshore” and “offshore” should fade. In other words, both the market and index will be shifting toward an “All-China” approach. Thus overlap is unavoidable and allocating to an All-China manager allows the manager the most flexibility in implementing China.
Fundamental or Quant?
There is a recent trend of A-share quant fund launches. The A-share market appeals to quant funds not only because of the large size and liquidity of the market, but also because momentum and sentiment factors may perform better than in other markets, theoretically allowing them to add more value than elsewhere. However, fundamental managers have also added value, and in many cases more so than the quant managers. Why? Because the quants tend to run “beta-one” strategies that stay fully invested and try to match the overall volatility of the market, whereas some fundamental managers tend to exhibit less volatility than the broad market (perhaps due to having greater sector diversification than the index), and have been known to engage in market timing to compensate for the tendency of Chinese equities to overshoot. This was especially the case in 2007 and 2014–15, when the market more than doubled in less than a year, only to then crash. Said differently, fundamental managers are not afraid to hold cash if need be, which may result in lagging during strong up markets, but may help them outperform in down markets and achieve higher compound returns over the cycle. Thus, both fundamental and quantitative managers have been shown to add value in the market. However, many of the new quant strategies results are based on backtests; in contrast, fundamental managers have realized tracked records.
Long/Short Equity Hedge Funds
In theory, long/short equity strategies should fare well in China, given the volatility and dispersion in the market. Historically, short selling was not allowed in the A-share market. Although shorting is now permissible, it remains constrained due to the lack of a robust securities lending framework. Many China long/short funds either use index shorts for A-shares, or focus on the offshore, HK-listed stocks where shorting is very active. As a result, most China long/short funds are, by default, more along the “All-China” spectrum than focused solely on A-shares. Therefore, the universe of institutional-quality China-only long/short hedge funds with credible track records of alpha shorts is limited. However, many well-established Asia-focused long/short funds have large China allocations (focused on the offshore stocks), and this may be a better way to gain long/short exposure to China.
Private Investments
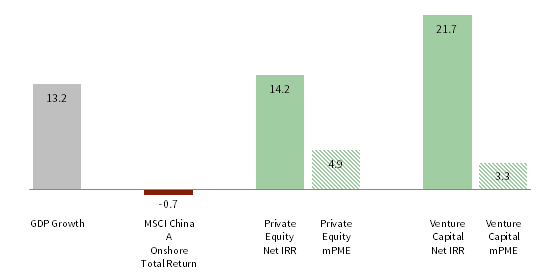
Private investments in China have performed very well over the past decade and have greatly outperformed the A-share market, especially venture capital (VC). One could argue that private investment is a better way to capture China’s economic growth than the A-share market, since the latter is tilted toward the SOE and industrial side of the economy and not the tech and consumer side. On the other hand, valuations have risen in privates, especially venture capital, which implies futures returns may not be as robust. However, the sell-off in public equities has helped take the froth out the VC market, as has the retreat of domestic RMB fund investors; both should help improve the returns for newly committed capital. Indeed, there is a compelling case for dedicated China private investment mandates separate from Asia or EM private investment strategies. As discussed earlier, most investors are under-allocated to China relative to the opportunity set, even as the depth and quality of the manager universe continues to improve. This is especially the case for China venture capital. There is a growing sense that the venture capital world is divided between the United States and China ecosystems. The “Great Firewall of China” 11 has protected China tech startups and created its own ecosystem independent of the United States. At the same time, VC-backed Chinese companies tend to be domestic focused (or focused on the EM universe) and not dependent on sales to the US market, and therefore somewhat insulated from trade tensions. The ongoing slowdown in the economy and signs of stress in domestic credit markets may present more opportunities for private equity and private credit strategies. We also view healthcare as a long-term opportunity in China.
CHINA NOMINAL GDP GROWTH AND ASSET RETURNS
2008–17 • USD Terms • Percent (%)
Sources: Cambridge Associates LLC, MSCI Inc., Oxford Economics, and Thomson Reuters Datastream. MSCI data provided “as is” without any express or implied warranties.
Notes: All figures shown are annualized. Private Equity & Venture Capital performance figures are pooled horizon internal rates of return, net of fees, expenses, and carried interest. The modified public market equivalent (mPME) is calculated using Cambridge Associates methodology based on the MSCI China A Onshore Index total returns net of dividend withholding taxes. The mPME replicates private investment performance under public market conditions. The public index’s shares are purchased and sold according to the private fund cash flow schedule, with distributions calculated in the same proportion as the private fund, and mPME net asset value is a function of mPME cash flows and public index returns. The same public index may have different mPME returns for different private asset classes due to differences in the size and timing of private index cash flows. Total return data for all MSCI indexes are net of dividend taxes.
Appendix 2 A-Share Access Programs
CHARACTERISTICS OF A-SHARE ACCESS PROGRAMS
As of December 31, 2018
Sources: China International Capital Corporation, China Securities Regulatory Commission, China State Administration Foreign Exchange, and HKEX.
Qualified Foreign Institutional Investor (QFII)
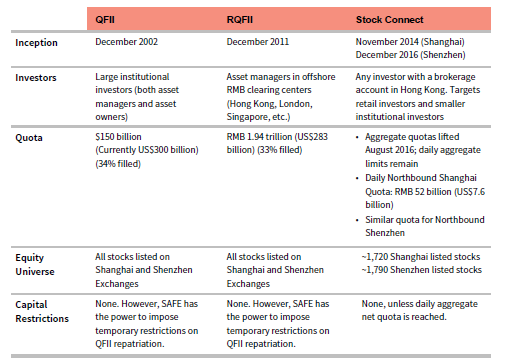
Launched in December 2002, the QFII program is geared toward large institutional investors, both asset managers and asset owners. The aggregate quota has grown from US$20 billion in 2002 to US$150 billion in 2018 (currently US$300 billion). Over 309 licenses have been issued, totaling US$101.1 billion (34% of aggregate quota).
RMB Qualified Foreign Institutional Investor (RQFII)
Launched in December 2011, the RQFII program is geared toward asset managers located in financial centers with offshore RMB clearing (including Hong Kong, London, and Singapore). Regulators have increased the aggregate quota from RMB 20 billion (US$3 billion) in 2011 to RMB 1.94 trillion (US$283 billion) in 2018. More than 233 licenses have been issued, totaling RMB 646.7 billion (US$94.2 billion) (33% of aggregate quota).
In February 2019, the China Securities Regulatory Commission (CSRC) began public consultation on a proposal to combine the QFII and the RQFII programs. The draft rules aim to further expand market access and the scope of allowable investments to include derivatives.
Hong Kong Stock Connect
Launched November 2014, the Shanghai–Hong Kong Stock Connect program allows any investor with a brokerage account in Hong Kong to purchase select A-shares trading in Shanghai. In December 2016, policymakers launched a similar program for the Shenzhen exchange. These programs target retail investors and smaller institutional investors.
Initially, the Shanghai–Hong Kong Stock Connect had an aggregate quota of RMB 300 billion (US$43.7 billion) and a daily quota of RMB 13 billion (US$2 billion) for Northbound (Shanghai) flows. Southbound (Hong Kong) quotas were smaller at an aggregate quota of RMB 250 billion (US$36.4 billion) and daily quota of RMB 10.5 billion (US$1.5 billion). However, in August 2016 aggregate quotas increased for both programs and in May 2018 the daily quotas quadrupled to RMB 52 billion (US$ 7.6 billion). So far, investors have never breached the daily quota for either program (i.e., net inflows/outflows have never been large enough to halt trading).
Appendix 3 How Large Is China’s Equity Market?
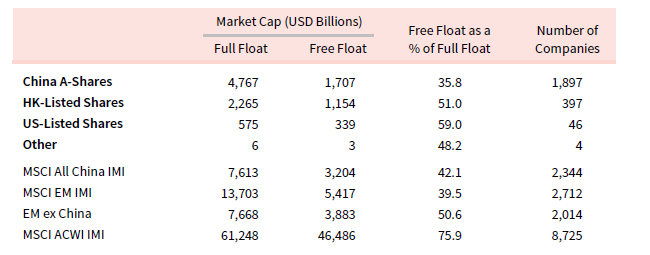
With a full-float market cap of US$4.8 trillion, the domestic A-share market on its own is the second largest stock market in the world. However, looking at the total size of the market overstates the investable size of the market.
By MSCI’s calculation, only 36% of A-share market capitalization is free floating, reflecting the fact that the market is concentrated in SOEs, with most of the shares held by the government. For instance, Industrial and Commercial Bank of China is the largest stock in the A-share market by full float, but is deemed to have a 6% free float, and PetroChina (the second-largest stock) has a 3% free float. In contrast, the free float for offshore-listed stocks is much larger, with Tencent (the largest HK-listed stock) at 60% and Alibaba (the largest US-listed stock) at 50%. Overall, the free float outstanding for the All-China universe is about 42%. This compares to 76% for ACWI and 51% for EM ex China, highlighting that low free float is an issue for EM companies in general.
INVESTABILITY OF THE MSCI ALL CHINA INDEX
As of December 31, 2018
Sources: FactSet Research Systems and MSCI Inc. MSCI data provided “as is” without any express or implied warranties.
Notes: MSCI’s investable market indexes (IMI) capture large-, mid-, and small-capitalization companies. EM ex China is calculated based on MSCI EM IMI excluding Chinese companies.
CONCEPTUALIZING CHINA’S WEIGHT IN MSCI INDEXES
As of December 31, 2018 • Percent (%)
Source: MSCI Inc. MSCI data provided “as is” without any express or implied warranties.
Note: MSCI’s investable market indexes (IMI) capture large-, mid-, and small-capitalization companies.
Free float is important, as it reflects the investable portion of the market and helps prevent distortions in index performance. Stocks with limited free float are arguably more volatile and prone to overshoots; this partially explains the volatility of A-shares, and was also an issue for Japanese stocks in the 1980s, overstating their size in global indexes.
After adjusting for limited free float, Chinese equities as a whole would still have a market cap of US$3.2 trillion, ranking as the third-largest stock market and accounting for 6.7% of ACWI and a whopping 45.2% of EM. Complicating matters is the 30% foreign ownership limit placed on A-share companies. Adjusting for this further reduces China’s potential weight to 5.4% for MSCI ACWI and 39.9% for MSCI EM. Thus, China’s potential share of global market cap shrinks from 12.1% to 5.4% due to free-float and ownership restrictions on A-shares. Still, A-shares have the potential to nearly double China’s weight in global equity benchmarks if the index providers move forward with inclusion.
Footnotes
- For more information on implementation options, please see Appendix 1: China Implementation.
- This is based on 2018 Oxford Economics forecasts of nominal GDP in USD terms. Though some reports cite purchasing power parity–adjusted GDP weights, these are inappropriate to compare to index market-cap weights, which are in nominal USD terms.
- The Shanghai and Shenzhen Stock Connect programs allow foreign investors to purchase select A-share stocks, subject to a daily trading quota. Please see Appendix 2: A-Share Access Programs for further details.
- Specifically, MSCI is including only those A-share companies eligible for purchase via the Stock Connect program. The 2018 inclusion limited each company to only 5% of its investable market cap (i.e., adjusted for free float and the 30% foreign ownership limit for individual A-share companies). The new proposal is to quadruple the inclusion factor to 20% of investable market cap and begin including mid-caps stocks.
- Please see Appendix 3: How Large Is China’s Equity Market?
- EMPEA data include buyout, growth, venture capital, PIPE, and mezzanine/debt funds.
- For instance, markets such as the United States and the United Kingdom have higher stock market weights than GDP weights due to the global nature of their companies (which have large offshore revenues) and the fact that many business chose to tap public markets rather than remain private. The opposite could be said for an economy such as Germany, where despite being an export powerhouse, its stock market weight is lower than its GDP weight because many companies remain private.
- Dedicated Chinese bond allocations may be more appealing to investors that have RMB-denominated liabilities or RMB spending needs or have high conviction in long-term RMB appreciation.
- Japan peaked at 44.1% of the MSCI World Index in 1988, falling to 8.6% today. The large weight reflected both high valuations during the Japanese bubble economy of the 1980s, and the fact that the MSCI indexes were not free-float adjusted until the early 2000s. Thus, Japan’s investable weight in the index was overstated.
- Examples include the recent Foreign Investment Law; consolidation and revamp of various market regulators, allowing foreign credit rating agencies to enter the market; and a general crackdown on financial fraud and market manipulation.
- Please see Robert Fenner, “How Chinese Technology Grew to Rival Silicon Valley,” Bloomberg L.P., August 28, 2018.

