Real Asset Dynamics: PE Energy

It has been difficult to find a more out-of-favor sector in institutional investors’ portfolios than energy over the past five years, and with the recent spread of COVID-19 reducing demand for oil & gas, that reality appears set to continue. While the broad-based downturn in risk assets caused by the pandemic provided a brief reprieve for oil & gas as investors shifted their attention to other challenged asset classes in their portfolios, that period of relief proved fleeting. It was not long before the existing global supply/demand imbalance in oil intersected with widespread travel restrictions and the subsequent Russia-Saudi Arabia oil price war, further pressuring global oil storage capacity and driving WTI futures prices into negative territory for the first time. These developments brought the sector back into investors’ focus and have led many to question when—and possibly if—the oil & gas industry will ever recover.
Although public energy markets faced most of the scrutiny, private markets were not immune from the negative sentiment. During a period when institutions materially increased their allocation targets to private equity (PE), many investors reduced their commitments to PE energy, and some ceased commitments altogether, citing poor performance, outsized exposures, and fossil fuel exposure concerns as key reasons for abandoning the sector. The events of recent weeks are likely to exacerbate investors’ concerns and further weaken sentiment in the oil patch in the near term. In abandoning PE energy for good, however, investors may be neglecting opportunities in the rapidly evolving oil & gas sector, especially as distress is spreading throughout the industry.
Amid the oil & gas sector’s ongoing evolution, the upstream energy PE investment strategy that historically dominated the market has become outdated. This has become even more apparent in 2020, as the managers that gathered the most capital during the shale boom have been among those most challenged by recent volatility. Taking the place of this strategy and the historically dominant managers are emerging managers with opportunistic strategies that contain many elements of sector-specific buyout funds, both in terms of investment approach and return potential. While a nascent segment of the PE energy market, these strategies are best equipped to take advantage of the ongoing disruption in the oil & gas sector.
Shale Boom and the Rise of the “ELOC”
PE energy has held a place in institutional investment portfolios for more than two decades, tracing its modern roots to the late 1980s and early 1990s, when PE funds began raising pools of capital dedicated to investing in privately held energy companies. Among early PE energy firms, the most prevalent investment strategy was the equity line of credit (ELOC) approach, whereby the energy general partner provided third-party management teams—typically comprising experienced oil & gas professionals from established exploration and production companies—with a committed line of equity and a multi-year time horizon to acquire and consolidate assets. Managers committed to 30–40 teams and paid the teams’ expenses while they searched for, underwrote, and acquired acreage positions. If the management team failed to find assets suitable for the fund’s risk and return targets, then the PE manager would rescind the commitment and redirect the remaining undrawn capital to more successful teams.
While early adopters of the ELOC strategy experienced success, it was not until the 2000s and early 2010s that the strategy rose to prominence and helped the PE energy industry grow to its current scale. At the time, persistently high commodity prices, an abundance of fragmented assets, and a strong appetite for drilling inventory enabled PE-backed management teams to acquire undeveloped acreage cheaply, shore up the reserves, and quickly flip the assets to neighboring operators for attractive return multiples and internal rates of return. Limited partners (LPs), by extension, found a viable growth engine for their portfolios, with returns rivaling those of traditional private equity and even venture capital.
2014 Downturn and the Fall of the ELOC
A deep universe of management teams seeking PE sponsorship and the strong performance of ELOC funds of early 2000s vintage years precipitated short fundraising cycles, since thresholds for raising successor funds were based on committed rather than invested capital. Recognizing the strong investor demand for their strategies, PE managers responded by raising increasingly large funds. In 2008, energy fundraising reached a then-record $41.7 billion, creating a larger base off of which managers generated fees and reducing alignment between many GPs and LPs (Figure 1). Fundraising slipped in the years following the Global Financial Crisis, but it ultimately recovered by 2013, when fundraising approached previous highs, with $40 billion in committed capital. At the same time, the founding partners of many PE energy firms grew older and wealthier, giving rise to broad-based succession concerns and exacerbating existing alignment issues.
FIGURE 1 ENERGY FUNDRAISING BY YEAR AND STRATEGY
As of December 31, 2019 • Total Capital • US Dollar (billions)
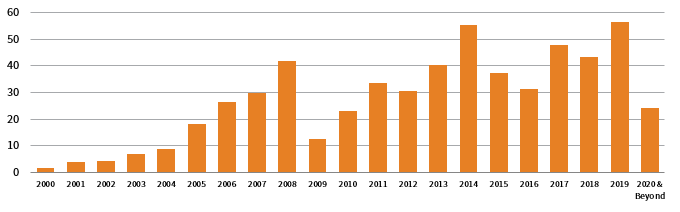
Source: Cambridge Associates LLC.
Notes: Data include funds classified as diversified energy, upstream energy, midstream energy, and energy services. Vintage year is defined as a fund’s legal inception year.
Then, in 2014, oil prices collapsed, signaling the end of the “Land Grab” era. Producers, primarily public ones that had been incentivized to increase production and accumulate inventory at the expense of earning financial returns for investors, were forced to shift their focus away from acreage acquisitions and new drilling programs and toward free cash flow–generating business models resembling those of manufacturing companies. The timing could not have been worse for PE energy managers, which had collected a record $55.2 billion in commitments that year—competition and fund sizes were already increasing on average, as shown in Figure 2, and transactions were more efficiently priced than they were in the early years of the shale boom.
FIGURE 2 ELOC FUND SIZES OVER TIME
As of September 30, 2019 • US Dollar (billions)
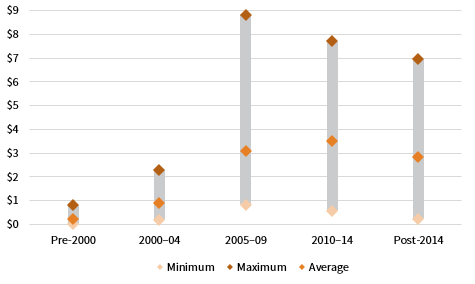
Source: Cambridge Associates LLC.
Note: Fund size data comprise 75 total funds raised by eight equity line of credit energy managers between 1998 and 2018.
The market’s growing efficiency was especially apparent in the largest deals, which many ELOC managers were forced to pivot given their size (Figure 3). With better pricing transparency, it became difficult for managers and their portfolio companies to directly source deals with compelling return profiles at scale.
FIGURE 3 ELOC DEAL SIZES OVER TIME
As of September 30, 2019 • Percent of Deals (%)
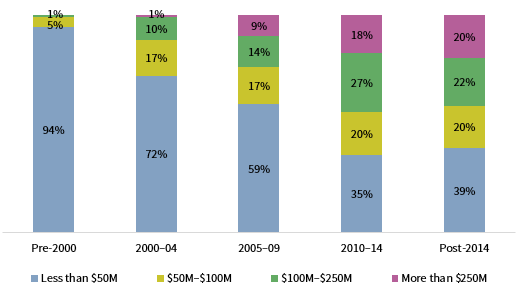
Source: Cambridge Associates LLC.
Note: Investment size data comprise 1,473 investments made by eight equity line of credit energy managers between 1989 and 2019.
Meanwhile, managers still had to fund the overhead of their portfolio company management teams, which deepened funds’ J-curves. Further exacerbating these issues has been a lack of capital markets access for energy companies and investment firms, leading to lengthy capital deployment periods, as shown in Figure 4, and fewer realizations.
FIGURE 4 ELOC MANAGER REPRESENTATIVE INVESTMENT PACE
As of September 30, 2019 • Percent Invested (%)
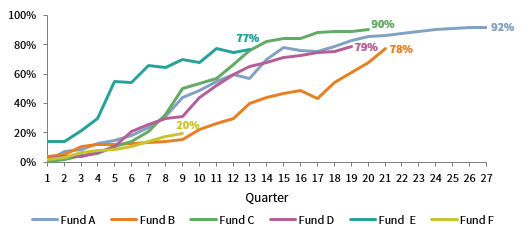
Source: Cambridge Associates LLC.
Note: Data represent cumulative paid-in capital, calculated quarterly, divided by total committed capital for six equity line of credit energy funds raised between 2013 and 2017.
With longer capital deployment periods and fewer realizations, LPs have been left with significant exposures (Figure 5). Additionally, as PE energy deal sizes have increased and as managers have grown more dependent on public energy companies for acquisitions and exits, fund correlations to public equities and commodity prices have risen.
FIGURE 5 PRIVATE EQUITY ENERGY CONTRIBUTIONS, DISTRIBUTIONS, AND NET ASSET VALUE
As of September 30, 2019 • US Dollar (billions)
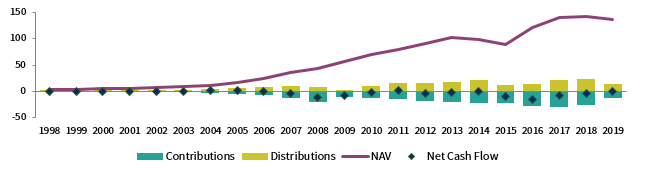
Source: Cambridge Associates LLC.
Note: Net cash flow is calculated as distributions minus contributions.
What impact have these dynamics—longer, deeper J-curves, closed capital markets, limited realizations, and higher correlations to public markets and commodity prices—had on PE energy returns? They have weighed materially on performance. Specifically, for the 184 mature and maturing funds with vintage years between 2004 and 2014, performance on average lagged broader PE returns by 0.56x on a net multiple on paid-in capital basis (MOIC), as shown in Figure 6. Large, mid-2000s vintage year and pre-2014 downturn vintage year ELOC funds have felt considerable pain, with returns of 34 2006–08 vintage year funds trailing broader PE funds by 0.57x on average, and the returns of 19 2013 and 2014 vintage year ELOC funds lagging broader PE by an average 0.40x. Such an extended period of underperformance has tested the resolve of most PE energy investors, leaving many to wonder whether the industry—and the strategy that lifted it to prominence—will fully recover and once again earn a position in PE portfolios.
FIGURE 6 ENERGY ELOC AND ENERGY NON-ELOC PERFORMANCE
As of September 30, 2019 • Net MOIC
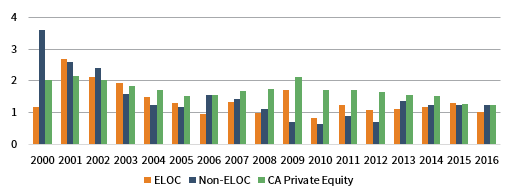
Source: Cambridge Associates LLC.
Note: Data include 115 ELOC funds, 122 non-ELOC funds, and 1,586 global private equity funds raised between 2000 and 2016.
New Way to Play Private Equity Energy: Energy Buyout Funds
Today, the buy-and-flip model is outdated. Yet, opportunities do exist in PE energy, despite the challenges facing the industry. A new breed of managers, which we categorize as energy buyouts, borrow techniques from traditional buyout managers. They add value to portfolio companies by pulling on multiple levers including acquisition discounts, operational efficiency improvements, financial restructuring, and cost cutting. While traditional buyout funds rely heavily on leverage to acquire companies, energy buyout funds typically make limited use of debt. They are smaller and more concentrated than ELOC funds; moreover, energy buyout managers lead all facets of the investment process in-house, unlike ELOC managers that outsource asset underwriting and operations activities to portfolio company management teams.
Energy buyout managers’ structuring and operational expertise, combined with their portfolio company involvement, provide a crucial competitive advantage across sourcing, diligence, and execution relative to ELOC managers. Buyout managers are also better suited to pursue and execute complex deals than ELOC managers, which must go through several layers of decision making, potentially hampering investment execution and extending capital deployment pacing. Value-focused buyout managers need to accept some complexity, which enables them to act quickly and decisively on attractive opportunities, often leading to more rapid capital deployment (Figure 7).
FIGURE 7 REPRESENTATIVE INVESTMENT PACING OF INDIVIDUAL ENERGY BUYOUT AND ELOC FUNDS
As of December 31, 2019 • Paid-In Capital Percentage (%)
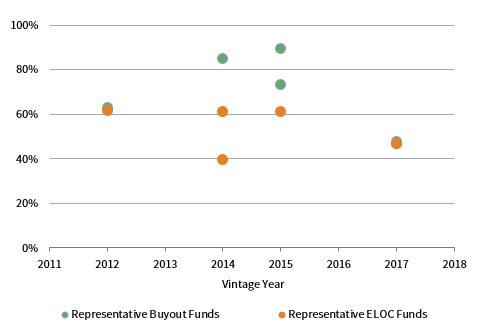
Sources: Cambridge Associates LLC and manager-provided financial statements.
Notes: Each bubble represents a single fund from the relevant vintage year that employs the given investment strategy (Buyout or ELOC). Paid-in capital percentage reflects contributions divided by total fund commitments. For funds with vintage years 2015 or earlier, paid-in capital percentage represents total contributions as of the 12th quarter after the fund’s first capital call divided by total fund commitments. For funds with vintage years 2016 and later, paid-in capital percentage represents total contributions as of fourth quarter 2019 divided by total fund commitments. No data are included for 2011, 2013, 2016, and 2018 because there were no buyout funds raised during these vintage years.
Furthermore, because energy buyout funds pursue direct acquisitions and do not fund management teams while they find assets to buy, they do not suffer the same overhead drag as ELOC strategies. Faster deployment and the lack of overhead expenses are both accretive to net returns. Finally, and most crucially, buyout managers’ smaller deal sizes are easier to eventually exit, since they can sell up market to a broader pool of market participants.
Positioned for Success in the Current Market Environment
Maintaining structuring and operational capabilities in-house should prove critical over the next several years. As the impacts of COVID-19, the Russia-Saudi Arabia oil price war, and the prevailing supply/demand and storage challenges ripple through the industry, the opportunity set in oil & gas will likely shift away from traditional acreage acquisitions and toward time-sensitive transactions such as distressed acquisitions, restructurings, and rescue financings. Energy buyout managers are uniquely positioned to capitalize on these opportunities given their ability to marry structuring and operational capabilities. Since the 2014 downturn, these managers have actively acquired distressed assets at steep discounts to proven developed reserves (PDP) value and turned them into cash-generating businesses, providing some proof of concept for the approach they will employ in the current market environment.
Furthermore, these managers have reduced downside in their existing portfolios by using minimal leverage and instituting robust hedging programs, when prices permit. These attributes, along with their limited reliance on asset sales to drive returns, will allow buyout managers to withstand an extended downturn. That is not to say that these funds will not experience drawdowns within their existing asset base, because they will. These funds will also need to grapple with long-term, industry-wide threats, such as stranded asset risk and increased commodity price risk, as renewable energy sources continue to gain traction globally and reduce aggregate demand for fossil fuels. As with any strategy, there will of course be performance dispersion among buyout managers, highlighting the importance of manager selection. However, the portfolios of a subset of these managers will remain better positioned relative to the broader industry in the current and future environments, enabling certain buyout managers to spend more of their time capitalizing on market distress and less time on managing turbulence in their own portfolios.
Conversely, ELOC managers are ill-equipped to weather the current environment. Because ELOC managers increasingly depended on public markets for exits as their fund sizes grew, they were often forced to accept stock instead of cash as part of sale agreements. Many funds continue to hold these public equity positions, which have declined in concert with the broader oil & gas equity markets over the past five years and even more so in recent months. As a result, these funds are materially writing down their portfolios in 2020. In addition, many of these funds’ large portfolio companies remain over-leveraged, leaving them exposed to significant bankruptcy risk, which will put further downward pressure on valuations. Given these challenges, ELOC managers will need to spend their time—and their dry powder—focusing on managing their existing portfolios rather than pursuing new investments.
Where Do Energy Buyout Funds Fit in Portfolios?
Just as the implementation options for PE energy investors have evolved, so have the roles these investments play in institutional portfolios. Energy buyout funds are particularly versatile. These strategies can generate PE-like returns due to their focus on smaller, complex deals that offer attractive entry pricing; thus, investors can use energy buyout funds as growth drivers in diversified private equity portfolios. Additionally, energy buyout funds still offer exposure to commodity prices, though to a lesser extent than ELOC funds since the success of portfolio companies depends more on restructuring initiatives and operational improvements than on a recovery in oil & gas prices or access to capital markets. Therefore, buyout funds also remain appropriate for real assets–specific portfolios.
ELOC funds, on the other hand, have proven less adaptable. As return expectations have declined, and as correlations with public markets and commodity prices have increased, these funds have become more suitable for investors seeking pure natural resources exposure. In other words, ELOC funds have become a beta option in today’s market, whereas they previously served as a return driver given their emphasis on high-growth—and high-risk—investments (Figure 8).
FIGURE 8 ENERGY BUYOUT AND ELOC FUND ROLES IN PORTFOLIOS
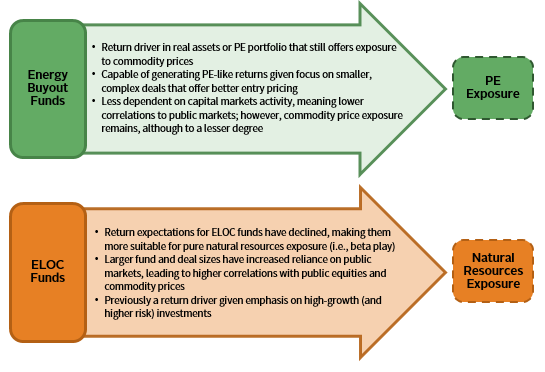
Source: Cambridge Associates LLC.
Correlations to public markets and commodity prices—both above 0.7 since 2013, as shown in Figure 9—are likely to remain elevated for many large ELOC funds, since some continue to take positions in publicly traded companies, and most that sell portfolio companies to public competitors have been forced to accept the buyer’s stock rather than all cash. Stock-based transactions will not only increase private funds’ correlations to listed equities, but also increase these funds’ volatility, as oil & gas stock prices continue to fluctuate meaningfully in the public markets.
FIGURE 9 PE ENERGY ELOC FUND CORRELATIONS WITH PUBLIC INDEX mPMEs
As of September 30, 2019
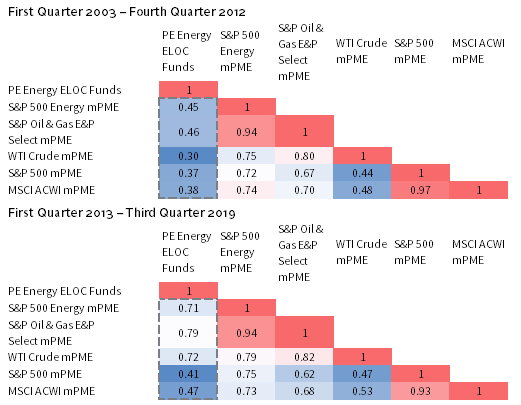
Sources: Cambridge Associates LLC, MSCI Inc., New York Mercantile Exchange, Standard & Poor’s, and Thomson Reuters Datastream. MSCI data provided “as is” without any express or implied warranties.
Notes: Correlations are based on quarterly returns. The PE Energy ELOC Funds universe includes the returns of 9 to 107 funds based on quarterly data availability. Cambridge Associates’ modified Public Market Equivalent (mPME) is an in-house methodology that provides a private to public comparison framework that replicates the private investment reference fund under public market conditions (per a given index). Under mPME, actual private contributions are invested in the given public market index and distributions are calculated in proportion as in the private investment reference fund, with the corresponding NAV a function of the mPME cash flows. S&P 500 Energy, S&P Oil & Gas E&P Select, WTI Crude, S&P 500, and MSCI ACWI mPMEs are calculated using the cash flows of the PE Energy ELOC Funds universe. WTI Crude represents near month futures.
Implementation Impediments Exist
Despite the compelling elements inherent in energy buyout strategies, they are subject to certain risk factors and limitations. First, many of the managers are still emerging. This means that their businesses may not be stabilized yet and that their stand-alone track records might be limited or contain few exits. Second, these managers typically seek to maintain small fund sizes, reducing their scalability in individual investor portfolios. Finally, most of these managers have already established loyal investor bases, meaning capacity for new investors is likely limited.
In summary, investors can still access compelling returns in PE energy despite prevailing headwinds, though doing so requires a new approach. While ELOC funds can still provide valuable exposure to commodity prices, energy buyout strategies are best suited to take advantage of the evolving oil & gas industry and generate strong absolute returns, especially as distress permeates the market in response to COVID-19, the Russia-Saudi Arabia oil price war, supply/demand imbalances, and storage capacity issues. These modern strategies can play several roles in institutional portfolios, making them particularly attractive to investors seeking to maintain commodity exposure while still generating returns commensurate with traditional private equity. Although structural limitations exist, and though manager selection remains paramount, investors should consider allocating capital to this emerging segment of the energy PE market.
Index Disclosures
S&P 500 Energy Index
The S&P 500® Energy Index comprises those companies included in the S&P 500 that are classified as members of the GICS® energy sector.
S&P Oil & Gas Exploration & Production Index
S&P Select Industry indexes are designed to measure the performance of narrow GICS® sub-industries. The index comprises stocks in the S&P Total Market Index that are classified in the GICS oil & gas exploration & production sub-industry.
WTI Crude Index
West Texas intermediate (WTI), also known as Texas light sweet, is a grade of crude oil used as a benchmark in oil pricing.
S&P 500 Composite Stock Price Index
The S&P 500 Composite Stock Price Index is a capitalization-weighted index of 500 stocks intended to be a representative sample of leading companies in leading industries within the US economy. Stocks in the index are chosen for market size, liquidity, and industry group representation.
MSCI All Country World Index
The MSCI ACWI is a free float–adjusted, market capitalization–weighted index designed to measure the equity market performance of developed and emerging markets. The MSCI ACWI consists of 46 country indexes comprising 23 developed and 26 emerging markets country indexes. The developed markets country indexes included are: Australia, Austria, Belgium, Canada, Denmark, Finland, France, Germany, Hong Kong, Ireland, Israel, Italy, Japan, the Netherlands, New Zealand, Norway, Portugal, Singapore, Spain, Sweden, Switzerland, the United Kingdom, and the United States. The emerging markets country indexes included are: Argentina, Brazil, Chile, China, Colombia, Czech Republic, Egypt, Greece, Hungary, India, Indonesia, Korea, Malaysia, Mexico, Pakistan, Peru, Philippines, Poland, Qatar, Russia, Saudi Arabia, South Africa, Taiwan, Thailand, Turkey, and the United Arab Emirates.
About Cambridge Associates
Cambridge Associates is a global investment firm with 50+ years of institutional investing experience. The firm aims to help pension plans, endowments & foundations, healthcare systems, and private clients achieve their investment goals and maximize their impact on the world. Cambridge Associates delivers a range of services, including outsourced CIO, non-discretionary portfolio management, staff extension and alternative asset class mandates. Contact us today.