Role Models: Pensions Can Use Data to Optimize PI Allocations

Tapping private markets in search of added returns is common practice among defined benefit pensions and other institutional investors. However, many pensions still avoid private investments (PI) out of fear that long-term capital lockups could elevate liquidity risk. Some also remain alarmed by the potential consequences of the “denominator effect.” This refers to situations in which total portfolio value decreases as a result of public market corrections, while private asset valuations lag, causing the PI sleeve of the portfolio to be above its target allocation.
Ultimately, overestimating liquidity risk and the denominator effect can prevent pensions from fully optimizing their portfolio’s return potential. This paper aims to help pension executives better understand how data can enable their effective use of PI. It also discusses how new investment policy approaches may help to take advantage of market opportunities and minimize the risk of portfolio stress when down markets occur.
Following the Data
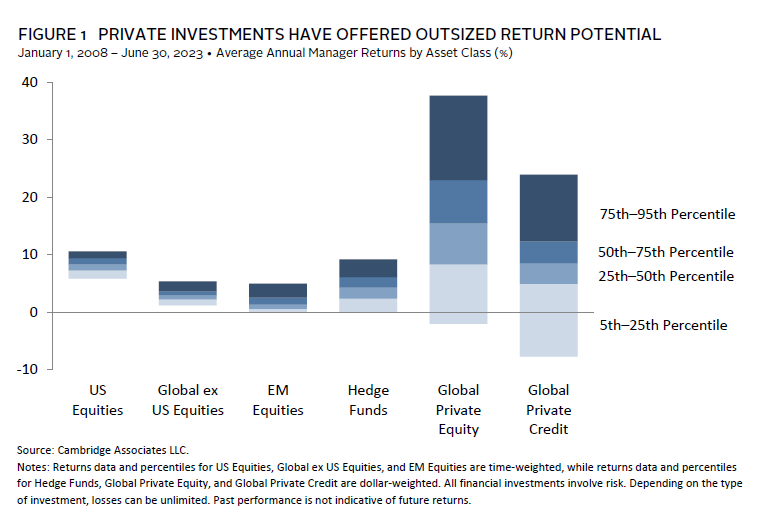
It is no secret that investing in private markets can add considerable portfolio value. Investors that have allocated to these asset classes over the long term have tended to outperform investors holding only public asset classes. And investors that managed to allocate primarily to top quartile PI managers have tended to perform even better (Figure 1).
As pensions consider PI investments, data analysis based on historical returns for private markets can help them make more informed decisions. This analysis can yield insights about how PI allocations have previously behaved across different market environments.
For example, when a crisis scenario hits, private markets are expected to react. But in reality, the severity and duration of these market reactions are not instantaneous or uniform. In crisis conditions, private market asset values and cash flow generation can decrease—but contributions can also decrease—as asset managers have fewer investment opportunities. In the years immediately following a crisis, exit opportunities present themselves and PI-buying opportunities emerge, albeit typically with lower returns than a more normal market environment.
Figure 2 compares contributions and distributions from a sample private equity fund in hypothetical base-case, crisis, and boom environments. It shows how different market situations can impact the timing of capital calls by fund managers, as well as when capital is returned to investors. Contributions are deferred in crisis scenarios as managers typically wait until opportunities present themselves, while capital is often called quickly in boom scenarios. In both environments, it is typical for most capital commitments to be called by the manager over the total investment horizon. Conversely, distribution trends track nearly parallel for all three scenarios, echoing the returns of the public market. 1
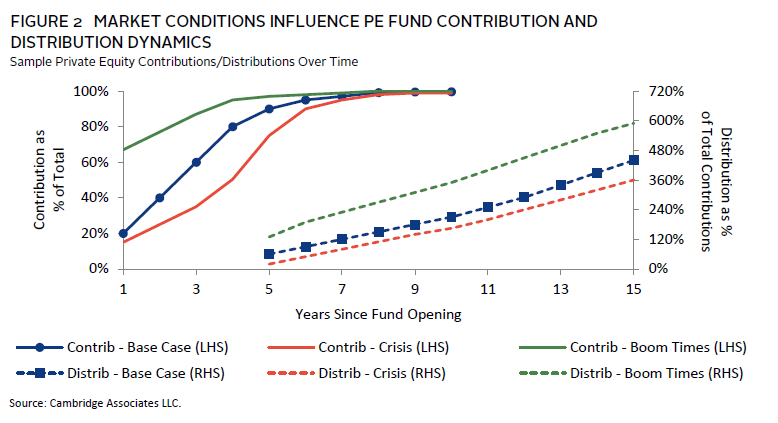
Putting it all together, whenever a crisis ensues, public market portfolios are immediately affected, but the value of a PI portfolio lags because valuations occur less frequently. Furthermore, private markets will call and return capital more slowly. In order to fully understand and interpret the potential impact of PI investments on pension portfolios, this complex web of inputs and outputs requires careful analysis.
Modeling an Investment Portfolio
Liquidity is a key factor for pensions investing in the private market, but at what level does the lack of liquidity cause serious risks to the pension? Figure 3 paints a broad picture of liquidity risk as a function of net distributions. In this case, net distributions is the percentage of outflows required to pay benefit payments and expenses, minus contributions.
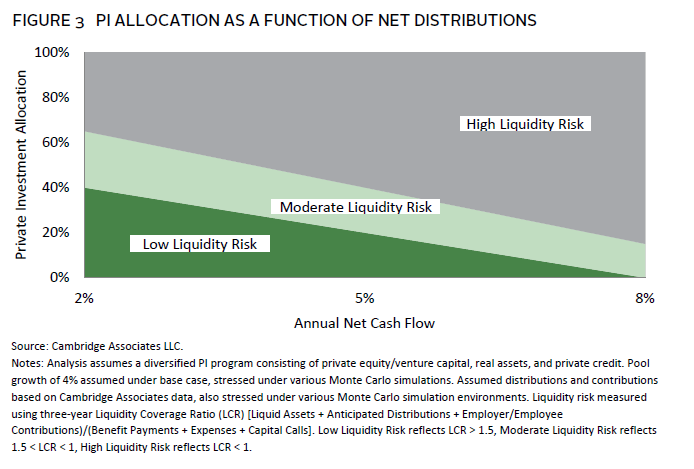
Using this simple framework is an effective way to consider the appropriate PI allocation for a pension. However, it’s important to note that because each pension’s risk and payment profile is unique, more detailed and bespoke modeling may be necessary. This is particularly true for those that intend to invest heavily in the PI market.
Modeling can also help to inform PI allocation dynamics over time. Figure 4 demonstrates a potential PI allocation path for a sample pension. In this example, the pension has a 25% target allocation to privates, is currently paying out 5% of assets per year in benefit payments, has benefit accruals equal to 1% of pension liabilities, and is currently above PI target by 5% due to recent market movements. 2
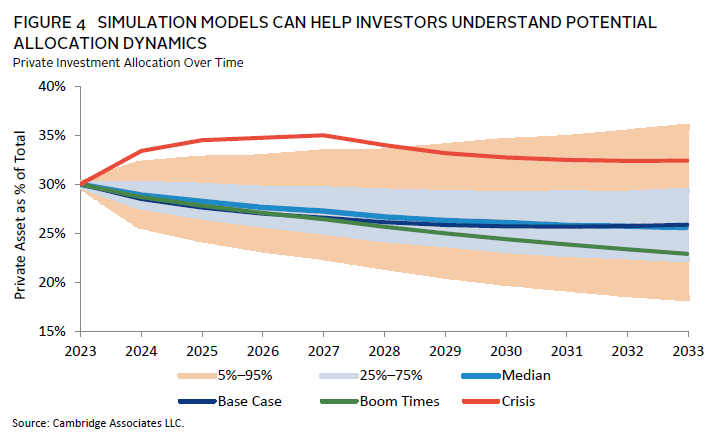
Here, it makes sense to start with a micro view of the assets to ascertain expectations under base-case, boom, and crisis scenarios to inform a more refined application that allows a broader range of randomness like a Monte Carlo simulation model. 3 The simulation model cannot be created without the scenario modeling.
In addition to forecasting potential PI portfolio dynamics, simulation modeling analyzes the non-PI portfolio, the liability plan profile, and broader capital market forecasts. The resulting “cone of doubt” in Figure 4 is based on 5,000 return simulations, with PI values informed by the three market scenarios discussed above. As in Figure 3, models such as this can provide a view to the potential liquidity risk inherent in the pension.
In this example, the model suggests an 81% probability that, in ten years, the PI allocation percentage will be less than where it is today. Furthermore, in the few future scenarios where the portfolio exceeds 35% in privates by 2029, there is a 71% likelihood that the proportion of PI in the portfolio will then decrease. These metrics suggest that the likelihood of a liquidity crisis is low—even in a stressed market environment—as is the risk that the portfolio will be overweight PI for a prolonged period. Thus, if an investor is willing to accept an elevated allocation to privates in the near term, then a decrease in private asset commitments, or a sale of private assets at a discount in the secondary market, is unnecessary.
Reconsidering PI Ranges
It is typical for pensions to express predefined thresholds for allocations within their investment policy statement (IPS). A well-constructed IPS dictates boundaries across all asset classes and informs decision making related to trading and rebalancing. However, in the case of a PI portfolio, there are few ways to remedy an overallocation in the near term. As Figure 4 shows, even in a simulation model where the IPS boundaries are breached, an overallocation to PI is unlikely to remain above the threshold for long—and unlikely to cause a lasting liquidity crunch. These scenario projections can help bolster confidence on the part of pension executives, demonstrating that there is enough liquidity in their portfolio and that their allocation is likely to return to their IPS range over time. While the above depicts a sample case, scenario modeling such as this can be customized to specific situations.
Governance and Target Ranges
The topic of IPS ranges brings up the question of what boundaries are necessary for pensions with PI allocations. In fact, it can be optimal to create two sets of boundaries. The first is a soft guideline that, when breached, flags that the allocation is above target and action may be necessary. A second set of boundaries can be used to demarcate the point at which immediate action is warranted. When setting these two boundary ranges, it is important to note that the larger the target of the private allocation, the broader the ranges should be. For example, a 5% boundary on a 10% allocation may be reasonable but is most likely insufficient for a 25% allocation.
What If?
When pensions find themselves in the middle of a market crisis, it can be difficult to stay rooted to analysis conducted during a calmer period. However, it is at this precise moment that a pension executive’s investment decisions can lead to the largest swings in PI value. For plans looking to sell in the secondary market to lower their illiquid allocation, the lost value is clear—their holdings will sell at a deep discount, locking in losses. However, for those interested in cutting commitments to new funds, outcome analysis depicts murkier results.
For example, what if decision makers overseeing the sample pension described earlier determine that the continued risk of the private allocation increasing is too high and move to cut their next three years of commitments by half? What amount of change can they expect in asset values? These questions can be answered using further simulation modeling, but the general outcome is that the pension has more surety of the liquidity profile at the expense of lower returns.
Looking back at Figure 1, a top quartile private equity performer may outperform the US equity market by ~15% per annum and—assuming a one-time, three-year decrease in commitments—the impact to the pension is a net decrease in assets of ~2%. 4
Model Outcomes
Scenario modeling of PI holdings can yield a crucial takeaway for pension executives: don’t fear the denominator effect. While the magnitude of this effect is conditional on a portfolio’s broader allocation strategy, analysis suggests that, overall, it is an uncommon and typically short-lived phenomenon. Pensions with an effective investment governance framework that build a PI portfolio tailored to their investment objectives can use modeling to strengthen their conviction in the ability of optimized PI allocations to deliver stronger portfolio returns without imposing too much additional risk. Pension executives can also use scenario modeling to better assess how to balance their pension’s liquidity requirements against PI growth opportunities as they work to meet their investment objectives over time.
Footnotes
- This is a summary of broad private equity and does not detail any other private asset classes that have a shorter or longer investment horizon. Those separate private assets have a similar contribution/distribution profile.
- For the sample simulation, a 60/40 portfolio consisting of asset class targets 25% equities; 10% hedge funds; 40% long government/credit; 10% private equity; 10% private credit; and 5% real estate. The PI portfolio is assumed to be mature and returning 25%–30% of capital committed, while continuing commitments to target the 25% target weight.
- A Monte Carlo simulation model seeks to predict the probability of a variety of outcomes when the potential for random variables is present.
- It is assumed that commitments decrease by ~2.7% of total assets and that the capital is drawn over six years and returned by year 13 with a total DPI of 2.6x.
About Cambridge Associates
Cambridge Associates is a global investment firm with 50+ years of institutional investing experience. The firm aims to help pension plans, endowments & foundations, healthcare systems, and private clients achieve their investment goals and maximize their impact on the world. Cambridge Associates delivers a range of services, including outsourced CIO, non-discretionary portfolio management, staff extension and alternative asset class mandates. Contact us today.