Improving Investment Returns: Manager Sizing With Active Risk

Monitoring concentration in investment managers is an important component of portfolio risk management. Building any portfolio requires a view on position sizing and a thoughtful approach could improve long-term results. Investment committees and trustees agree—a 2018 survey conducted by Cambridge Associates found that nearly two-thirds of respondents had a guideline on manager concentration. 1 Evaluating manager sizing as a percentage of capital is a popular and common approach. While portfolio-level analysis on liquidity, beta, and volatility are frequently monitored, a minority of investment teams in our experience use active risk to size managers. By considering the return profile of a manager along with its size in the portfolio, active risk provides additional insight to risk management decisions, helps build better portfolios, and contributes to better governance.
What is Active Risk?
Any discussion of risk allocation also requires beliefs about the potential excess return of each choice, whether it’s between asset classes or managers. We assume that the investor has beliefs about the expected excess returns of each strategy, an estimate of that manager’s skill, that is dubbed “conviction.” Depending on an investor’s conviction in a manager, she may adjust the position size to increase or decrease the active risk of that position. How an investor arrives at a conviction for each decision and refines that conviction level over time is outside the scope of this paper.Active risk represents the potential impact on the performance of a portfolio relative to a policy benchmark. 2 This captures both the size of a position and its historical tracking error (or standard deviation of excess returns). For example, a passive index fund designed to replicate an index would have a tracking error close to 0, as the investment closely mimics the benchmark. A concentrated active manager may have a higher tracking error, as its returns may be significantly different from that of its index. Active risk combines both tracking error and sizing in the portfolio, to quantify a potential impact on relative returns in basis points (bps). A manager exhibiting a tracking error of 8% and sized at a 2% position in a portfolio would generate 16 bps of active risk.
Active Risk in Action
A common implementation of managers within an asset class is the traditional core-satellite approach, with a passive or highly diversified core manager receiving the majority of capital and smaller satellite positions in active, more concentrated investments pursuing a range of different strategies. It’s common that the satellites are similar in size; we call this approach the “equal-weighted” portfolio. In contrast, another approach is to size active risk equally across these satellites so the equal conviction in managers translates to similar performance impact to the total portfolio.
Let’s see this applied to a portfolio that is 70% invested in public equities and 30% invested in fixed income, focusing on just the 40% invested in US equities. Let’s assume that the investment team has equal conviction in five satellite managers, which are labeled according to their predominant style (e.g., “small-cap growth”). In Figure 1, we highlight how the equal conviction in the five satellite US managers may be reflected in portfolios using both equal-weighted and risk-weighted approaches.
FIGURE 1 MODEL PORTFOLIO AND REPRESENTATIVE US EQUITY PORTFOLIOS
% of Portfolio
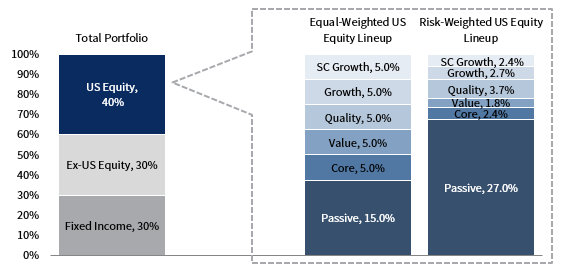
Sources: Cambridge Associates LLC and MSCI Inc. MSCI data provided “as is” without any express or implied warranties.
Note: The MSCI US Index was used to calculate the active risk for weighting the managers/strategies in the Risk-Weighted US Equity Lineup.
Based on our assumptions of tracking error and using actual manager returns, we expect the equal-weighted line-up to deliver 148 bps of active risk, 3 which is more than double the amount of risk we would expect the risk-weighted approach to contribute (Figure 2). The Value satellite in the equal-weighted lineup has 67 bps of active risk, compared to 31 bps for the Quality satellite. As a result, the Value satellite will likely have a larger impact on the relative returns, which is inconsistent with the equal conviction in the two managers. In contrast, the risk-weighted portfolio adjusts the size of each manager so that each has a similar impact on relative performance.
FIGURE 2 ALLOCATION AND RISK COMPARISON
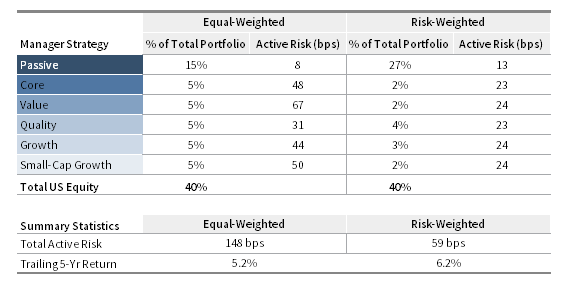
Sources: Cambridge Associates LLC and MSCI Inc. MSCI data provided “as is” without any express or implied warranties.
Notes: Active risk and trailing five-year annualized compound returns are as of March 31, 2020, and are based on monthly data net of fees. Active risk is based on 24 months of returns, exponentially weighted, and represents active risk due to manager selection only. Return streams of each lineup assume monthly rebalancing to portfolio weights in Figure 1.
Active Risk Shortcomings
Investors should understand the limits of active risk and all portfolio management tools used. The first is a simple one—an investor must build a different portfolio to generate excess returns. That is, active risk is not a quantity to minimize, but instead one of many tools to manage risk and to help ensure that risks taken are intentional and commensurate with return. Secondly, portfolios with high allocations to private investments require other tools because private investment valuations follow a different frequency and methodology.
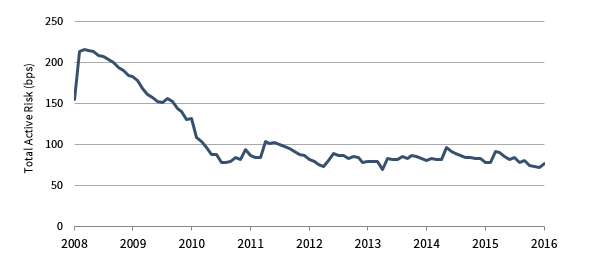
In addition, active risk is sensitive to recent performance and can shift materially over a short period of time, especially in periods of heightened market volatility. At the manager level, investors should not trim or add to a position based solely on historical tracking error, but instead view recent performance and active risk in context of return and conviction, current opportunity set, and time horizon for the position. At the total portfolio level, investors could build intuition by back testing the portfolio through a crisis period. Figure 3 shows that an actual portfolio’s total active risk remains bounded around 75 bps. However, the same portfolio would have experienced a spike to more than 200 bps active risk during the 2008–09 global financial crisis period.
FIGURE 3 SAMPLE ACTIVE RISK BACK TEST
December 31, 2008 – December 31, 2016 • Historical Total Portfolio Risk Over Time
Sources: Bloomberg Index Services Limited, BofA Merrill Lynch, Cambridge Associates LLC, Frank Russell Company, Hedge Fund Research, Inc., MSCI Inc., and Standard & Poor’s. MSCI data provided “as is” without any express or implied warranties.
Notes: Data represent actual historical active risk data for a portfolio, as of December 31, 2016. The active risk at each time point uses the same manager roster and weights. Any manager that lacks historical returns is backfilled with index returns.
Applications of Active Risk
Using active risk when sizing managers has other benefits, such as providing a consistent investment process to be applied across investment portfolios and allowing more transparent stakeholder management.
Improving Returns. Assuming investors have skill in picking managers, the practice of aligning both risk and capital with conviction will generate excess returns over the long term. Active risk can help investment teams in this process to ensure that the highest conviction ideas across the portfolio are sized appropriately. For example, there is not an easy way to compare the relative risk of a fixed income manager to that of an equity manager when solely examining the amount of capital invested. Applying an active risk lens, a fixed income manager could potentially be sized much bigger than an active equity strategy if the former has lower tracking error to its benchmark. Post investment, active risk continues to serve as a tool for monitoring performance. For example, a sudden increase in a manager’s active risk could reflect a change in the underlying composition of the portfolio and alert the investment team to investigate. A risk framework allows these evaluations to be consistently and efficiently applied.
Communication with External Stakeholders. Investment committees and wealth owners are increasingly looking for more transparency into the investment process. Active risk is one measure that provides a consistent framework for risk management. For example, a chief investment officer could share an adapted version of Figure 3 to set expectations with stakeholders about how the portfolio should behave during a downturn. Sharing intuitions and rationale around portfolio construction builds trust and a deeper understanding with external constituents. While the use of active risk does not guarantee outperformance, the framework can enable teams to focus risk in a portfolio’s highest-conviction positions, codify a consistent investment process for teams, and provide insight to external stakeholders.
Communication within the Investment Team. Portfolio management is a team endeavor, and a clear and consistent investment philosophy is vital to coordinate the team’s efforts. Active risk is merely one tool in the risk management toolkit. Codifying the team’s investment approach could benefit recruiting and training of employees, clarify the unspoken “rules of thumb,” and allow for improved decision making.
Footnotes
- 2018 Survey on Manager Concentration Policy.
- Active risk is defined as the size of the position multiplied by the standard deviation of excess returns over a benchmark. Active risk can be calculated for the total portfolio or any individual active position (e.g., manager performance in relation to the manager benchmark).
- Assuming a normal distribution in excess returns, we would expect that 68% of the time performance for the US equity allocation would fall within ±148 bps of the benchmark, and 95% of the time performance for the allocation would fall within ±296 bps of the benchmark. Also, assuming the US equity lineup has an information ratio of 0.4, this allocation would be expected to deliver 59 bps of excess return over the benchmark. The benchmark used is MSCI US Index for all managers so that the active risks are comparable across managers; another approach is to measure managers versus style benchmarks and then quantify the active risk of a style bet separately.
About Cambridge Associates
Cambridge Associates is a global investment firm with 50+ years of institutional investing experience. The firm aims to help pension plans, endowments & foundations, healthcare systems, and private clients achieve their investment goals and maximize their impact on the world. Cambridge Associates delivers a range of services, including outsourced CIO, non-discretionary portfolio management, staff extension and alternative asset class mandates. Contact us today.