Alternative Risk Premia Funds: An Attractive Diversifier? (Sterling Edition)

Elevated equity market valuations and potentially rising bond yields suggest the return environment for traditional risk assets could be difficult. Faced with this challenge, institutional investors are seeking alternative sources of return. Alternative risk premia (ARP) strategies – which harvest well-established risk premia and market anomalies across asset classes – may fit the bill.
ARP strategies have exhibited low correlations to traditional asset classes and demonstrated resilience in times of equity market stress, particularly relative to other diversifying assets. Although live track records are short and any conclusions drawn from back-tested data should be viewed sceptically, investors may find that these liquid and cost-effective strategies deliver diversifying characteristics comparable to traditional safe haven assets. In this paper, we assess the broad universe of ARP funds, their diversifying role in portfolios, and the issues investors should be aware of when considering this space.
Background
ARP funds extend the approach of factor investing across multiple factors and asset classes. This extension means these funds are less exposed to any one individual risk factor. Individual factor performance can be cyclical and difficult, if not impossible, to time. However, correlations across factors have historically been low, meaning factor combinations within a single portfolio may produce a smoother return profile.
Some factors are more prevalent in certain asset classes than others, but most ARP funds apply multiple factor approaches across equities, commodities, fixed income, and currencies. Typically, these funds target four main factors: value, momentum, carry, and quality (Figure 1), but they may incorporate other risk premia or market anomalies into their strategies. 1 Although the number of potential factors is enormous (academic literature highlights more than 300), the vast majority are not statistically significant and therefore not harvested. Investors should seek products that target factors that have been proven across multiple academic studies and that have persisted over the long term.
FIGURE 1 4 MAIN FACTORS IN ARP FUNDS

Source: Cambridge Associates LLC.
Liquid Diversifiers
We classify ARP strategies as ‘liquid diversifiers’ due to their relatively accommodative liquidity terms (often weekly or monthly) and generally low correlation to traditional assets. To understand how ARP strategies have performed, we compared their performance patterns to other liquid diversifiers, such as trend followers, safe-haven currencies (USD, JPY, and CHF), absolute return diversified growth funds (absolute return DGF), 2 and gold. We anticipate broadening the diversifier universe, to including relative value–focused hedge funds, in a future iteration of this paper. Although there are many funds offering different risk premia exposures and impressive track records, we confined ourselves only to those funds that include investments across multiple asset classes, use comparable premia, and represent an investible option for institutional investors. We excluded managed accounts and bank products due to their lack of transparency on costs or track record in a commingled fund structure.
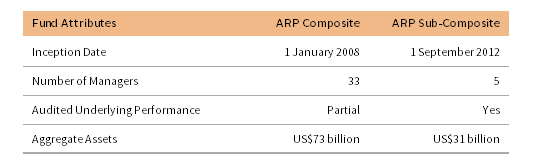
With these criteria, we constructed two composites of ARP funds to better understand performance. The first, the ARP Composite, includes 33 ARP funds with total assets of US$73 billion. The majority of funds in this universe have ten-year track records, some of which are back-tested and unaudited. We then constructed a more refined sub-composite, containing only those funds with audited, net track records in excess of five years, which we refer to as the ARP Sub-Composite. The total number of funds in this sub-composite fell to five, with total assets of US$31 billion. Unless otherwise noted, all of our analysis in this paper uses the ARP Sub-Composite (Figure 2).
FIGURE 2 ARP FUND COMPOSITES
Source: Cambridge Associates LLC.
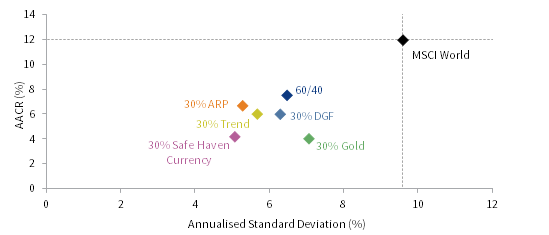
Unfortunately, ARP strategies have not been tested in a live situation during a sustained market sell-off. That said, we examined whether an allocation to ARP strategies within a balanced portfolio of equities and bonds 3 would have enhanced the overall portfolio’s risk-adjusted returns during the period of time for which we have data. Using both of our composites, we found ARP strategies did improve risk-adjusted returns (Figure 3). Interestingly this complementary feature extends to difficult market periods. For instance looking back over the last ten years ARP strategies have protected capital during the worst, second-worst, and third-worst cumulative drawdown for the balanced portfolio (November 2007 to February 2009, May 2011 to September 2011, and September 2014 to January 2016 periods, respectively). Given their positive net performance during these periods, ARP strategies exhibited valuable diversifying qualities for which some defensive assets have traditionally been known. This, along with their tendency to outperform defensive assets during normal market periods, explains ARP strategies’ positioning relative to trend and gold in Figure 3. Clients considering diluting their 60/40 Portfolio by accommodating an allocation to defensive assets would have been hard-pressed to find a better way to improve their portfolio Sharpe ratio.
FIGURE 3 RISK/RETURN PORTFOLIO ANALYSIS
1 September 2012 – 31 December 2017
Sources: Bloomberg Index Services Limited, Cambridge Associates LLC, Intercontinental Exchange, Inc., MSCI Inc., Societe Generale S.A., and Thomson Reuters Datastream. MSCI data provided ‘as is’ without any express or implied warranties.
Notes: All portfolios displayed in the figure are based on the 60/40 Portfolio, which is 60% MSCI World Index (Net) and 40% Bloomberg Barclays Global Aggregate Bond Index. ARP refers to a 60% MSCI World and 40% BBG Barc Global Agg portfolio reduced pro-rata to include a 30% allocation to the Cambridge Associates ARP Sub-Composite. DGF refers to a 60% MSCI World and 40% BBG Barc Global Agg portfolio reduced pro-rata to include a 30% allocation to the Cambridge Associates DGF Sub-Composite. Trend refers to a 60% MSCI World and 40% BBG Barc Global Agg portfolio reduced pro-rata to include a 30% allocation to the Societe Generale Trend Index. Safe Haven Currency refers to a 60% MSCI World and 40% BBG Barc Global Agg portfolio reduced pro-rata to include a 30% allocation to proprietary blend of flight to quality assets in CHF, JPY, and USD. Gold refers to a 60% MSCI World and 40% BBG Barc Global Agg portfolio reduced pro-rata to include a 30% allocation to LBMA Gold Price.
Our analysis also found that an allocation to ARP strategies within a balanced portfolio would have generated a better risk-adjusted return relative to portfolios that included other liquid diversifiers. Although there is a small reduction (-0.8%) in annualised return versus a balanced portfolio, the overall risk-adjusted return increased, as measured by the Sharpe ratio, from 1.1 to 1.2. Including allocations of trend followers or absolute return DGF funds in a balanced portfolio gave similar levels of return but with higher volatility, meaning those portfolios had lower Sharpe ratios.
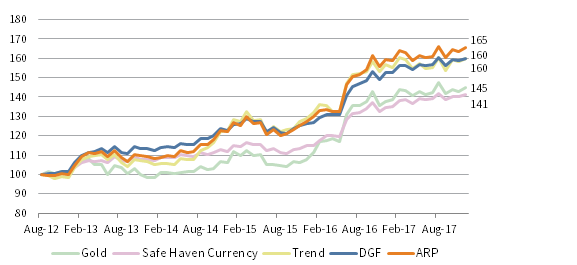
Figure 4 highlights the cumulative returns generated by a balanced portfolio with the inclusion of various liquid diversifiers. In this instance, an allocation to ARP strategies would have returned more than other liquid diversifiers. For instance, a £100 million portfolio would have appreciated by £65 million with an ARP allocation, exceeding the returns from portfolios with other liquid diversifying strategies.
FIGURE 4 CUMULATIVE RETURNS WITH 30% ALLOCATION TO VARIOUS DIVERSIFIERS
1 September 2012 – 31 December 2017 • 31 August 2012 = 100 • £M Terms
Sources: Bloomberg Index Services Limited, Cambridge Associates LLC, Intercontinental Exchange, Inc., MSCI Inc., Societe Generale S.A., and Thomson Reuters Datastream. MSCI data provided ‘as is’ without any express or implied warranties.
Notes: All portfolios displayed in the figure are based on 60% MSCI World Index (Net) and 40% Bloomberg Barclays Global Aggregate Bond Index. ARP refers to a 60% MSCI World and 40% BBG Barc Global Agg portfolio reduced pro-rata to include a 30% allocation to the Cambridge Associates ARP Sub-Composite. DGF refers to a 60% MSCI World and 40% BBG Barc Global Agg portfolio reduced pro-rata to include a 30% allocation to the Cambridge Associates DGF Sub-Composite. Trend refers to a 60% MSCI World and 40% BBG Barc Global Agg portfolio reduced pro-rata to include a 30% allocation to the Societe Generale Trend Index. Safe Haven Currency refers to a 60% MSCI World and 40% BBG Barc Global Agg portfolio reduced pro-rata to include a 30% allocation to proprietary blend of flight to quality assets in CHF, JPY, and USD. Gold refers to a 60% MSCI World and 40% BBG Barc Global Agg portfolio reduced pro-rata to include a 30% allocation to LBMA Gold Price.
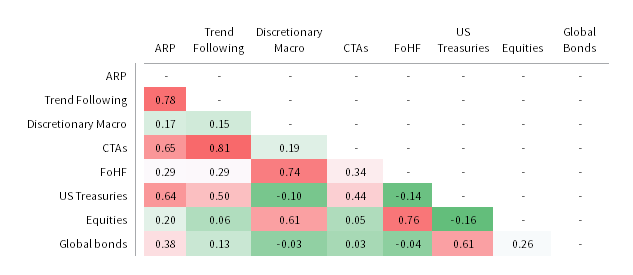
ARP funds can, in some cases, be incorporated in a broad market portfolio. As shown in Figure 5, ARP funds’ modest sensitivity to the MSCI World Index suggest these funds could play a complementary role in an equity-dominant portfolio. Similarly, ARP funds can be used in concert with certain diversifying strategies, such as discretionary macro and FoHF strategies. But this is less the case for certain other diversifying strategies such as CTAs and trend following, both of which have a higher tendency to move in tandem with ARP funds. Interestingly, ARP funds have exhibited similar properties to US Treasuries – and to a lesser extent global bonds – which could be attributed to the recent market environment. Over the past few years, persistent declines in global interest rates have benefitted fixed income–oriented premia strategies, in particular those seeking to extract carry-, trend-, and volatility-premia. Near-term ARP correlations to Treasuries may remain elevated, in part due to a structural feature specific to ARP funds’ sizeable excess collateral balances, which tend to be held in Treasury securities, some of which entail significant duration.
FIGURE 5 CORRELATION MATRIX
Sources: Bloomberg Index Services Limited, Cambridge Associates LLC Investment Manager Database, Hedge Fund Research, Inc., MSCI Inc., Standard and Poor’s, and Societe Generale S.A. MSCI data provided “as is” without any express or implied warranties.
Notes: ARP is the CA sub-composite index. Trend following is Societe Generale Trend Index. Discretionary Macro is Hedge Fund Research Macro: Discretionary Thematic Index. CTAs is Hedge Fund Research (HFRX) Macro/CTA Index. FoHF is Hedge Fund Research Fund of Funds Diversified Index. US Treasuries is S&P US Treasury Bond 7-10 Year Index, ticker ‘SPBDU10T.’ Equities is MSCI World Index (Net). Global bonds is Bloomberg Barclays Global Aggregate Bond Index. Based on monthly data from September 2012 to December 2017 in US dollar terms. All returns are total returns.
To better understand the capital protection benefits of adding ARP Composite funds to a portfolio, we examined performance during the global financial crisis in 2008–09 (Figure 6). In this instance, the returns of a balanced portfolio including an allocation to ARP strategies would have been superior. Over this 2007–09 period, a £100 million portfolio including ARP strategies would have conserved £9 million of capital more than a balanced portfolio.
FIGURE 6 BENEFITS OF ADDING ARP TO A BALANCED PORTFOLIO
1 January 2007 – 31 March 2009 • 31 December 2006 = 100 • £M Terms
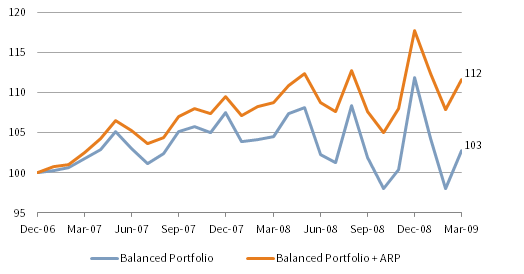
Sources: Bloomberg Index Services Limited, Cambridge Associates LLC, and MSCI Inc. MSCI data provided ‘as is’ without any express or implied warranties.
Notes: The Balanced Portfolio is composed of 60% MSCI World Index (Net) and 40% Bloomberg Barclays Global Aggregate Bond Index. The Balanced Portfolio + ARP is composed of 70% Balanced Portfolio and 30% CA ARP Composite hedged to GBP.
Combining ARP strategies along with other diversifying assets also delivered positive risk/return benefits versus a balanced portfolio. This more diversified approach may be preferential for investors looking to reduce counterparty or single-strategy exposures. Equal allocations to ARP strategies and either absolute return DGF or trend-following funds within a diversified portfolio returned a similar amount across our five-year history versus ARP strategies on their own. All combinations of these strategies produced Sharpe ratios between 1.1 and 1.2 and similar betas to those of developed equity markets (0.5).
When considering an allocation to ARP strategies as a portfolio diversifier, the beta persistence of the underlying fund is very important. For a fund to be a good diversifier, a low or negative beta to other asset classes would be necessary, especially in times of market stress. A fund with a wide beta range may be sub-optimal in providing diversified returns at the most important times. Our analysis indicates that ARP funds may have periods during which they exhibit higher beta to equity markets than expected. Considering rolling 36-month time periods, the ARP Sub-Composite produces a satisfactory beta to the MSCI World Index range of -0.04 to 0.28, with an average beta of 0.07, indicating strong diversifying characteristics. However, diversified hedge fund strategies and macro/CTA strategies have more stable betas to developed equity markets than the ARP Sub-Composite. In contrast, pure trend-following strategies have a wide beta range (Figure 7).
FIGURE 7 BETA PERSISTENCY
1 August 2012 – 31 December 2017 • Rolling 36-M Min/Max Range vs MSCI World • USD Terms
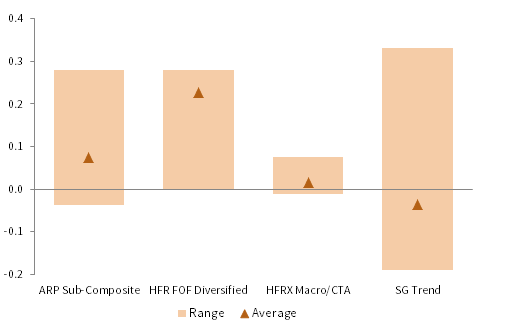
Sources: Cambridge Associates LLC Investment Manager Database, MSCI Inc., Societe Generale S.A., and Thomson Reuters Datastream. MSCI data provided ‘as is’ without any express or implied warranties.
Note: Returns for the MSCI World Index are net of dividend taxes.
Each Fund Is Different
The ARP universe encompasses a wide range of return and volatility profiles, meaning manager selection is important. The level of targeted volatility and leverage, as well as the degree to which factor weightings can change, all impact ARP fund performance. As a result, ARP funds are not highly correlated with each other. In fact, almost 80% of funds in our broad universe have pairwise correlations of less than 0.4, meaning fund performance can vary significantly (Figure 8).
FIGURE 8 10-YR ANNUAL RETURN MANAGER DISPERSION
As at Fourth Quarter 2017 • Average Annual Compound Return (%) • USD Terms
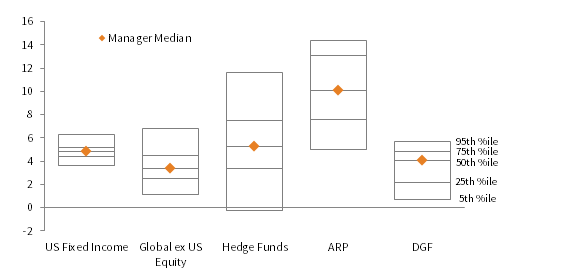
Source: Cambridge Associates LLC Investment Manager Database.
Note: ARP data refer to the ARP Composite.
For the ARP Composite, the performance between top and bottom quartile funds is a wide 5.5%. In contrast, the comparable measurements for equity and bond managers are 2.0% and 0.8%, respectively.
Investors should remember that much of the data released by ARP funds currently is unaudited, and composed of back tests or short time periods. We recommend that investors approach the space with caution and treat back-tested results with a high degree of scepticism. We have observed what we consider to be excessively high Sharpe ratios in some marketing materials, often based on simulated results. Figure 9 shows the wide range of 36-month rolling Sharpe ratios for the ARP Sub-Composite relative to other diversifying strategies. We believe that a Sharpe ratio in the range of 0.6–0.7 for ARP strategies is realistic over the long term. However, short-term deviations from that range may be sizable.
FIGURE 9 SHARPE RATIO
1 August 2012 – 31 December 2017 • Rolling 36-M Min/Max Range • USD Terms
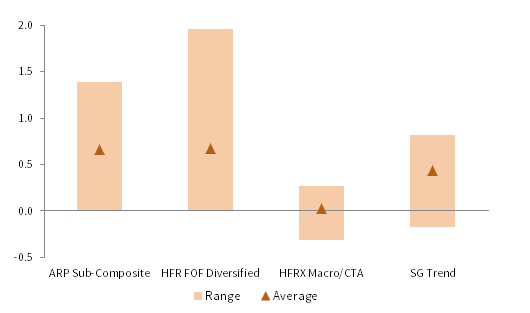
Sources: Cambridge Associates LLC Investment Manager Database, Hedge Fund Research, Inc., Intercontinental Exchange, Inc., and Societe Generale S.A.
Notes: ARP Sub-Composite refers to the Cambridge Associates ARP Sub-Composite. HFR FOF Diversified refers to the Hedge Fund Research Fund of Funds Diversified Index. HFRX Macro/CTA refers to the Hedge Fund Research (HFRX) Macro/CTA Index. SG Trend refers to the Societe Generale Trend Index.
Investors may find the differences in Sharpe ratios surprising given the broadly similar premia being deployed across ARP funds. A closer look at each product’s performance reveals that the Sharpe ratios of individual risk premia explain a modest portion of this dispersion. The bulk of the gap is likely explained by the diversification effects of combining different assets and risk premia in varying ways.
Fee structures also vary across ARP funds, though they are generally reasonable compared to traditional hedge fund partnerships. Management fees typically range between 0.7% and 1.0%, with 76% of funds in our broad universe charging no performance fee. Of the 24% of ARP funds that charge a performance fee, the average level is 13%. Given these lower fees, the inclusion of ARP strategies in hedge fund allocations can help to reduce overall fee levels. Investors should consider fees in the context of the level of volatility targeted and consider how that target compares to realised volatility.
Considerations
Despite the positive characteristics that high-quality ARP funds may offer to a portfolio, investors should keep in mind a number of items when considering an allocation to this space.
Back Testing. ARP track records are heavily dependent on simulated back tests, which are unlikely to fully account for practical impediments, such as execution and slippage, second-order effects of investor flows and crowding, and behavioural impacts of discretionary intervention. Investors seeking robust data on these strategies are therefore limited to a handful of managers.
Benchmarking. Different risk premia exposures and different allocations across these premia mean traditional benchmarks are less relevant. Investors can construct their own custom ARP peer groups or use one of the new ARP indices that have emerged to review performance. But, both approaches are likely to be skewed by the limited data available. Although we recommend investors benchmark exposure to peers and consider a cash-plus target level over a full market cycle, no benchmarking solution will be perfect.
Volatility. Investors should be aware that ARP strategies may experience double-digit drawdowns at some point. Shocks to the strategy have yet to occur over the limited time frame that most products have been in operation. We consider a realistic drawdown for a 10% volatility strategy to be between 15% and 20% at some point during a market cycle.
Leverage. ARP strategies use leverage and investors should not be surprised to see long plus short (gross) exposures in the 500%–900% range, or even higher, while net exposures are generally low. Considering the significant use of leverage, investors should be aware that ARP strategies are not low-risk strategies, and any large-scale market de-leveraging may adversely affect these strategies.
Factor Timing. Factor timing is difficult, if not impossible. Diversified factor products may generate less volatile returns than single-factor products by benefitting from diversification benefits across factors and asset classes. However, even diversified products can exhibit periods of underperformance.
Fees. The cost per unit of volatility can vary by fund as ARP funds may target very different volatility levels despite charging similar fees. Investors should consider volatility adjusting the manager’s targeted returns to ascertain whether headline fees are in fact as reasonable as they appear.
Access. Several of the earliest-launched ARP funds have had such success in raising capital that they are now closed to new investors. As more assets enter this space and as more managers cap their capacity, investors may find it challenging to access the highest-quality funds.
For those investors that do make an allocation to an ARP fund, it’s important to understand that it could be included in a variety of places within portfolios for benchmarking purposes, depending on each investor’s approach to portfolio classification. The most common spot for ARP strategies is within hedge fund portfolios, due to their low correlation, broad asset class reach, and volatility targeting approach. Investors also assign ARP strategies to a diversifying strategy bucket or alongside traditional safe-haven assets. Although their return profiles may encourage some investors to pair them with bonds, they are not fixed income alternatives and could perform much differently than bonds in a crisis. The decision is up to each investor, but for many investors, placing an ARP fund in the hedge funds bucket alongside other absolute return strategies may be most appropriate.
Summary
Are ARP strategies the solution investors need? The jury is still out, but the early evidence is positive. With our limited data, these strategies improved the risk/return trade-off in a traditional portfolio setting better than other liquid diversifying strategies, and they have exhibited strong, and relatively stable, diversifying characteristics relative to equity markets. Fees and liquidity are also appealing. Investors should be mindful that these strategies are new, meaning any conclusions about them are subject to change. We expect, however, investors will increasingly allocate to these strategies in the years ahead.
Index Disclosures
Bloomberg Barclays Global Aggregate Bond Index
The Bloomberg Barclays Global Aggregate Bond Index consists of over 5,000 government, corporate, asset-backed, and mortgage-backed securities.
HFRI Fund-of-Funds Diversified Index
The HFRI Fund-of-Funds Diversified Index is a non-investable product of diversified fund of funds. The Index is equal weighted (fund weighted) with an inception of January 1990.
HFRX Macro/CTA Index
Hedge Fund Research, Inc. (HFR) uses a UCITSIII compliant methodology to construct the HFRX Hedge Fund Indices. The methodology is based on defined and predetermined rules and objective criteria to select and rebalance components to maximize representation of the Hedge Fund Universe. HFRX Indices use state-of-the-art quantitative techniques and analysis; multi-level screening, cluster analysis, Monte-Carlo simulations and optimization techniques ensure that each index is a pure representation of its corresponding investment focus.
MSCI World Index
The MSCI World Index represents a free float–adjusted, market capitalization–weighted index that is designed to measure the equity market performance of developed markets. As at December 2017, it includes 23 developed markets country indexes: Australia, Austria, Belgium, Canada, Denmark, Finland, France, Germany, Hong Kong, Ireland, Israel, Italy, Japan, the Netherlands, New Zealand, Norway, Portugal, Singapore, Spain, Sweden, Switzerland, the United Kingdom, and the United States.
Societe Generale Trend Index
The SG Trend Index (f.k.a. SG Trend-Sub Index) is designed to track the ten largest (by AUM) trend following CTAs and be representative of the trend followers in the managed futures space. Managers must meet the following criteria: be open to new investment; report returns on a daily basis; be an industry recognized trend follower as determined at the discretion of the SG Index Committee; and exhibit significant correlation to trend following peers and the SG Trend Indicator. The SG Trend Index is equally weighted, and rebalanced and reconstituted annually.
S&P 500 US Treasury Bond 7-10 Year Index
The S&P 500 US Treasury Bond 7-10 Year Index is designed to measure the performance if US Treasury bonds maturing in 7 to 10 years. To be eligible for inclusion in the S&P US Treasury Bond 7-10 Year Index, securities must be debt issued by the central governments of the United States in the domestic or Eurobond markets. The currency of issue must be US dollar, and the minimum notional outstanding is $1 billion USD.
Footnotes
- Our analysis also includes several funds that exclude commodities to comply with the language and spirit of UCITs regulations.
- Absolute Return Diversified Growth Funds employ multi-asset, absolute return approaches and are different than traditional diversified growth funds. These funds tend to have a cash-plus-level-return target, low-to-moderate volatility, and employ extensive leverage and use of derivatives.
- The balanced portfolio is composed of 60% MSCI World Index (Net) and 40% Bloomberg Barclays Global Aggregate Bond Index reduced pro-rata to allow 30% allocation to ARP strategies. All returns are in USD.
About Cambridge Associates
Cambridge Associates is a global investment firm with 50+ years of institutional investing experience. The firm aims to help pension plans, endowments & foundations, healthcare systems, and private clients achieve their investment goals and maximize their impact on the world. Cambridge Associates delivers a range of services, including outsourced CIO, non-discretionary portfolio management, staff extension and alternative asset class mandates. Contact us today.