Alternative Risk Premia: A Diversifying Option for Investors (Euro Edition)

Elevated equity market valuations and potentially rising bond yields suggest the return environment for traditional risk assets could be difficult. Faced with this challenge, institutional investors are seeking alternative sources of return. Alternative risk premia (ARP) strategies—which harvest well-established risk premia and market anomalies across asset classes—may fit the bill.
ARP strategies have exhibited low correlations to traditional asset classes and demonstrated reasonable resilience in times of equity market stress, particularly relative to other diversifying assets. Although live track records are short and any conclusions drawn from back-tested data should be viewed skeptically, investors may find that these liquid and cost-effective strategies deliver diversifying characteristics comparable to traditional safe haven assets. In this paper, we assess the euro-denominated universe of ARP funds, their diversifying role in portfolios, and the issues investors should be aware of when considering this space.
Background
ARP funds extend the approach of factor investing across multiple factors and asset classes. This extension means these funds are less exposed to any one individual risk factor. Individual factor performance can be cyclical and difficult, if not impossible, to time. However, correlations across factors have historically been low, meaning factor combinations within a single portfolio may produce a smoother return profile.
Some factors are more prevalent in certain asset classes than others, but most ARP funds apply multiple factor approaches across equities, commodities, fixed income, and currencies. Typically, these funds target four main factors: value, momentum, carry, and quality (Figure 1), but they may incorporate other risk premia or market anomalies into their strategies. 1 Although the number of potential factors is enormous (academic literature highlights more than 300), the vast majority are not statistically significant and, therefore, not harvested. Investors should seek products that target factors that have been proven across multiple academic studies and that have persisted over the long term.
FIGURE 1 4 MAIN FACTORS IN ARP FUNDS
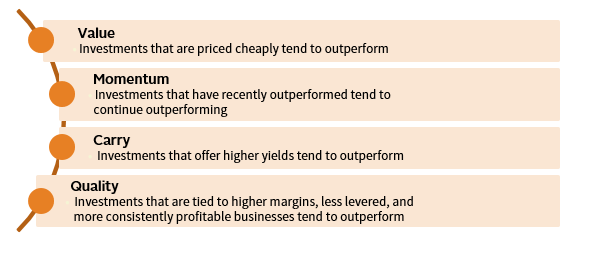
Source: Cambridge Associates LLC.
Liquid Diversifiers
We classify ARP strategies as ‘liquid diversifiers’ due to their relatively accommodative liquidity terms (often weekly or monthly) and generally low correlation to traditional assets. To understand how ARP strategies have performed, we compared their performance patterns to other liquid diversifiers, such as trend followers, safe-haven currencies (USD, JPY, and CHF), absolute return diversified growth funds (absolute return DGF), 2 and gold. Although there are many funds offering different risk premia exposures and impressive track records, we confined ourselves only to those funds that include investments across multiple asset classes, use comparable premia, and represent an investible option for institutional investors. We excluded managed accounts and bank products due to their lack of transparency on costs or track record in a commingled fund structure.
With these criteria, we constructed the Cambridge Associates (CA) ARP fund Composite (EUR) to better understand performance. The CA ARP Composite (EUR) includes eight ARP funds with total assets of US$24.4 billion. The selected share classes of these funds are all denominated in EUR to avoid the distorting nature of converting return streams from other currencies. Funds included in this composite have audited track records in excess of five years and are net of fees. Results may vary for alternative composites denominated in different currencies.
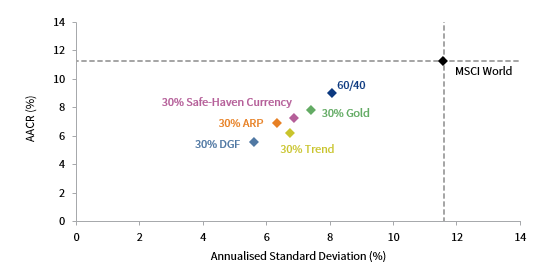
Unfortunately, ARP strategies have not been tested in a live situation during a sustained market sell-off. Fourth quarter 2018 provided a short-term test as equity markets plummeted. However, we do not view this as a long enough period to constitute a true test to the strategy. In this paper, we examine whether an allocation to ARP strategies within a balanced portfolio of equities and bonds 3 would have enhanced the overall portfolio’s risk-adjusted returns during the period of time for which we have reliable data. Over a five-year period, we found ARP strategies slightly improved risk-adjusted returns compared to the addition of other diversifying assets (Figure 2). The inclusion of safe-haven currencies or gold produced better returns albeit at higher volatility levels. Of all the diversified portfolios, the inclusion of ARP produced the highest Sharpe ratio. Over this time period, the result of including ARP strategies to a balanced portfolio was a reduction in market beta with a similar overall Sharpe ratio.
FIGURE 2 RISK/RETURN PORTFOLIO ANALYSIS
1 April 2014 – 31 March 2019 • EUR
Sources: Bloomberg Index Services Limited, Cambridge Associates LLC, Hedge Fund Research, Inc., Intercontinental Exchange, Inc., MSCI Inc., and Thomson Reuters Datastream. MSCI data provided ‘as is’ without any express or implied warranties.
Notes: All portfolios displayed in the figure are based on the 60/40 Portfolio, which is 60% MSCI World Index (Net) and 40% Bloomberg Barclays Global Aggregate Bond Index. ARP refers to a 60% MSCI World and 40% BBG Barc Global Agg portfolio reduced pro-rata to include a 30% allocation to the Cambridge Associates ARP Sub-Composite. DGF refers to a 60% MSCI World and 40% BBG Barc Global Agg portfolio reduced pro-rata to include a 30% allocation to the Cambridge Associates DGF Sub-Composite. Trend refers to a 60% MSCI World and 40% BBG Barc Global Agg portfolio reduced pro-rata to include a 30% allocation to the Hedge Fund Research Macro: Systematic Diversified Index (Hedged) – EUR. Safe-Haven Currency refers to a 60% MSCI World and 40% BBG Barc Global Agg portfolio reduced pro-rata to include a 30% allocation to proprietary blend of flight to quality assets in CHF, JPY, and USD. Gold refers to a 60% MSCI World and 40% BBG Barc Global Agg portfolio reduced pro-rata to include a 30% allocation to LBMA Gold Price.
Including allocations of trend followers or absolute return DGF in a balanced portfolio produced lower levels of return and in the case of trend followers, the lower return came with higher volatility. Over the five-year time period, which was characterised by low volatility and strong equity markets, ARP funds performed moderately well. However, a balanced portfolio without diversifiers performed better on both an absolute and risk-adjusted basis than a portfolio including diversifiers. This outperformance is unsurprising, considering the bull market conditions of the period in question. Yet a diversified portfolio would be expected to generate better value on the downside.
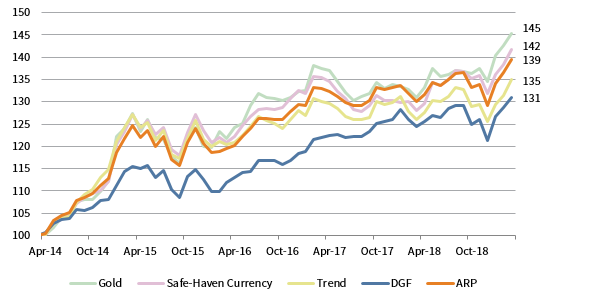
Figure 3 highlights the cumulative returns generated by a balanced portfolio with the inclusion of various liquid diversifiers. In this instance, an allocation to ARP strategies would have returned more than an equivalent allocation to trend followers and DGF funds, but lagged gold and safe-haven currencies. For instance, a EUR100 million portfolio would have appreciated by EUR39 million with an ARP allocation, exceeding the EUR35 million gain from a portfolio including trend followers and EUR31 million from DGF funds. The portfolio incorporating gold, however, would have appreciated by EUR45 million.
FIGURE 3 CUMULATIVE RETURNS WITH 30% ALLOCATION TO VARIOUS DIVERSIFIERS
31 March 2014 – 31 March 2019 • 31 March 2014 = 100 • EUR (€m)
Sources: Bloomberg Index Services Limited, Cambridge Associates LLC, Hedge Fund Research, Inc., Intercontinental Exchange, Inc., MSCI Inc., and Thomson Reuters Datastream. MSCI data provided ‘as is’ without any express or implied warranties.
Notes: All portfolios displayed in the figure are based on the 60/40 Portfolio, which is 60% MSCI World Index (Net) and 40% Bloomberg Barclays Global Aggregate Bond Index. ARP refers to a 60% MSCI World and 40% BBG Barc Global Agg portfolio reduced pro-rata to include a 30% allocation to the Cambridge Associates ARP Sub-Composite. DGF refers to a 60% MSCI World and 40% BBG Barc Global Agg portfolio reduced pro-rata to include a 30% allocation to the Cambridge Associates DGF Sub-Composite. Trend refers to a 60% MSCI World and 40% BBG Barc Global Agg portfolio reduced pro-rata to include a 30% allocation to the Hedge Fund Research Macro: Systematic Diversified Index (Hedged) – EUR. Safe-Haven Currency refers to a 60% MSCI World and 40% BBG Barc Global Agg portfolio reduced pro-rata to include a 30% allocation to proprietary blend of flight to quality assets in CHF, JPY, and USD. Gold refers to a 60% MSCI World and 40% BBG Barc Global Agg portfolio reduced pro-rata to include a 30% allocation to LBMA Gold Price.
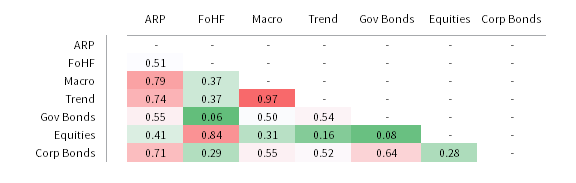
ARP funds can be most complimentary to an equity heavy portfolio. As shown in Figure 4, ARP funds’ modest correlation of 0.41 to the MSCI World Index suggests these funds could play a complementary role in an equity-dominant portfolio. To portfolios with high allocations to corporate bonds, macro and trend following strategies, the benefits of adding an allocation to ARP funds is less clear. Correlations over a five-year period to diversifying hedge fund strategies are relatively high (macro and trend at 0.79 and 0.74, respectively) and corporate bonds correlations are also relatively high (0.71).
FIGURE 4 CORRELATION MATRIX
1 April 2014 – 31 March 2019 • EUR
Sources: Bloomberg Index Services Limited, Cambridge Associates LLC, Hedge Fund Research, Inc., Intercontinental Exchange, Inc., MSCI Inc., and Thomson Reuters Datastream. MSCI data provided ‘as is’ without any express or implied warranties.
Notes: ARP is the Cambridge Associates ARP Sub-Composite. FoHF is Hedge Fund Research Fund of Funds Diversified Index (Hedged) – EUR. Macro is Hedge Fund Research Macro (Total) Index (Hedged) – EUR. Trend following is Hedge Fund Research Macro: Systematic Diversified Index (Hedged) – EUR. Gov Bonds is S&P Eurozone Sovereign Bond 7-10 Year Index. Equities is MSCI World Index Hedged – € (Net). Corp Bonds is Bloomberg Barclays Global Aggregate Corporate Bond Index (Hedged) – €. Based on monthly data from April 2014 to March 2019 in EUR terms. All returns are total returns.
To better understand the capital protection benefits of adding ARP funds to a portfolio, we examined performance during the recent market volatility of fourth quarter 2018 and first quarter 2019 (Figure 5). In this instance, the returns of a balanced portfolio with and without ARP are relatively similar. A EUR100 million 60% equity/40% bond portfolio would have outperformed a balanced portfolio including ARP by EUR1.4 million. The outperformance of a balanced 60/40 portfolio widened to EUR4.7 million when including all of 2018. During the first nine months of the year, many ARP strategies lagged as models showed higher-than-normal downside correlation. The year 2018 was somewhat anomalous in that correlations rose across risk premia; the value risk premia, which was a large allocation in many ARP funds, underperformed and was a large drag on performance. However, it is reasonable to expect risk premias to display higher-than-average correlations from time to time. The cross-asset correlations should return to more normal ranges over the long term.
FIGURE 5 BENEFITS OF ADDING ARP TO A BALANCED PORTFOLIO
1 October 2018 – 31 March 2019 • 30 September 2018 = 100 • EUR (€m)
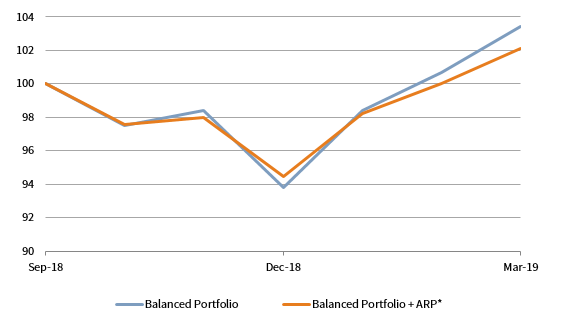
* Please see the Performance Disclosure at the end of the publication for information about the composite.
Sources: Bloomberg Index Services Limited, Cambridge Associates LLC, and MSCI Inc. MSCI data provided ‘as is’ without any express or implied warranties.
Notes: The Balance Portfolio is composed of 60% MSCI World Index (Net) and 40% Bloomberg Barclays Global Aggregate Bond Index. The Balanced Portfolio + ARP is composed of 70% Balanced Portfolio and 30% CA ARP Composite, which is based on USD share class returns translated to EUR terms.
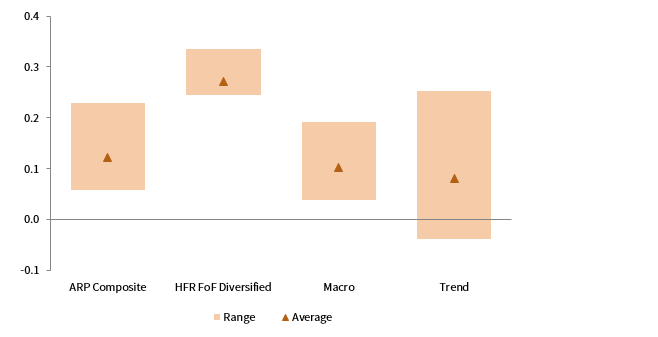
When considering an allocation to ARP strategies as a portfolio diversifier, the beta persistence of the underlying fund is very important. For a fund to be a good diversifier, a low or negative beta to other asset classes would be necessary, especially in times of market stress. A fund with a wide beta range may be sub-optimal in providing diversified returns at the most important times. Considering rolling 36-month time periods, the ARP Composite (EUR) produces a satisfactory beta to the MSCI World Index range of 0.06 to 0.23, with an average beta of 0.12, indicating acceptable diversifying characteristics. However, an interesting observation is that there has been a slow but steady increase of rolling 36-month betas of the ARP Composite (EUR) over the time period. The 36-month beta of the ARP Composite (EUR) across most of 2017 averaged 0.08. By the end of first quarter 2019, this average 36-month beta had risen to 0.23, which may partly explain the disappointing results at the end of 2018.
Diversified hedge fund strategies and macro/CTA strategies have relatively stable betas to developed equity markets. Diversified fund-of-fund strategies have demonstrated the highest average beta over the two-year time period. In contrast, pure trend-following strategies have a wider beta range and have tended to run with lower absolute market beta of 0.08 (Figure 6).
FIGURE 6 BETA PERSISTENCY
1 March 2017 – 31 March 2019 • Rolling 36-M Min/Max Range vs MSCI World • EUR Terms
Sources: Cambridge Associates LLC and Hedge Fund Research, Inc.
Notes: ARP Composite is the Cambridge Associates ARP Sub-Composite. HFR FoF Diversified is the Hedge Fund Research Fund of Funds Diversified Index (Hedged) – EUR. Macro is the Hedge Fund Research Macro (Total) Index (Hedged) – EUR. Trend is the Hedge Fund Research Macro: Systematic Diversified Index (Hedged) – EUR. Risk-free rate used in calculations taken as the Euro Interbank Offered Rate – 3 months. Based on monthly data from April 2014 to March 2019 in EUR terms. All returns are total returns.
Each Fund Is Different
The ARP universe encompasses a wide range of return and volatility profiles, meaning manager selection is important. The level of targeted volatility and leverage, as well as the degree to which factor weightings can change, impacts ARP fund performance. As a result, ARP funds are not highly correlated with each other. In fact, the average pairwise correlation of the funds in the CA ARP Composite (EUR) is less than 0.4, meaning fund performance can vary significantly.
Investors should remember that much of the data released by ARP funds currently is unaudited, and composed of back tests or short time periods. We recommend that investors approach the space with caution and treat back-tested results with a high degree of scepticism. We have observed what we consider to be excessively high Sharpe ratios in some marketing materials, often based on simulated results.
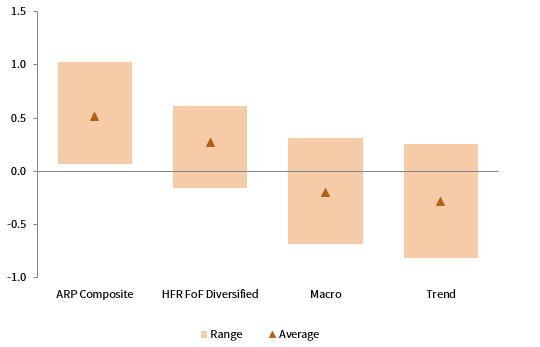
Figure 7 shows a positive range of Sharpe ratios for the CA ARP Composite (EUR), particularly relative to other diversifying strategies. We believe that a Sharpe ratio in the range of 0.5–0.6 for ARP strategies is a reasonable target over the long term. The average CA ARP Composite (EUR) level falls in this range over the past two years based on trailing 36-month data.
FIGURE 7 SHARPE RATIO
1 March 2017 – 31 March 2019 • Rolling 36-M Min/Max Range • EUR Terms
Sources: Cambridge Associates LLC and Hedge Fund Research, Inc.
Notes: ARP Composite is the Cambridge Associates ARP Sub-Composite. HFR FoF Diversified is the Hedge Fund Research Fund of Funds Diversified Index (Hedged) – EUR. Macro is the Hedge Fund Research Macro (Total) Index (Hedged) – EUR. Trend is the Hedge Fund Research Macro: Systematic Diversified Index (Hedged) – EUR. Risk-free rate used in calculations taken as the Euro Interbank Offered Rate – 3 months. Based on monthly data from April 2014 to March 2019 in EUR terms. All returns are total returns.
Investors may find the differences in Sharpe ratios surprising given the broadly similar premia being deployed across ARP funds. A closer look at each product’s performance reveals that the Sharpe ratios of individual risk premia explain a modest portion of this dispersion. The bulk of the gap is likely explained by the diversification effects of combining different assets and risk premia in varying ways.
Fee structures also vary across ARP funds, though they are generally reasonable compared to traditional hedge fund partnerships. Management fees typically range between 0.5% and 1.0%. Average management fees within our composite are 0.9%. Five of the eight funds in our composite charge no performance fee. Of the three ARP funds that charge a performance fee, the average level is 12%. Given these lower fees, the inclusion of ARP strategies in hedge fund allocations can help to reduce overall fee levels. Investors should consider fees in the context of the level of volatility targeted and consider how that target compares to realised volatility.
Considerations
Despite the positive characteristics that high-quality ARP funds may offer to a portfolio, investors should keep in mind a number of items when considering an allocation to this space.
Back testing. ARP track records are heavily dependent on simulated back tests, which are unlikely to fully account for practical impediments, such as execution and slippage, second-order effects of investor flows and crowding, and behavioural impacts of discretionary intervention. Investors seeking robust data on these strategies are therefore limited to a handful of managers.
Benchmarking. Different risk premia exposures and different allocations across these premia mean traditional benchmarks are less relevant. Investors can construct their own custom ARP peer groups or use one of the new ARP indices that have emerged to review performance. But, both approaches are likely to be skewed by the limited data available. Although we recommend investors benchmark exposure to peers and consider a cash-plus target level over a full market cycle, no benchmarking solution will be perfect.
Volatility. Investors should be aware that ARP strategies may experience double-digit drawdowns at some point. Shocks to the strategy have yet to occur over the limited time frame that most products have been in operation. We consider a realistic drawdown for a 10% volatility strategy to be between 15% and 20% at some point during a market cycle.
Leverage. ARP strategies use leverage and investors should not be surprised to see long plus short (gross) exposures in the 500%–900% range, or even higher, while net exposures are generally low. Considering the significant use of leverage, investors should be aware that ARP strategies are not low-risk strategies, and any large-scale market de-leveraging may adversely affect these strategies.
Factor Timing. Factor timing is difficult, if not impossible. Diversified factor products may generate less volatile returns than single-factor products by benefitting from diversification benefits across factors and asset classes. However, even diversified products can exhibit periods of underperformance.
Fees. The cost per unit of volatility can vary by fund, as ARP funds may target very different volatility levels despite charging similar fees. Investors should consider volatility adjusting the manager’s targeted returns to ascertain whether headline fees are in fact as reasonable as they appear.
Access. Several of the earliest-launched ARP funds have had such success in raising capital that they are now closed to new investors. As more assets enter this space and as more managers cap their capacity, investors may find it challenging to access the highest-quality funds.
For those investors that do make an allocation to an ARP fund, it’s important to understand that it could be included in a variety of places within portfolios for benchmarking purposes, depending on each investor’s approach to portfolio classification. The most common spot for ARP strategies is within hedge fund portfolios, due to their low correlation, broad asset class reach, and volatility-targeting approach. Investors also assign ARP strategies to a diversifying strategy bucket or alongside traditional safe-haven assets. Although their return profiles may encourage some investors to pair them with bonds, they are not fixed income alternatives and could perform much differently than bonds in a crisis. The decision is up to each investor, but for many investors, placing an ARP fund in the hedge funds allocation alongside other absolute return strategies may be most appropriate.
Summary
Are ARP strategies the solution investors need? The jury is still out. Based on limited data, ARP strategies in EUR improved the risk/return trade-off in a balanced portfolio setting better than other liquid diversifying strategies, and they have exhibited strong, and relatively stable, diversifying characteristics relative to equity markets. Fees and liquidity are also appealing.
Recent performance challenges have proved that ARP funds can be susceptible to periods of underperformance and this may correlate with periods of market stress. However, over time, correlations across risk premias should be expected to be lower than that experienced in fourth quarter 2018. While only time will tell if these strategies are good portfolio additions, count us as optimistic.
Index Disclosures
Bloomberg Barclays Global Aggregate Bond Index
The Bloomberg Barclays Global Aggregate Bond Index consists of more than 5,000 government, corporate, asset-backed, and mortgage-backed securities.
HFRI Fund-of-Funds Diversified Index
The HFRI Fund-of-Funds Diversified Index is a non-investable product of diversified fund-of-funds. The Index is equal weighted (fund weighted) with an inception of January 1990.
HFRI Macro (Total) Index
The HFRI Macro (Total) Index consists of investment managers which trade a broad range of strategies in which the investment process is predicated on movements in underlying economic variables and the impact these have on equity, fixed income, hard currency, and commodity markets. Managers employ a variety of techniques, both discretionary and systematic analysis, combinations of top-down and bottom-up theses, quantitative and fundamental approaches and long and short-term holding periods.
HFRI Macro Systematic Diversified Index
Systematic Diversified strategies have investment processes typically as a function of mathematical, algorithmic, and technical models, with little or no influence of individuals over the portfolio positioning. Systematic Diversified strategies typically would expect to have no greater than 35% of portfolio in either dedicated currency or commodity exposures over a given market cycle.
MSCI World Index
The MSCI World Index represents a free float–adjusted, market capitalization–weighted index that is designed to measure the equity market performance of developed markets. As at December 2017, it includes 23 developed markets country indexes: Australia, Austria, Belgium, Canada, Denmark, Finland, France, Germany, Hong Kong, Ireland, Israel, Italy, Japan, the Netherlands, New Zealand, Norway, Portugal, Singapore, Spain, Sweden, Switzerland, the United Kingdom, and the United States.
S&P Eurozone Sovereign Bond 7–10 Year Index (EUR)
The S&P Eurozone Sovereign Bond 7–10 Years Index seeks to measure the performance of Eurozone government bonds with maturities between seven and ten years.
Footnotes
- Our analysis also includes several funds that exclude commodities to comply with the language and spirit of UCITs regulations.
- Absolute Return Diversified Growth Funds employ multi-asset, absolute return approaches and are different than traditional diversified growth funds. These funds tend to have a cash-plus-level-return target, low-to-moderate volatility, and employ extensive leverage and use of derivatives.
- The balanced portfolio is composed of 60% MSCI World Index (Net) and 40% Bloomberg Barclays Global Aggregate Bond Index reduced pro-rata to allow 30% allocation to ARP strategies. All returns are in EUR terms.
About Cambridge Associates
Cambridge Associates is a global investment firm with 50+ years of institutional investing experience. The firm aims to help pension plans, endowments & foundations, healthcare systems, and private clients achieve their investment goals and maximize their impact on the world. Cambridge Associates delivers a range of services, including outsourced CIO, non-discretionary portfolio management, staff extension and alternative asset class mandates. Contact us today.