A Changed Investment Landscape Is Providing Greater Opportunity for US Corporate Pensions


Over the past decade, executives overseeing corporate defined benefit (DB) pension plans have experienced significant regulatory reform and a full reversal of investment conditions. While rising liabilities once offset asset gains, the opposite is now true. Yet many organizations haven’t recalibrated their approach to plan management in response, leaving them exposed to unnecessary costs and at risk of missed opportunities. Today, plan sponsors should be rethinking their plan’s strategic priorities and re-underwriting their investment approach.
New Dynamics, Old Strategies?
Plan sponsors today are operating in the aftermath of one of the fastest rate hikes in history and a prolonged yield curve inversion. Discount rate increases, along with strong equity performance since the March 2020 COVID-19 bottom, have powered significant improvements in funded status (Figure 1). These factors have proven especially beneficial to plan sponsors with underfunded and underhedged plans, helping them catch up with those that have spent the past decade contributing to their plans and increasing their liability-hedging targets.
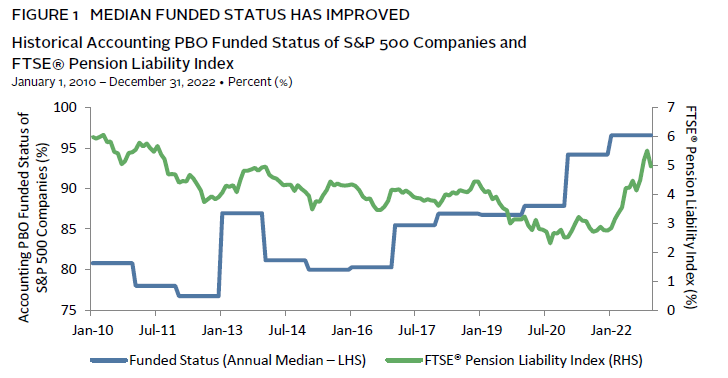
Notes: S&P 500 companies with funded status lower than 50% excluded from the median funded status figure to offset the impact of Non-Qualified Obligations on funded status. The FTSE® Pension Liability Index is derived from the FTSE® Pension Discount Curve, which is based on a set of yields on hypothetical AA zero coupon bonds whose maturities range from 6 months up to 30 years.
Most DB plans today also have much improved risk profiles. Funding relief regulations such as MAP21 1 and ARPA 2 have stabilized the interest rates used for determining plan contributions and lengthened the time periods available to plans for addressing funding shortfalls (Figure 2). These measures have helped to make funding more predictable over the long term by using a moving average yield to determine funding requirements. As a result, pension plans have much lower contribution risk as compared to two decades ago. Even with the steep rise in discount rates devaluing some of the cost savings from these regulations, it is still important for plan sponsors to recognize that these changed dynamics are likely here to stay. What’s more, they may need to reconsider how they manage their plan to remain on track for long-term success.
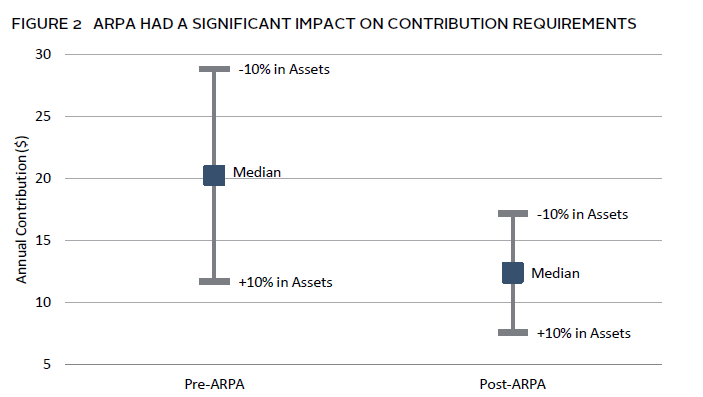
Note: Sample plan that is 90% funded with ~$500 million in Funding Target liability and $8 million in normal cost.
Shifting Gears
Plan sponsors have four key levers to manage their pensions—asset returns, liability hedges, contribution policy, and benefit management (Figure 3). While these levers do not change over time, how they are operated should, as plan sponsors look to remain on track with plan goals and objectives. Whether a plan is recently closed, frozen, or open, the observations we share below are broadly applicable to ensuring its optimized management.
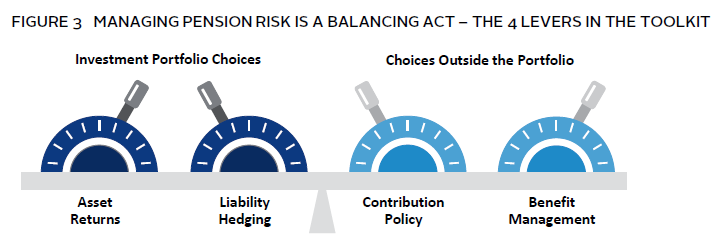
Source: Cambridge Associates LLC.
Growth Assets: Meeting New Goals Amid New Risks
Key Takeaways
- Despite higher interest rates, growth assets remain critical.
- Private credit strategies can help plans enhance diversification and manage volatility risk.
- Tailored private equity strategies can help achieve critical growth goals.
- Without validating their true liquidity needs, plans may be putting themselves at a disadvantage.
Although many plans today are well funded and well hedged, growth assets remain a critical component of overall plan health, helping to offset administrative expenses, unfavorable demographic trends, actuarial assumption changes, and other unhedgeable aspects of liabilities. As later discussed in the benefits management section of this paper, a properly executed growth strategy can also increase a plan’s overall value to an enterprise by reducing the cost of retirement and other employee benefits and by funding other organizational priorities.
Even though many plans have been focused recently on investing in a higher interest rate environment, these allocations alone may not provide adequate diversification in the event of market volatility. This volatility could be driven by multiple variables, including additional interest rate changes, an economic recession, increased pressure in the banking sector, heightened geopolitical tensions, or any black swan event.
Private credit, high-yield fixed income, hedge funds, and real assets are all strategies with the potential to help enhance diversification, provide downside protection, and achieve superior returns. Of these strategies, private credit can be particularly advantageous. Higher yields, coupled with a floating rate structure, may prove beneficial in a rising rate environment, with some strategies providing risk mitigation due to senior standing in companies’ capital structure. As with any private asset class, however, conducting robust due diligence will help achieve superior returns and avoid strategies that appear favorable on the outside but may contain hidden risks on the inside, such as subpar lending standards, poor execution, and unfavorable deal flow.
As plan sponsors evaluate their growth-oriented options, they should validate their true liquidity needs. Doing so may enable them to unlock their portfolio’s full growth potential by using excess liquidity to take advantage of opportunities in higher return, generating private equity investments (Figure 4). A liquidity coverage ratio of 2x to 3x can help ensure a portfolio is positioned to tolerate periods of market stress.
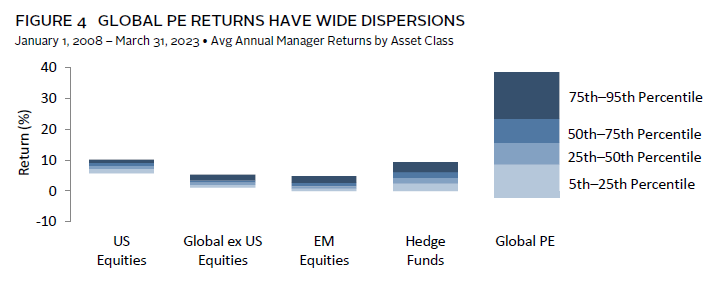
Notes: Returns for bond, equity, and hedge fund managers are average annual compound returns (AACRs) for the 15 years ended March 31, 2023, and only managers with performance available for the entire period are included. Returns for private investment managers are horizon internal rates of return (IRRs) calculated since inception to March 31, 2023. Time-weighted returns (AACRs) and money-weighted returns (IRRs) are not directly comparable. Cambridge Associates LLC’s (CA) bond, equity, and hedge fund manager universe statistics are derived from CA’s proprietary Investment Manager Database. Managers that do not report in US dollars, exclude cash reserves from reported total returns, or have less than $50 million in product assets are excluded. Performance of bond and public equity managers is generally reported gross of investment management fees. Hedge fund managers generally report performance net of investment management fees and performance fees. CA derives its private benchmarks from the financial information contained in its proprietary database of private investment funds. The pooled returns represent the net end-to-end rates of return calculated on the aggregate of all cash flows and market values as reported to Cambridge Associates by the funds’ general partners in their quarterly and annual audited financial reports. These returns are net of management fees, expenses, and performance fees that take the form of a carried interest. Vintage years include 2008–19.
The liquidity risk of private investments in a pension portfolio varies depending on its net cash flow. As net distributions increase, the optimal allocation to private investments decreases (Figure 5). Partnering with experts in the private investment space is crucial to understanding the implications of these cash flow dynamics. The days of investors shooting in the dark to build out private investment allocations are over, as data and technology improvements make it easier to analyze liquidity requirements in an asset/liability context.
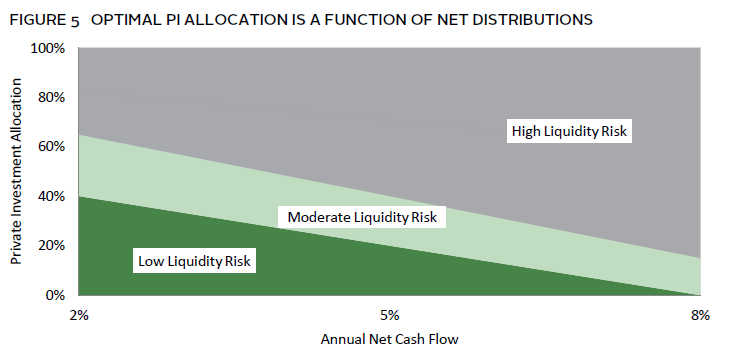
Notes: Analysis assumes a diversified private investment program consisting of PE/VC, Real Assets, and Private Credit. Pool growth of 4% assumed under base case, stressed under various Monte-Carlo simulations. Assumed distributions and contributions based on Cambridge Associates data, also stressed under various Monte-Carlo simulation environments. Liquidity risk measured using three-year Liquidity Coverage Ratio (LCR) [Liquid Assets + Anticipated Distributions + Employer/Employee Contributions)/(Benefit Payments + Expenses + Capital Calls]. Low Liquidity Risk reflects LCR > 1.5, Moderate Liquidity Risk reflects 1.5 < LCR < 1, High Liquidity Risk reflects LCR < 1.
Liability Hedging: Less May Be More
Key Takeaways
- Improvements in funded status require risk management reconsiderations.
- Today, more hedging can be achieved with fewer dollars.
- Non-traditional instruments can pick up incremental yield while reducing interest rate risk.
Many plan sponsors have been highly focused on increasing long-duration liability-hedging assets in recent years. However, it may be time to reconsider how to manage liability risk going forward, including the appropriate amount of capital committed to these strategies and the optimal mix of credit duration. As always, a plan’s liability-hedging strategy is informed by its funded status. It follows that improvements in funded status should inspire a revised approach to liability hedging. As plan sponsors consider their options in today’s investment landscape, they now have a better set of tools at their disposal.
For example, because the accounting discount rate for single-employer pension liabilities is based on the Aa yield curve, a portfolio of duration-matched bonds can provide a good hedge against interest rate volatility. The earlier use of a completion manager may also help to keep higher hedging ratios, while also freeing up capital to implement more effective credit risk management and achieve additional exposure to growth assets.
It’s important for plan sponsors to recognize that the old paradigm of devoting the vast majority of plan assets to liability hedging should evolve into a more balanced approach. In fact, with liability durations decreasing relative to many fixed income assets today, more hedging can be achieved with fewer dollars. Less commonly used investment strategies, such as intermediate credit, also can play a role here. They can offer multiple potential benefits, including increased yields, liability carry offset, and better credit curve exposure, which in turn can result in lower volatility and higher returns.
Plan sponsors should also evaluate the overall fit and relative importance of liability hedging for their plans. There is now diminishing marginal utility in hedging the “last-mile risk” in pension portfolios with more capital. In some cases, an excessive hedging effort may result in a lower returning liability-driven investment (LDI) program, which decreases the efficiency of not only the liability-hedging assets, but the entire portfolio. Instead, plans may pick up incremental yield by adding non-traditional instruments for hedging, such as private investment-grade credit, commercial mortgage loans, and securitized assets. This may help the liability-hedging portfolio keep pace with the higher interest cost on liabilities, while still reducing interest rate risk through completion or other Treasury strategies. Figure 6 depicts how allocating only 30% of the liability-hedging portfolio to more diverse hedging assets can result in 50 basis points of extra annual yield.
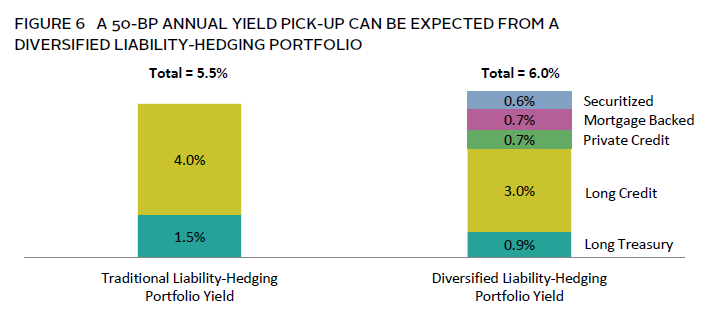
Notes: Traditional Liability-Hedging Portfolio is 33% invested in Long Treasury and 67% invested in Long Credit. Diversified Liability-Hedging Portfolio is 20% invested in Long Treasury, 50% in Long Credit, with the remaining 30% evenly split across Private Credit, Mortgage Backed, and Securitized. Private Credit assumes investment-grade private credit with a 1 percentage point yield pick-up over the Bloomberg US Long Credit Index. Mortgage Backed is benchmarked to CML, which yield 1.5%–2.0% over corporates. Securitized assumes a blend of CMBS/ABS/RMBS.
For plan sponsors whose main objective is controlling or minimizing contribution requirements, hedging liabilities may introduce additional risk. In this scenario, plans should consider blending total return investment approaches with specialized liability-hedging programs to achieve the optimal outcome. The recent rise in discount rates has also presented a new option—adjusting contribution requirements to be based on mark-to-market liabilities. This option allows a liability-hedging program to not only reduce accounting funded status risk, but also contribution risk.
Contributions: A New Paradigm
Key Takeaways
- Plans today can be less concerned with contribution volatility thanks to positive regulatory change.
- A lighter contribution load may mean more available capital for other enterprise goals.
- For most, contribution risk should be considered separately from funded status risk.
- In a changed rate environment, sponsors should reconsider how they align accounting and funding target methodologies.
Even if plans should experience negative asset returns in the near term, they can afford to be less concerned about contribution volatility due to the favorable impact of regulatory changes on funding target 3 calculations. The significant funding relief options passed in the last decade have resulted in the adoption of higher interest rates for minimum required contribution calculations. For example, plans are allowed to discount liabilities using 25-year moving average rates, which are then bound by interest rate corridors. When higher discount rates are used, liabilities are lower, which leads to higher funded status and lower contribution requirements.
In addition, due to new shortfall smoothing rules, a decline in funded status will no longer result in exceedingly high mandatory contributions. This changed regulatory backdrop, coupled with revamped asset and liability management options, effectively lightens the load for plan sponsors, potentially freeing up corporate assets for other purposes, including critical enterprise goals.
Contribution risk should generally be considered separately from funded status risk, since the duration for liabilities used to determine contribution requirements is essentially zero. While the use of long-duration fixed income strategies is beneficial to hedge long-duration accounting liabilities, it has a countereffect for liabilities with zero duration. While this wasn’t much of an issue when interest rates were low, the disparity is presenting a bigger opportunity in today’s higher interest rate environment. Well-hedged plans can consider aligning accounting and funding target methodologies through the Full Yield Curve approach, which may not only reduce expected contribution requirements, but eliminate much of the contribution volatility risk.
Underhedged plans should be more cognizant of the difference and focus on controlling the risk that is most important for them—balance sheet or contribution volatility. Even under the stabilized interest rate approach, certain aspects of pension management, such as Pension Benefit Guaranty Corporation (PBGC) premiums, are sensitive to interest rate changes. The most risk-efficient plan portfolios often blend traditional investments with LDI strategies in accordance with plan sponsor objectives and circumstances.
Benefits Management: Reassessment Required
Key Takeaways
- DB plans should be positioned to serve as a corporate asset—not a burden.
- Those sponsors seeking to terminate should reconsider how they approach de-risking.
- Underfunded plans considering PRTs should fully understand the implications and costs involved.
- Achieving a surplus position is never easy or risk free—next steps should prioritize the plan’s specific needs and goals.
Multiple benefits management approaches are always available to plan sponsors. These include plan termination, hibernation, partial risk transfer, future benefit modification, maintaining an open plan, or even re-opening one. Each of these approaches carries direct and indirect costs and risks. A close consideration of the plan sponsor’s specific needs and goals will help determine the right way forward.
Many plan sponsors can evolve their DB plans from feeling like a burden to feeling like an asset, one that supports corporate goals and financial health. Thanks to effective benefit management—combined with more supportive plan regulations and tools for generating asset growth and managing liabilities and contributions—plan sponsors are able to extend the life of their DB plans. Well- and over-funded pensions can become a point of differentiation for these enterprises and a valuable tool in attracting and retaining talent for the organization. Surplus plan assets also can be used in other ways that are long-term value additive to an organization, including mergers & acquisitions activity and retiree medical benefits. As plan sponsors consider a DB plan restart, expansion, or extension, they are likely to find that DB plans come at a marginal cost compared to defined-contribution plans. In fact, the National Institute on Retirement Security estimated that a DB plan costs 27% less than an “ideal” defined-contribution plan—one with fees below the industry average delivering strong performance. 4
Those sponsors closer to the termination side of the spectrum should consider how they can approach de-risking economically. For instance, many lean toward offering a lump sum payment option to plan participants; in this scenario, participants who receive a payment are no longer due a benefit from the plan. While this seems routine enough, it is important that payments be apportioned strategically so they result in less assets transferred than the liability. Generally, cost savings occur during declining interest rate environments that generate a lower lump sum payment relative to the market-to-market liability. However, this strategy can backfire in a rising rate environment and result in many plan sponsors having to contribute capital in order to terminate as lump sums become more expensive than buying annuities. Similar issues can occur for plans opting for pension risk transfers (PRTs) via lump sum windows.
Partial PRTs are commonly used with the idea of reducing plan size for purposes of PBGC premium savings. However, for most underfunded plans, this kind of transaction may actually negatively impact funded status and increase plan costs and PBGC premiums over the long term—even if the amount of assets transferred is less than the liability (or a gain to the plan). All sponsors should fully understand the implications of PRTs in terms of funded status, risk reduction, and future costs for their plan. For many plans, managing risk through asset allocation decisions is more effective.
Achieving a surplus position is never easy or risk free—and may be prohibited by many glidepath designs, especially those that aim to lock in funded status at a point just above 100% funded. For this reason, plan sponsors should reconsider the end stage of their glidepath, given the utility of a surplus and the potentially higher funded status needed to terminate without cost if a previous PRT has already been performed. Plan sponsors wishing to use surplus assets may find that increasing allocation to growth strategies could be advantageous as the plan moves higher in funded status, with the notion that the further away the plan is from becoming underfunded, the more risk a plan can take in pursuit of higher surplus.
Adaptability Is Key
Although pension plans today are experiencing much improved funded status relative to years past, the extent to which they take advantage of the opportunities made available by favorable improvements in funding and regulations will be a key determinant of their future health.
In all market conditions, the four levers that plan sponsors control as they seek to accomplish their objectives remain the same. However, an informed, adaptive approach to the operation of each will help ensure continued plan success over the near and long term. Plan sponsors are strategizing for growth and managing risk in in a significantly different investment environment. To accomplish their goals, it is imperative that these changes be taken into consideration. By taking a fresh look at their investment strategies and plan management, organizations have an opportunity to adapt, evolve, and reap significant benefits.
Bloomberg US Long Credit Index
The Bloomberg US Long Credit Index represents long-term corporate bonds. It measures the performance of the long-term sector of the United States investment-bond market, which, as defined by the Long Credit Index, includes investment-grade corporate debt and sovereign, supranational, local-authority and non-US agency bonds that are dollar denominated and have a remaining maturity of greater than or equal to ten years.
Cambridge Associates LLC Indexes
CA manager universe statistics are derived from CA’s proprietary Investment Manager Database. Managers that do not report in US dollars, exclude cash reserves from reported total returns, or have less than $50 million in product assets are excluded. Performance results are generally gross of investment management fees (except hedge funds, which are generally net of management fees and performance fees). To be included in analysis of any period longer than one quarter, managers must have had performance available for the full period. Statistics are not reported for universes with fewer than ten managers. Number of managers included in medians (and noted on each exhibit) varies widely among asset classes/substrategies.
FTSE® Pension Liability Index
The FTSE Pension Liability Index reflects the discount rate that can be used to value liabilities for GAAP reporting purposes. Created in 1994, it is a trusted source for plan sponsors and actuaries to value defined-benefit pension liabilities in compliance with the SEC’s and FASB’s requirements on the establishment of a discount rate. The index also provides an investment performance benchmark for asset-liability management. By monitoring the index’s returns over time, investors can gauge changes in the value of pension liabilities.
Footnotes
- The Moving Ahead for Progress in the 21st Century Act of 2012, or MAP21, represents the first funding relief since the Pension Protection Act (PPA) of 2008.
- The America Rescue Plan Act (ARPA) funding relief of 2021 significantly reduces funding requirements by introducing a floor on the interest rates used for discounting liabilities, and a longer amortization period (from seven years to 15 years).
- The Funding Target methodology is used to determine the plan’s minimum required contributions under ERISA and the Pension Protection Act of 2006 (PPA).
- See Dan Doonan and William B. Forina, “A Better Bang for the Buck 3.0,” National Institute on Retirement Security, January 2022.
Serge Agres, CFA, FSA, EA - Serge Agres is a Managing Director and Investment Actuary at Cambridge Associates.
Cathy Xu, CFA - Cathy Xu is a Senior Investment Director for the Retirement, Insurance & Government Practice at Cambridge Associates.
About Cambridge Associates
Cambridge Associates is a global investment firm with 50+ years of institutional investing experience. The firm aims to help pension plans, endowments & foundations, healthcare systems, and private clients achieve their investment goals and maximize their impact on the world. Cambridge Associates delivers a range of services, including outsourced CIO, non-discretionary portfolio management, staff extension and alternative asset class mandates. Contact us today.