VantagePoint: Third Quarter 2017

Advice in Brief
- Continued economic growth should be expected to be met with monetary policy normalization; however, central bankers are unlikely to be in a rush, especially absent any signs of inflation. We continue to believe these conditions provide a supportive environment for risky assets, while recognizing diversification remains critical.
- US equities are now at very overvalued levels, suggesting an underweight would be sensible. We recommend investors take some profits, moving to at least neutral, or preferably underweight, positions in US equities.
- Evidence is building that market forces have started to rotate in favor of non-US companies after a long stretch of US equity outperformance. We have broadened our previously recommended overweight to Asia ex Japan to global ex US equities. Developed ex US equities are also fairly valued, and both developed ex US and emerging markets equities offer similar earnings growth prospects to the US market.
- Valuations will eventually matter, and strong fundamentals, diversification, flexibility to take advantage of dislocations, and the ability to deliver alpha through implementation all remain important.
Portfolio Tilts From CA’s Chief Investment Strategist
Goldilocks is in the hot seat. The first half of this year was marked by gradually improving global economic conditions, falling inflation expectations, mildly falling rates, and easy liquidity conditions even as the US Federal Reserve has been slowly raising policy rates. Under such conditions, risk assets of all sorts appreciated as a record number of market professionals described the economy as a high growth, low inflation, Goldilocks environment. However, in the final days of the second quarter, the European Central Bank (ECB), Bank of England, and Bank of Canada raised the specter that policymakers may tighten faster than anticipated. Add a 20% peak-to-trough decline in oil and a defiant North Korea flexing its military muscle, and investors are understandably getting a little worried that the bears will come home and force Goldilocks to make a hasty exit.
As discussed in last quarter’s VantagePoint, continued economic growth should be expected to be met with monetary policy normalization, particularly in the Eurozone, where the ECB will run up against constraints on asset purchases early next year, and the German economy is running too hot for current policy. It remains to be seen how quickly central banks will move, but it seems unlikely that they will be in a rush, especially absent any signs of inflation. Overall, the global economy is experiencing moderate growth and inflation remains in check. We continue to believe these conditions provide a supportive environment for risky assets, while recognizing diversification remains critical.
In this edition of VantagePoint, we discuss the elevated price risk in US equities, which are now at very overvalued levels, suggesting an underweight would be sensible. Further, evidence is building that market forces have started to rotate in favor of non-US companies after a long stretch of US equity outperformance. Following the strong rally in Asia ex Japan and emerging markets equities over the last 15 months, such equities are now fairly valued. Given these dynamics, we have broadened our previously recommended overweight to Asia ex Japan to global ex US equities. Developed ex US equities are also fairly valued, and both developed ex US and emerging markets equities offer similar earnings growth prospects to the US market.
US Equities Up and Up
US equities seem unstoppable. We had expected they would sell off if expectations for tax cuts and other fiscal policy initiatives diminished. However, even as the market has undergone a significant rotation, with so-called Trump trades fully reversing, the equity bull market has continued to run.
The market has been propelled by improved earnings prospects, as the consensus now expects double-digit earnings growth in 2017 and 2018 following two years of flat earnings. While 2017 and 2018 earnings expectations have been revised down, such revisions are the norm, and the current revisions are tracking historical average downgrades since 1996. Breadth of earnings momentum is strong, with a positive ratio of positive to negative earnings revisions for this year and next year throughout the second quarter—a relatively rare occurrence typically preceding sustained earnings strength.
The market first beat its October 2007 all-time high in March 2013. Later that year, our composite normalized price-earnings (P/E) metric crossed 20 and has moved in a narrow range of 20–23 ever since. 1 In July 2016, the market finally broke through its prior inflation-adjusted peak. Valuations have become even more stretched this year, reaching the top 10th percentile of historical valuations at the end of May. Valuations typically don’t matter much until they get to these extremes. The market is now vulnerable to disappointment. We recommend investors take some profits, moving to at least neutral, or preferably underweight, positions in US equities.
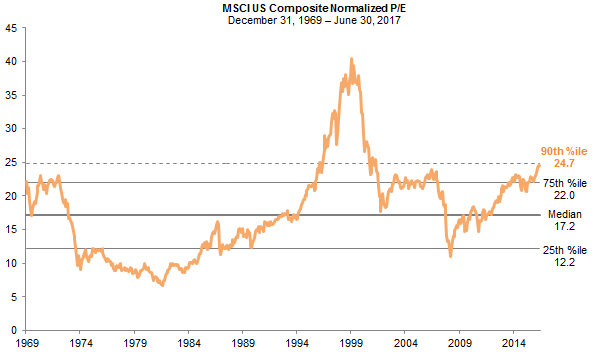
US equities are very expensive
Sources: MSCI Inc. and Thomson Reuters Datastream. MSCI data provided “as is” without any express or implied warranties.
Small caps seem the most expensive and vulnerable US equity market segment. We maintain our recommendation to underweight US small-cap stocks in favor of high-quality stocks. US small caps today are about as expensive as they have ever been, at the 99th percentile of historical valuations (based on our composite normalized P/E metric). Over 30% of small-cap companies have no or negative earnings. True, debt ratios are reasonable compared to historical levels, but small-cap companies are relatively vulnerable to rising rates as roughly one-half of their debt is floating rate. However, even with this vulnerability, timing is always very unclear and investors must exercise patience. It can take years for markets to finally top out. In 1997, US equities hit extreme valuations not seen since 1929, but continued to climb 60% through March 2000 before the tech and telecom bubble gave way to a bear market.
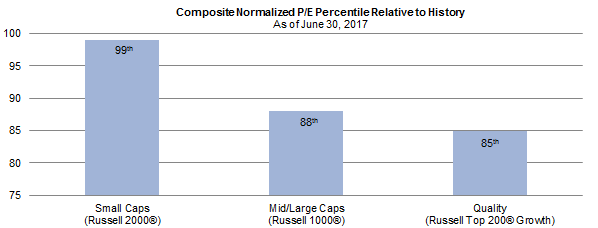
US small-cap stocks are even more expensive
Sources: Frank Russell Company, FTSE International Limited, and Thomson Reuters Datastream.
Typical indicators that foreshadow a market peak are signaling that the US economic cycle is in its late stages, but still could see another 12–24 months before the cycle ends. Many observers have also focused on how dominated the market has been by just a handful of stocks (Alphabet [Google], Amazon, Apple, Facebook, Microsoft, and Netflix) and argue that the narrow market leadership portends an end to the bull market in US equities. We disagree. There is a higher degree of concentration than is typical in the tech sector, but outside of that, the market advance this year has been reasonably broad based. Markets are vulnerable to a correction, particularly in the more expensive market darlings, but market internals have otherwise been fairly normal, suggesting this bull may still have some legs.
Late Cycle, But How Long? The unemployment rate and the slope of the yield curve are particularly useful indicators in evaluating the current stage of the economic cycle. Economic expansions end when the employment trend turns negative and access to credit becomes constrained. The unemployment rate can only fall so much before putting pressure on wages amid a tight labor supply. Rising wages are usually accompanied by broader inflationary pressures that encourage central banks to continue tightening. The yield curve typically flattens and ultimately inverts, making it unprofitable for banks to lend. Analysis of the current cycle through this lens suggests an ongoing US expansion that is in the late stages but not yet losing momentum. Unemployment is low, but still falling, and the yield curve is flattening, but has not inverted.
While levels of unemployment below 4% were typical during cycles before 1970, in the modern era unemployment in the 4%–5% range is about as low as it gets. The lowest unemployment rate of the post-1970 era was 3.9% at the end of the 2000 cycle. At 4.4% as of June 2017, the unemployment rate is pretty close to this bottom. To the degree that underemployed persons move back into the labor force, this could prolong the cycle. Indeed, the unemployment rate increased from 4.3% in May to 4.4% in June as more people joined the labor force. The relatively more encompassing U-6 unemployment rate is slightly more elevated relative to historical bottoms, but not by much.
As of the end of June, the spread between ten-year and two-year Treasury yields was 98 basis points (bps), well above the historical median spread of 72 bps. Historically, we have found that yield curve inversions lead bottoms in the unemployment rate, both of which tend to lead peaks in the equity market. If the current cycle is “average” by historical standards, we wouldn’t anticipate a near-term bottom in unemployment, as the yield curve has not yet inverted. On average, equity market peaks lag a yield curve inversion by more than a year, with the past four cycles ranging from roughly coincident (1973) to a 28-month lag (1980). Consequently, the current cycle may have the ability to last for another year or two.
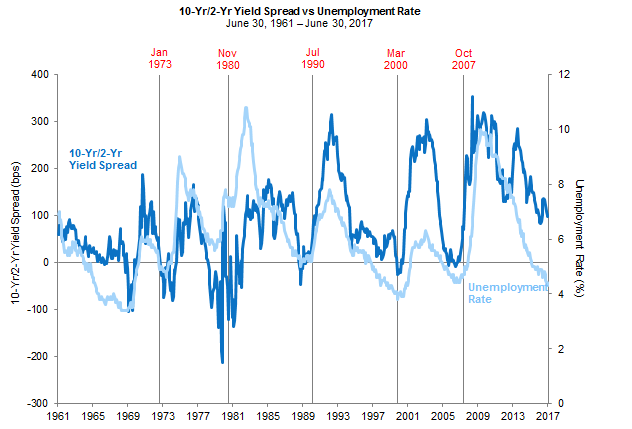
The yield spread follows the same cycle as the unemployment rate
Sources: Federal Reserve Bank of New York, Thomson Reuters Datastream, and US Department of Labor – Bureau of Labor Statistics.
Note: Dates in red represent equity peaks preceding recessions.
FANG, FAAMG, FAMANG, Whatever. The five largest stocks by market capitalization in the S&P 500 have made strong contributions to S&P 500 returns this year, causing many pundits to bemoan that market leadership is narrow and that markets could be poised for a reversal. While we agree that the market may be overdue for a sell-off, our reasoning has more to do with the pace of its ascent and very high valuations. The market is not excessively concentrated, strong performance has been broad based, market breadth is healthy, and earnings momentum is positive.
The five largest stocks in the S&P 500 are Apple, Google (Alphabet), 2 Microsoft, Amazon, and Facebook, which Goldman Sachs has dubbed the FAAMGs, a modification of a previous moniker, FANG, that included Netflix and excluded index heavyweights Apple and Microsoft. Goldman excluded Netflix as it has a smaller weight in the index. Other researchers have included both Netflix and Microsoft (FAMANG). You can call them whatever you like, but they are not independently responsible for the market’s run this year, as some pundits would have you believe. The FAAMGs make up 12% of the S&P 500 market capitalization, while adding the next five largest stocks accounts for about 20% of the index, approximately average concentrations for the top five and ten stocks historically. Their large index weights do mean these stocks pack a punch for total index performance. However, the real story is that this is normal.
The contribution of FAAMG to total S&P 500 returns is not particularly extraordinary by historical standards. These companies accounted for roughly 30% of the S&P 500 return during the first half of this year; high, but not at all unusual and well below the five largest stocks’ extreme return contribution seen in the second half of 2015 and the first half of 2000. Readers may be surprised to see that among S&P 500 stocks, Facebook’s first half 2017 return ranks 37th; Amazon, 45th; and Apple, 74th; while Alphabet and Microsoft didn’t make it into the top 100. More impressively, 249 of the 499 stocks analyzed outperformed the index in the first half of 2017, and the ratio of stocks advancing to stocks declining is nearly 2 to 1—pretty unremarkable. After seeing the data, it is hard to argue that performance leadership has been narrow.
What is somewhat exceptional today is the concentration of the tech sector in the index as a whole and of the largest stocks within the tech sector. Tech stocks account for 22% of the index market cap, well above the 15% historical average, but well below peak weights of 33% reached during the tech bubble. Year-to-date, the tech sector has dominated, returning 17.2%, but health care was right behind it at 16.1%, while consumer discretionary and industrials also outperformed the market. The performance of these sectors is more extraordinary when taken in the context of the big gap between these stars and the worst performers—energy and telecom returned -12.6% and -10.7%, respectively. This gap in sector performance is near the 80th percentile of semiannual sector return differentials dating back to 1990.
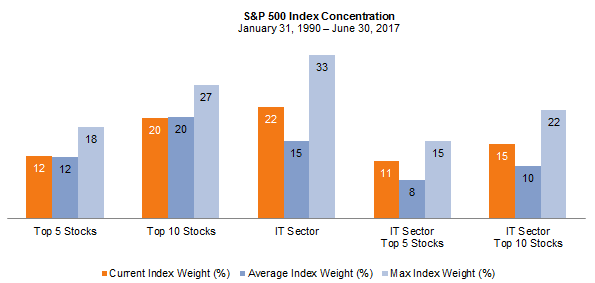
US equity market is not more concentrated than usual
Sources: FactSet Research Systems and Standard & Poor’s.
Note: As of June 30, 2017, the top five stocks in the S&P 500 were Alphabet (Google), Amazon, Apple, Facebook, and Microsoft.
The tech sector is valued at 24.9 on an ROE-adjusted P/E basis, just below the highest level reached (25.7 in October 2007) outside of the tech bubble, when this metric soared to 81. The FAAMG group of stocks, while not all classified as tech (Amazon is consumer discretionary), have even higher valuations than the tech sector and broad market. While these companies are disrupters in their fields and offer great potential for continued market dominance, they are expensive today. Based on analysis by Research Affiliates, which prefers the FANMAG acronym, this collection of six stocks is trading at a price-to-sales (P/S) ratio of 6.9, or a 67% premium to the S&P 500 as a whole. Over the last 60 years, 65% of stocks with a P/S ratio greater than 6 and earnings per share (EPS) exceeding the prior five-year average EPS underperformed the S&P 500 over the next ten-year period. Only ten stocks outperformed by 15% or more annualized while 38 underperformed by at least that margin. Risks seem skewed to the downside. As Marc Faber reminds us in his June 2017 Gloom, Boom & Doom Report, even companies with excellent prospects and very strong performance don’t move up in a straight line. Amazon has returned an annualized 36% since its IPO in 1997, yet suffered a drawdown of 94% over two years ended September 2001 from which it took eight years to finally recover.
All this suggests that the performance of US equities has not been excessively narrow on the whole. The fact that the largest stocks in the index are among the most expensive (while offering strong growth prospects) suggests that there is opportunity to be had by diverging from market cap–weighted indexes today. Further, as the US equity market is very overvalued on the whole, and remains expensive even if you exclude the FAAMG stocks from valuation calculations, we recommend investors underweight US equities relative to other equity markets.
What Has Been Will Be Again
For the last two years we have been closely watching for a shift in leadership in US equities versus other developed markets.[3] US outperformance peaked in November 2016, raising the prospect that the cycle has indeed turned. For the first half of the year, developed markets outside the United States have outperformed US equities in USD terms by a comfortable margin (12.8% versus 9.2% through June 30) and emerging markets equities have outperformed by more than twice that margin. Prospects for a continued turn in the cycle look promising, particularly since US equities are very overvalued, while other markets are fairly valued and economic and earnings momentum outside the United States has picked up. Further, the United States is at a later stage in the economic cycle than other markets, suggesting that continued economic growth is more likely to result in profit margins coming under pressure from rising wages and higher interest expenses than in other markets that maintain considerably more economic slack.
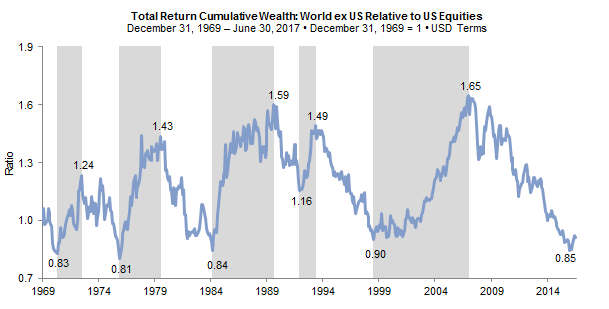
Time for US equities to give other markets a turn?
Source: MSCI Inc. MSCI data provided “as is” without any express or implied warranties.
Notes: World ex US represents MSCI EAFE ex Japan. Shaded areas denote MSCI EAFE ex Japan outperformance relative to MSCI US in USD.
For some time, we have recommended modest underweights to US equities paired with an overweight to Asia ex Japan equities or emerging markets more broadly. The main rationale was that emerging markets were undervalued, particularly in the more value-oriented economic sectors and countries. Today, after returning more than 30% in local currency terms and 40% in USD terms since March 2016, emerging markets are fairly valued on the whole, with comparable valuations to developed markets outside of the United States. As such, we have decided to diversify our overweight relative to US equities to include developed markets outside the United States in addition to emerging markets.
The Chinese Engine Is Slowing Again. Emerging markets and Asia ex Japan have outperformed developed markets over the last year amid a global “reflation trade” led by the growth rebound in China. The industrial sector in China experienced a “hard landing” in which nominal GDP growth slowed from 20% in 2011 to just 1% in early 2016. Even as the service sector held up relatively well, the decline in China’s industrial sector and weak global commodity prices led to poor performance in emerging markets equities overall. Chinese authorities aggressively eased monetary policy last year and increased fiscal stimulus, triggering a sharp rebound. Notably, industrial sector growth, which is more directly responsive to stimulus, was responsible for all of the rebound, as services growth was maintained at a 10%–11% range. Commodity prices and emerging markets equity performance also have revived over the last year or so. However, there are signs that the China rebound has peaked and that growth will slow over the coming quarters.
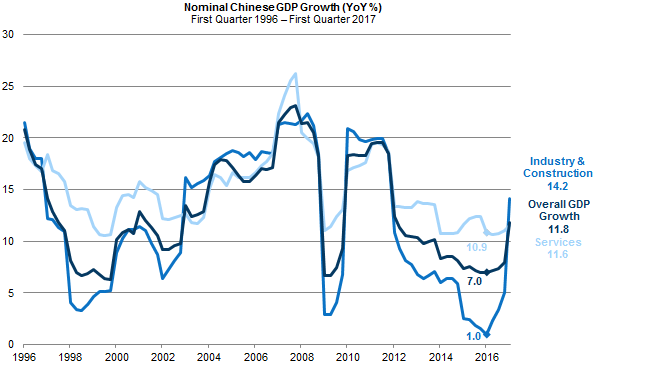
China’s industry kept alive by stimulus
Sources: National Bureau of Statistics of China and Thomson Reuters Datastream.
The People’s Bank of China (PBOC) has begun tightening monetary policy to combat growing leverage in the economy and other financial excesses. Corporate debt levels remain high, while leverage has been rising in the financial system as a whole, which has concerned policymakers and prompted policy tightening. The desire to support the currency to prevent capital outflows (and perhaps appease the Trump administration) has also played a part in the need to increase interest rates. Property prices in major cities provide another example of financial excesses. The rate of change has slowed sharply as new cooling measures have been put in place, such as increasing minimum down payments and placing restrictions on second or third property purchases and mortgage lending.
As the PBOC tightens monetary policy, the Chinese government bond yield curve has been flattening, with two-year yields rising more rapidly than ten-year yields. Similar periods of flat yield curves, such as 2011 and 2013, preceded growth slowdowns. With rising rates, cooling house prices, and a Beijing crackdown on leverage in the financial system, a slowdown in the Chinese economy should be expected over the coming quarters. At the same time, valuations for Asia ex Japan and emerging markets equities have moved from cheap to fairly valued levels, comparable to those of developed ex US equity markets.
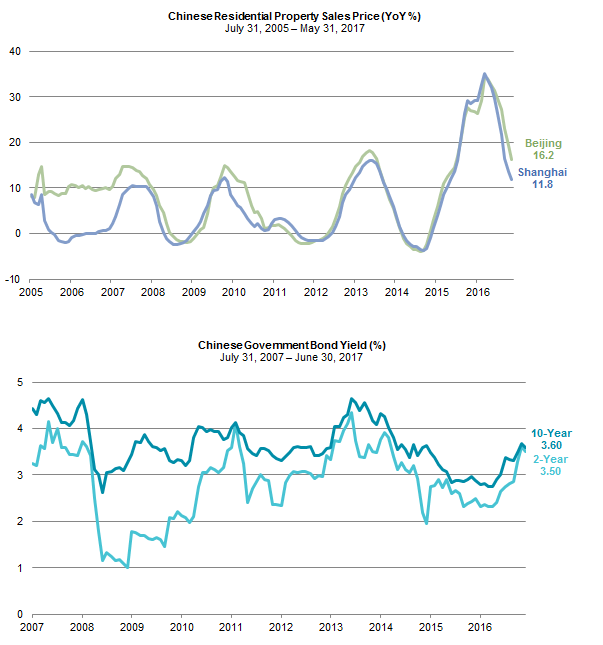
Efforts to cool excesses challenge the recovery’s sustainability
Sources: MSCI Inc., National Bureau of Statistics of China, and Thomson Reuters Datastream. MSCI data provided “as is” without any express or implied warranties.
Note: Residential property sales price is based on average of new and existing home prices.
Improving Prospects for Non-US Developed Markets. Prospects for developed markets equities seem at least as good as for emerging markets relative to the United States. While political risks remain and will continue to usher in uncertainty regarding prospects for economies, earnings growth, and currencies, recent months have seen some improvements. Political risks in the Eurozone have moderated considerably this year with the defeat of populists in Dutch elections in March and the election of the staunchly pro-European Emmanuel Macron as France’s president. Macron’s party’s strong showing in the National Assembly elections has opened the possibility that Macron will be able to push through labor reforms, perhaps serving as a bargaining point with Germany in exchange for movement toward a common European budget and sharing of fiscal responsibility after the German election in September.
Italian elections remain a potential flashpoint for Europe. Elections must be held by May 2018 amid political instability following roughly a decade of low economic growth, high unemployment, and elevated debt levels. Even as the Italian economy has been lagging other Eurozone countries, conditions are improving for now, providing some easing of political pressure. Importantly, European Union authorities agreed in June to allow Italy to circumvent the EU’s Bank Recovery and Resolution Directive (BRRD). They approved use of as much as €17 billion in Italian taxpayer receipts to bail out the banking system, protecting senior bondholders and depositors in two large regional Italian banks, Veneto Banca and Banca Popolare di Vicenza. The BRRD provisions were preventing Italy from cleaning up its troubled banking sector using the tools Germany, Ireland, and Spain had at their disposal. While such a bending of the rules could have been allowed at any point over the last couple of years, as Italy’s banks were in obvious distress, the French election results and renewed prospects for Eurozone financial sector integration may have pushed along this process.
Political and economic risks in the United Kingdom, in contrast, appear to be on the rise. The loss of the Conservative party majority in Parliament in the June 7 snap election called by Prime Minister Theresa May in a failed effort to increase her party’s majority has raised uncertainty regarding “Brexit” negotiations. The absence of a Parliamentary majority means the UK’s Brexit negotiating position is not stable and, whatever the outcome, will probably fail to be approved by a majority in Parliament. The uncertainty now surrounding the government and Brexit will send animal spirits into hibernation. Already the UK economy is showing some signs of faltering. PMI data have become choppy, and the consumer, who has increasingly been borrowing to support spending levels, is wilting under the pressure of falling real incomes.
In contrast, economic conditions in Japan have improved recently, with the economy expanding for five straight quarters, and a rise in personal consumption and export growth over the last year. We continue to see improvements in corporate governance as an important driver of profitability and increased returns to shareholders, as corporations are gradually starting to focus on governance issues, including increasing dividends and share buybacks under urging from the government and other stakeholders. Challenges remain, including the volatility in Japanese equity shares associated with yen moves and, over the long term, the growth drag from a declining population.
Across these markets, earnings growth and expectations for forward growth have mirrored improved economic conditions. For example, after falling for the better part of the last five years, Eurozone earnings have turned up, while UK earnings remain stagnant. Similarly, after hitting a rough patch last year, Japanese equity earnings growth has resumed. Relative to the United States, earnings growth prospects for the Eurozone, Japan, and emerging markets over the next two years are at least as good, if not better, while valuations are favorable. If earnings growth is sustained, this valuation gap should narrow, with non-US markets rerating to higher valuations. As earnings are more depressed relative to US equities and the economic cycle is less advanced, non-US earnings will likely grow more rapidly providing the economic expansion persists.
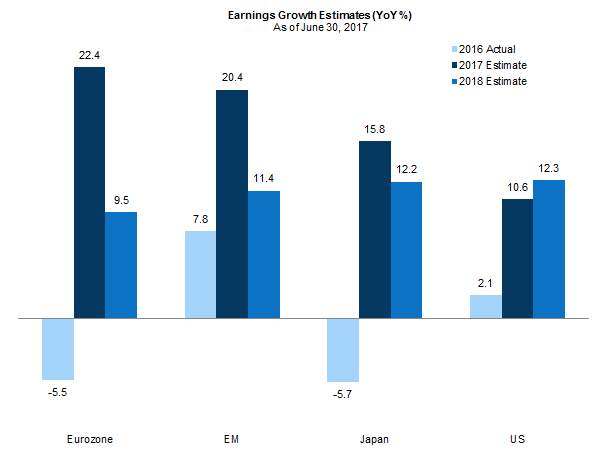
Non-US markets expected to close the gap on US earnings growth
Source: J.P. Morgan Securities, Inc.
Notes: Japan EPS growth/estimates are for its fiscal years ending March 31. For example, the 2017 estimate is for the period April 1, 2017, to March 31, 2018. Other regions are for the calendar year.
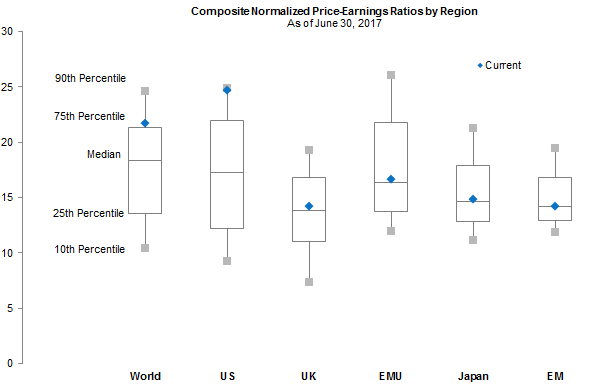
Nothing is cheap, but US is very expensive
Sources: MSCI Inc. and Thomson Reuters Datastream. MSCI data provided “as is” without any express or implied warranties.
Notes: Composite normalized price-earnings (P/E) ratio is used for World, US, UK, and EMU. Return on equity (ROE)–adjusted P/E ratio is used for Japan and EM. The composite normalized P/E ratio is calculated by dividing the inflation-adjusted index price by the simple average of three normalized earnings metrics: ten-year average real earnings (i.e., Shiller earnings), trend-line earnings, and ROE-adjusted earnings. Observation periods begin: January 31, 1970, for World; December 31, 1969, for US and UK; April 30, 1998, for EMU; January 31, 2002, for Japan; and September 30, 1995, for EM.
However, should economic expansion stall, US equities would likely outperform, even from elevated valuations, as the US market and US dollar tend to benefit from a “flight to quality” in times of stress. Therefore, our overweight to non-US equities is based on our expectation that economic and liquidity conditions will remain supportive for global equities, even as a correction would be not be unexpected given the recent sharp appreciation. Furthermore, extreme relative valuations suggest that over the long term, US equities should underperform from a starting point of today and that even in a downturn, relative underperformance of non-US equities would be mitigated by their more attractive starting valuations.
We discussed our shift from a positive to neutral view on the US dollar in the second quarter 2017 edition of VantagePoint, published April 10, 2017.
We are somewhat ambivalent about currency exposure today, as USD valuations relative to major developed markets currencies are elevated. Over the long term, the US dollar should lose ground, but in the short to intermediate term, we continue to think the greenback has more ground to gain this cycle. USD-based investors with a short investment horizon (e.g., two to three years) would be best served by hedging developed markets foreign currency exposure, and those in major non-USD base currencies are best unhedged from a short-term perspective. We would not hedge exposure to emerging markets currencies given their reasonable valuations and the high cost of carry of doing so.
Don’t Get Too Comfortable with Goldilocks; Stay Diversified
Risk assets have appreciated to overvalued or at least fully valued levels, while bond yields remain very low, and credit spreads tight. There has been no shortage of political risks around the world, yet markets have remained buoyant as global economic growth has broadened and the global profit recession has come to an end. Valuations will eventually matter, and strong fundamentals, diversification, flexibility to take advantage of dislocations, and the ability to deliver alpha through implementation all remain important.
Opportunities outside the United States extend to private investments. Given the potential for distress in Asia, Asian special situations and distressed investments offer appeal, especially if economic growth fails to deliver amid a China slowdown. Further, corporate governance improvements in Japan have been leading to opportunities in Japanese buyouts.
For more discussion, please see the second quarter 2017 edition of VantagePoint, published April 10, 2017.
With low sovereign bond yields, we continue to hunt for a variety of ways to remain diversified. Uncorrelated strategies that are less reliant on strong economic growth (e.g., life settlements) are among the most interesting. In addition, more liquid strategies like hedge funds with low equity and credit net exposures and trend-following strategies should be considered for this purpose. In places where yields are very low, like the Eurozone, cash provides a reasonable substitute for sovereign bonds that remain very overvalued.
While many real assets have become expensive, mid-stream energy master limited partnerships (MLPs), with yields of 7%, appear relatively attractive. Despite the 20% decline in oil prices, energy-related assets have not seen their valuations improve enough to change our advice. Commodity futures continue to suffer from ongoing contango and low returns on cash collateral, while natural resources equities are marginally undervalued and MLPs remain roughly fairly valued by our metrics. We continue to believe oil & gas prices will remain range-bound, and expect US production to continue to increase, benefitting MLPs’ volume-oriented revenue structure. We have become more cautious on private equity energy as fund raising has escalated, meriting a patient approach in pursuing new commitments.
Footnotes
- The composite normalized P/E ratio is calculated by dividing the inflation-adjusted index price by the simple average of three normalized earnings metrics: ten-year average real earnings (i.e., Shiller earnings), trend-line earnings, and return on equity (ROE)–adjusted earnings.
- Alphabet’s shares are split into two classes; the company is second largest when the weights of both tickers are combined.
Celia Dallas - Celia Dallas is the Chief Investment Strategist and a Partner at Cambridge Associates.
About Cambridge Associates
Cambridge Associates is a global investment firm with 50+ years of institutional investing experience. The firm aims to help pension plans, endowments & foundations, healthcare systems, and private clients achieve their investment goals and maximize their impact on the world. Cambridge Associates delivers a range of services, including outsourced CIO, non-discretionary portfolio management, staff extension and alternative asset class mandates. Contact us today.