US PE/VC Benchmark Commentary: First Half 2021

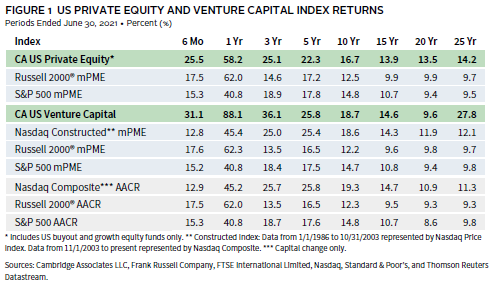
In the first half of 2021, US private equity and venture capital returns continued the torrid pace that started in second quarter 2020. For the six months ended June 30, 2021, the Cambridge Associates LLC US Private Equity Index® returned 25.5% (11.4% and 12.5% in first and second quarters, respectively) and the Cambridge Associates LLC US Venture Capital Index® gained 31.1% (16.9% and 12.1% in the first and second quarters, respectively). Within the two asset classes, “tech-enabled” businesses across sectors performed better than those whose operations relied on travel or in-person activity. Figure 1 depicts performance for the private asset classes compared to the public markets. Cambridge Associates’ mPME calculation is a private-to-public comparison that seeks to replicate private investment performance under public market conditions.
First Half 2021 Highlights
As of June 30, 2021, the private equity benchmark had outperformed the public indexes in all but one time period, the one-year horizon versus the small-cap index (the Russell 2000®). With its strong recent performance, the venture capital index has overtaken the public indexes in all time periods but one, the 20-year horizon against the NASDAQ Composite.
Within the indexes, public companies accounted for a larger portion of venture capital than of private equity (about 17% and less than 14%, respectively). In contrast, non-US companies have typically represented a larger portion of the private equity index than of the venture capital one, and, while these exposures have remained stable over time, there was a recent small uptick in both indexes (reaching almost 20% in private equity and more than 11% in venture capital).
US Private Equity Performance Insights
Vintage Years
As of June 2021, nine vintage years (2011–19) were meaningfully sized—representing at least 5% of the benchmark’s value—and, combined, accounted for 88% of the index’s value. Six-month returns among the meaningfully sized vintages were all in the double digits, ranging from 17.6% for vintage year 2013 to 34.8% for vintage year 2019 (Figure 2). The 14-year-“old” 2007 vintage represented 4.5% of the index’s value, falling shy of meaningfully sized for the first time in years. On the other hand, the inclusion of the 2019 vintage speaks to the speed with which managers are deploying capital.

While valuations went up across all sectors for the top-performing vintages (2019 and 2015), healthcare and IT companies rose above the rest in both; financials were also a key return driver in the 2015 fund group. In the lowest-returning vintage (2013), IT companies were by far the largest positive contributor and performance for healthcare trailed the higher returning vintages and the index at large. For further context, while IT performed well in the 2013 vintage, its return of 26.8% for the six months is much lower than the IT results in the stronger performing vintages (which were 51.9% and 37.0% for the 2015 and 2019 vintages, respectively).
Limited partner (LP) cash flows have been at historic highs in 2021. During the first two quarters of the year, fund managers distributed $87.9 billion and called $77.4 billion, which is the second highest amount of distributions and the highest level of capital calls for any six-month period ever. The “best” six-month period for distributions was the one ended in March 2021.
Four vintage years (2017–20) represented 87% ($67.5 billion) of the capital calls, with each drawing down at least $10 billion in first half 2021. Distributions were less concentrated, with nine vintage years (2006–07, 2011–17) each returning $4.6 billion or more, for a total of $74.1 billion (or 84% of the total). The 2014 and 2015 vintages alone distributed nearly $25 billion.
Sectors
Figure 3 shows the Global Industry Classification Standard (GICS®) sector breakdown by market value of the private equity index and a public market counterpart, the Russell 2000® Index. The comparison provides context when comparing the performance of the two indexes. The largest differences are in IT, where the private equity index’s exposure is nearly 3.0 times that of the Russell 2000® Index, and in financials, where the private equity index’s weight is about half of the public index’s weight. The chart also highlights less meaningful differences by weight in healthcare, consumer discretionary, communication services, and real estate, which are reflected in the “other” sector bucket.

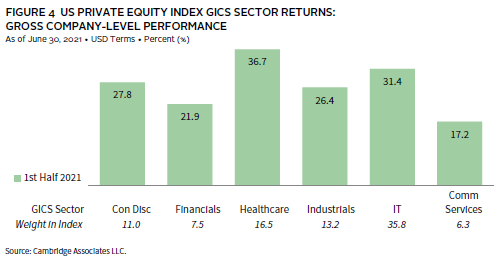
As of June 2021, among the six meaningfully sized sectors, IT remained the largest by a wide margin, representing almost 36% of the index’s value. This is more than double the next largest sector, healthcare, which also includes businesses considered to be technology or “tech enabled.” First half returns for the six sectors ranged from 17.2% (communication services) to 36.7% (healthcare) (Figure 4). Write-ups for healthcare companies were widespread, with multiple vintages earning 50% plus returns on their investments in the sector during the period. Write-ups in communication services (the smallest of the key sectors) were also widespread but much more muted than in healthcare, except for vintage year 2019, which returned over 81%. Consumer staples, the next-largest sector (excluded from Figure 4), continued to perform well amid the ongoing pandemic, posting a six-month return of 23.1%.
Investment activity in first half 2021 was dominated by four sectors. IT (46%), healthcare (12%), industrials (11%), and consumer discretionary (10%) attracted almost 80% of the capital invested, which is about 14 percentage points higher than the investments in these sectors over the long term. Driving the difference is the percentage of capital allocated to IT, which historically was about 24% of invested capital.
US Venture Capital Performance Insights
Vintage Years
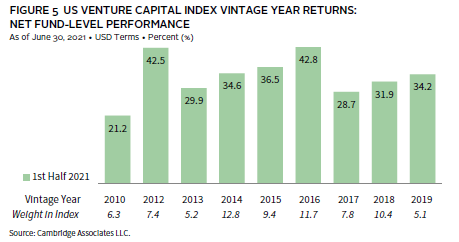
As of June 2021, nine vintage years (2010, 2012–19) were meaningfully sized and, combined, accounted for 76% of the index’s value. Performance among the key vintages was strong; only three posted results below 30%. The “oldest” vintage in the cohort, 2010, earned the lowest return (21.2%), and the 2016 vintage beat out the 2012 group for the best return (gaining 42.8% versus 42.5% for the 2012 funds) (Figure 5). With double-digit returns in each of the first two quarters of 2021, the US venture capital index has now posted four such quarters in a row for the first time since the late 1990s.
For the best-performing vintage (2016), IT, healthcare, financials, and communication services companies earned outsized returns, but by dollars, IT and healthcare had much larger impacts. In the second-best and lowest-performing vintages, 2012 and 2010, respectively, IT companies were hands down the largest positive performance driver.
In venture capital, as with private equity, LP cash flows have been at a historic level in 2021. In the first half of the year, managers called $19 billion (split equally between the two quarters) and distributed $40.4 billion (nearly $25 billion in the second quarter alone); that distribution amount was the highest for any six-month period ever and the calls were second only to the six months ended March 31, 2021. The only other time that the ratio of distributions to calls reached or exceeded 2 times was a few instances in the 1990s and in 2000.
Funds formed from 2017 to 2020 were responsible for almost 90% ($17 billion) of the total capital called during the first six months. Three of the four vintages (2018–20) each called more than $4.1 billion; the 2020 vintage led the way with capital calls of nearly $5.9 billion. Significant distributions were widespread, but the largest amounts were concentrated. While there were 11 vintages (2006–08, 2010–17) that distributed at least $1.1 billion (including three that are at least 13 years “old”), three vintage years (2011 and 2013–14) represented nearly 50% of the total distributions. Each of those three returned more than $6 billion to LPs during the first two quarters.
Sectors
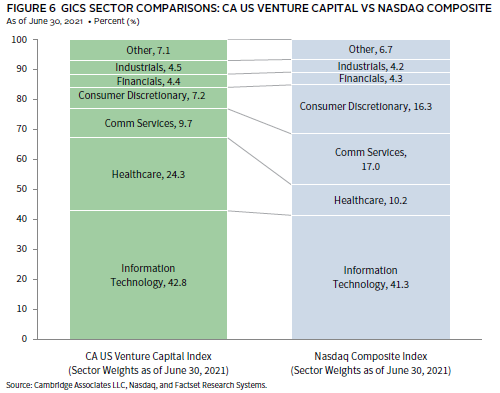
Figure 6 shows the GICS® sector breakdown of the venture capital index by market value and a public market counterpart, the NASDAQ Composite Index. The breakdown provides context when comparing the performance of the two indexes. The chart highlights the venture index’s significant relative overweight in healthcare and substantial underweights in consumer discretionary and communication services.
Collectively, the four meaningfully sized sectors made up 84% of the index (Figure 7). Performance among the four ranged from 23.3% for healthcare to 43.4% for communication services (which includes many tech-enabled businesses). The IT sector came in a close second with a six-month return of 41.9% followed by consumer discretionary (29.6%), which also benefited from tech-enabled companies. Together, the two next- largest sectors, industrials and financials, accounted for about 9% of the index’s value; financials was the best-performing sector across the index. The communication services return was driven mostly by three vintages, 2014, 2016, and 2018, with the latter two posting IRRs in the 70% range. IT company performance was strong across the vintages, with 2012 and 2016 leading the pack. In the healthcare sector, the largest vintage by market value (2016) was also among its best performing, earning about 47% on its investments in the sector.

In line with long-term norms, during the first six months, venture capital managers in the index allocated slightly more than 70% of their invested capital to IT and healthcare investments (in rank order). Other sectors, including communication services, consumer discretionary, and financials, all attracted at least 5% of the capital invested during the period. ■
Figure Notes
US Private Equity and Venture Capital Index Returns
Private indexes are pooled horizon internal rates of return, net of fees, expenses, and carried interest. Returns are annualized, with the exception of returns less than one year, which are cumulative. Because the US private equity and venture capital indexes are capitalization weighted, the largest vintage years mainly drive the indexes’ performance.
Public index returns are shown as both time-weighted returns (average annual compound returns) and dollar-weighted returns (mPME). The CA Modified Public Market Equivalent replicates private investment performance under public market conditions. The public index’s shares are purchased and sold according to the private fund cash flow schedule, with distributions calculated in the same proportion as the private fund, and mPME net asset value is a function of mPME cash flows and public index returns.
Vintage Year Returns
Vintage year fund-level returns are net of fees, expenses, and carried interest.
Sector Returns
Industry-specific gross company-level returns are before fees, expenses, and carried interest.
GICS® Sector Comparisons
The Global Industry Classification Standard (GICS®) was developed by and is the exclusive property and a service mark of MSCI Inc. and S&P Global Market Intelligence LLC and is licensed for use by Cambridge Associates LLC. The Nasdaq Composite exposures are as of June 30, 2021, and represent the index’s sector breakdown prior to the GICS® reclassification that went into effect after close of business (ET) September 28, 2018. Cambridge Associates LLC will implement the GICS® reclassification for private companies with the release of September 30, 2018, benchmark data. “Other” includes sectors that make up less than 3% of the CA benchmark.
About the Cambridge Associates LLC Indexes
Cambridge Associates derives its US private equity benchmark from the financial information contained in its proprietary database of private equity funds. As of June 30, 2021, the database included 1,297 US buyouts and growth equity funds formed from 1986 to 2021, with a value of $1.2 trillion. Ten years ago, as of June 30, 2011, the index included 770 funds whose value was $459 billion.
Cambridge Associates derives its US venture capital benchmark from the financial information contained in its proprietary database of venture capital funds. As of June 30, 2021, the database comprised 2,077 US venture capital funds formed from 1981 to 2021, with a value of $499 billion. Ten years ago, as of June 30, 2011, the index included 1,343 funds whose value was $122 billion.
The pooled returns represent the net end-to-end rates of return calculated on the aggregate of all cash flows and market values as reported to Cambridge Associates by the funds’ general partners in their quarterly and annual audited financial reports. These returns are net of management fees, expenses, and performance fees that take the form of a carried interest.
About the Public Indexes
The Nasdaq Composite Index is a broad-based index that measures all securities (more than 3,000) listed on the Nasdaq Stock Market. The Nasdaq Composite is calculated under a market capitalization–
weighted methodology. The Russell 2000® Index includes the smallest 2,000 companies of the Russell 3000® Index (which is composed of the largest 3,000 companies by market capitalization).The Standard & Poor’s 500 Composite Stock Price Index is a capitalization-weighted index of 500 stocks intended to be a representative sample of leading companies in leading industries within the US economy. Stocks in the index are chosen for market size, liquidity, and industry group representation.
About Cambridge Associates
Cambridge Associates is a global investment firm with 50+ years of institutional investing experience. The firm aims to help pension plans, endowments & foundations, healthcare systems, and private clients achieve their investment goals and maximize their impact on the world. Cambridge Associates delivers a range of services, including outsourced CIO, non-discretionary portfolio management, staff extension and alternative asset class mandates. Contact us today.