The 15 Percent Frontier


Why do some institutions dramatically outperform their peers over long periods of time? The gap between very top performers and the rest of the universe has felt particularly wide recently. While investors have generally been disappointed by recent returns—the median return of the Cambridge Associates Endowment and Foundation universe 1 was only 1.3% for the fiscal year ended June 30, 2015, and more than a quarter of the institutions had negative returns—a sizable group of institutions fared considerably better than their peers.
We can identify a major driver of this better performance—both recently and over the long term—if we segment our endowment and foundation universe by asset allocation, in particular the institutions’ allocation to private investments 2 (Figure 1). The median return of institutions with 15% or more of their assets in private investments was 3.6% for the 2015 fiscal year, and virtually all of these institutions had positive returns. Further, this group of institutions is no longer limited to a handful of very large universities and foundations. For the 2015 fiscal year, almost 40% of our universe—174 institutions—reaped the benefits of having more than 15% in private investments, suggesting that the opportunity to enhance performance with private investments is more widely available than is often assumed. 3
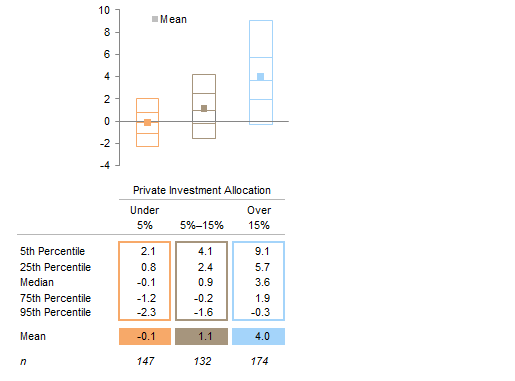
Figure 1. Range of Fiscal Year 2015 Returns by Private Investment Allocation
As of June 30, 2015 • Percent (%)
Source: Endowment and foundation data as reported to Cambridge Associates LLC.
Note: Each institution’s private investment allocation is as of 6/30/15.
We think that all investors concerned with earning a return on their portfolios that will support their spending needs should look closely at the results and investment policies of this group and consider crossing the “15% frontier” in their own portfolios.
We would not advocate this solution based solely on recent results; chasing short-term performance is the worst thing investors can do if they hope to be a top performer in the future. Our view is based on the persistent positive impact of private investments over a very long-term horizon. The extensive client performance data amassed by Cambridge Associates since the 1970s allows us to conclude with confidence that higher allocations to private investments resulted in higher returns over the long term, once a program was fully implemented, and achieved this benefit with remarkable consistency year after year.
Performance results over the past ten years make a strong case for higher allocations to private investments. Figure 2 plots 242 institutions’ trailing ten-year returns through June 30, 2015, against their average allocation to private investments over the same period. The strong positive relationship between the allocation to private investments and portfolio return is evident in the scatterplot: most of the institutions with performance in the top quartile had above-median allocations to private investments for the ten-year period, while most of the bottom-quartile performers had below-median allocations. As was true for fiscal year 2015, the outperformance of the group with private investment allocations above 15% was significant: the median annualized return of these institutions was 7.6%, 150 basis points (bps) higher than the return of the group with less than 5% in private investments. Compounded over a ten-year period, this differential can have a meaningful impact on the financial health of an institution.
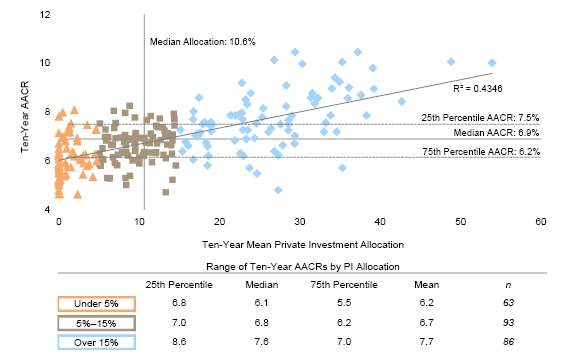
Figure 2. Private Investment Allocation Versus Investment Return: Trailing Ten Years
As of June 30, 2015 • Percent (%)
Source: Endowment and foundation data as reported to Cambridge Associates LLC.
Notes: Analysis includes 242 endowments and foundations that provided returns and asset allocation for each June 30 from 2005 to 2015. Subgroups are based on each institution’s ten-year average allocation to private investments. Axis lines are drawn where the median private investment allocation for the entire universe intersects with the median return for the entire universe. Dotted lines are drawn at the 25th percentile and 75th percentile of ten-year returns for the entire universe.
The source of the performance advantage for institutions with high allocations to private investments is easy to identify from a look at comparative asset class returns. Over the ten years in question (Figure 3), venture capital, private equity, and distressed securities (private equity structure) were the three best-performing asset classes, with annualized returns (on a pooled dollar-weighted basis) of 12.5%, 11.9%, and 10.8%, respectively, each outperforming the equity and bond markets measured on an equivalent basis. 4
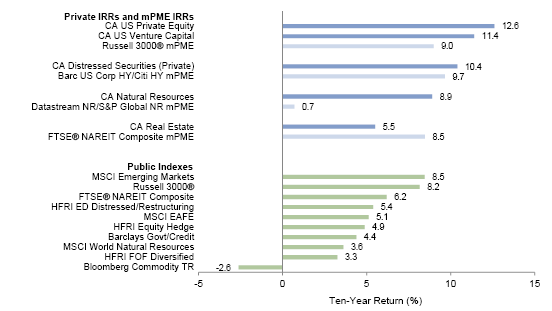
Figure 3. Asset Class Performance: Trailing Ten Years
As of June 30, 2015
Sources: Barclays, Bloomberg L.P., Cambridge Associates LLC, Citigroup Global Markets, Frank Russell Company, FTSE International Limited, Hedge Fund Research, Inc., MSCI Inc., the National Association of Real Estate Investment Trusts, Standard & Poor’s, and Thomson Reuters Datastream. MSCI data provided “as is” without any express or implied warranties.
Notes: Private indexes are pooled horizon IRRs, net of fees, expenses, and carried interest. Public indexes are AACRs (time-weighted returns). CA Modified Public Market Equivalent (mPME) replicates private investment performance under public market conditions. The public index’s shares are purchased and sold according to the private fund cash flow schedule, with distributions calculated in the same proportion as the private fund, and mPME NAV is a function of mPME cash flows and public index returns. The Russell 3000® mPME IRR is calculated against CA US Private Equity and Venture Capital combined.
Another way of seeing the benefits of private investments over the past ten years is to divide our endowment universe into quartiles by performance, as shown in Figure 4. The best-performing portfolios over this period were heavily weighted in private investments, while the worst-performing portfolios were not. The average allocation to privates in the top-performing quartile of institutions was 24.1%; the allocation in the bottom quartile was only 6.0%—a gap of more than 18 percentage points. 5 In place of private investments, the bottom quartile was more heavily weighted in US equities (26.6% vs 18.0% for the top performers) and fixed income (19.2% vs 10.1% for the top performers). Given the superior performance of private investments compared with liquid asset classes in this ten-year period, it is not surprising that the higher allocations to private investments resulted in top-quartile performance.
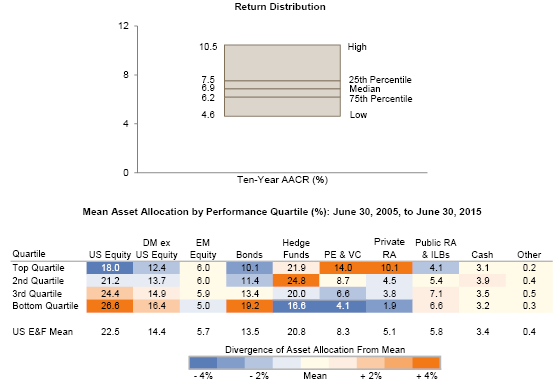
Figure 4. Trailing Ten-Year Asset Allocation of Top and Bottom Performers
As of June 30, 2015
Source: Endowment and foundation data as reported to Cambridge Associates LLC.
Notes: Performance quartiles are based on the trailing ten-year return as of June 30, 2015. Mean allocations are for the eleven June 30 periods from 2005 and 2015. Analysis includes data for 242 institutions.
The benefits of private investments are not just a function of superior returns over the most recent decade or even the most recent five years. Institutions that had private investment allocations above 15% over the trailing 15- and 20-year periods tended to outperform as well (Figure 5). The outperformance by the investors with high private allocations is persistent and remarkably consistent. Over the full 20-year period, the median return for institutions with more than 15% allocated to privates outperformed the median for the group with less than 5% in privates by a cumulative margin of 182 percentage points, or 180 bps per year.
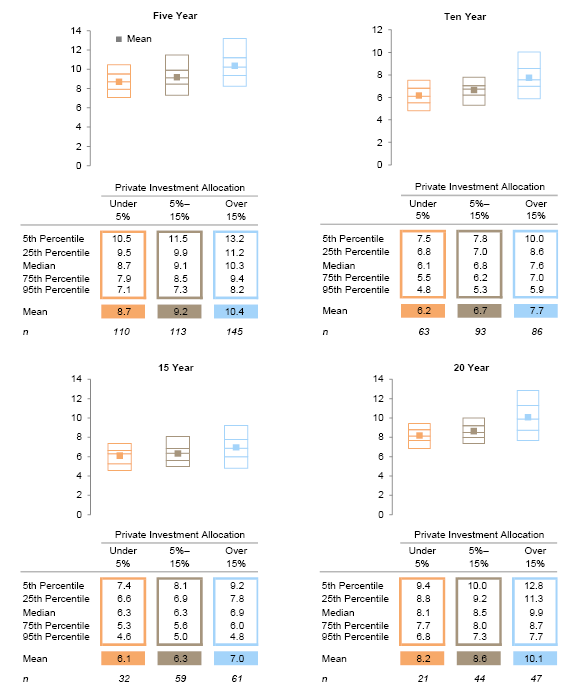
Figure 5. Range of Returns by Private Investment Allocation
Average Annual Compound Returns (AACR) for Periods Ending June 30, 2015 • Percent (%)
Source: Endowment and foundation data as reported to Cambridge Associates LLC.
Note: Subgroups are based on each institutions’ mean allocation to private investments over the given time period.
The consistency of the outperformance is especially impressive (Figure 6). While private investments are considered to be riskier than marketable securities, there have been very few periods when the institutions with high private allocations underperformed those with low allocations, and when they did so, it was not by a wide margin. The median return for the group with low private allocations outperformed the median return for the group with high private allocations in only six of the 20 years since 1996, and the outperformance was concentrated in two periods of three fiscal years each: 2001–03 and 2009–11. Both of these periods saw severe market corrections, followed in the more recent period by a dramatic recovery in equities. And in both periods, the group with high private allocations underperformed by a significant margin in the first year (320 bps in fiscal 2001 and 160 bps in fiscal 2009), followed by two years of more modest shortfalls—less than 100 bps. And in both cases the shortfall was quickly recovered in subsequent years of strong private outperformance. Underlying this pattern is the consistency of the outperformance of private vs public equity. As shown in Figure 7, private investments (venture capital and private equity combined) outperformed the Russell 3000® Index (mPME) in 12 of the 20 years, and underperformance in the other eight years was relatively modest compared with the sizable margin of outperformance in the other years.
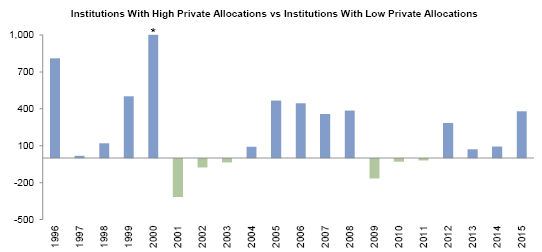
Figure 6. Median Return Comparison by Private Investment Allocation
Fiscal Years 1996–2015 • Return Spread (basis points)
Sources: Endowment and foundation data as reported to Cambridge Associates LLC.
Notes: Institutions with private investment allocations above 15% in a given year were in the high-allocation group, while instituitons with private investment allocations below 5% were in the low-allocation group. Fiscal years end June 30.
* Scale capped at 1,000 for graphing purposes. The fiscal year 2000 value is 3,039 bps.
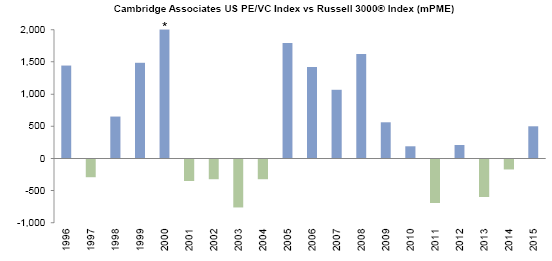
Figure 7. Private Market Performance Relative to the Public Market
Fiscal Years 1996–2015 • Return Spread (basis points)
Sources: Cambridge Associates LLC and Standard & Poor’s.
Notes: CA Modified Public Market Equivalent (mPME) replicates private investment performance under public market conditions. The public index’s shares are purchased and sold according to the private fund cash flow schedule, with distributions calculated in the same proportion as the private fund, and mPME NAV is a function of mPME cash flows and public index returns. Fiscal years end June 30.
* Scale capped at 2,000 for graphing purposes. The fiscal year 2000 value is 8,789 bps.
Of course, the higher allocation to private equity may not be the only factor in the outperformance of the institutions we have highlighted. Other characteristics of this group may have also contributed to their higher returns. These institutions likely have a longer-term investment horizon than others in their peer group, which could have many beneficial effects, including a lower propensity to make poorly timed tactical allocations. Also, institutions that are committed to private investing often have more staff resources than those that do not, which would enhance their ability to source and select good managers across the entire portfolio. All of these factors are worth exploring further. But the evidence strongly supports the view that an allocation of 15% or more of a portfolio to private leads to higher returns and should be taken seriously by all investors.
Given the compelling evidence of the benefits of higher allocations to private investments, why do more institutions not have private allocations of 15% or more? Over the past decade, the number of institutions with allocations at this level has increased—as of June 30, 2015, 38% of our endowment universe had private investment allocations at this level—but the majority of institutions are still well below 15%. The median allocation of the Cambridge Associates endowment universe as of June 30, 2015, was 10.7%. What has kept institutions from adding private investments at a level that would add significantly to their returns? When exploring this question with clients, we hear three principal objections:
- The illiquidity of private investments is a risk that institutions can’t tolerate.
- Private investments can only be done successfully by very large institutions with enough scale and the resources needed to build a diversified program.
- Very few investors can access the very limited group of top-tier funds that are essential to a successful investment program and that are generally closed to new investors.
These issues are valid and need to be addressed before expanding a private investment allocation, but they should not be overstated; for most institutions, these considerations don’t preclude a private investment allocation of 15% or more.
For a discussion of measuring and managing liquidity requirements, please see Mary Cove, “A Holistic Approach to Liquidity Management,” Cambridge Associates Research Report, 2016.
We believe illiquidity is the most important of these issues to address. There is no question that every institution needs to be certain that the liquidity in its portfolio is adequate for its likely cash flow needs under different scenarios. But many investors place a value on liquidity that exceeds their actual cash needs, even under worst-case scenarios. Since the illiquidity premium in investments is significant and persistent over time, an institution should carefully determine how much illiquidity it can tolerate in its endowment fund by looking at its spending policy, cash needs for operations under different scenarios, debt service requirements, cash sources outside the long-term pool, and the availability of credit facilities. The conclusion from such an analysis will provide reassurance to many institutions that a higher private investment allocation is well within their tolerance for illiquidity.
The belief that only very large institutions can be successful in private investments is understandable, given that these institutions are the most visible and highly publicized participants in the private investment arena. And it is correct to assume that the group of institutions with more than 15% in privates generally consists of institutions with larger portfolios than the rest of the endowment and foundation universe. The median asset size of the group with more than 15% in privates was $1.2 billion as of June 30, 2015, compared with a median of $105 million for the group with less than 5% in privates. Nevertheless, the group with the high private allocation is not exclusively composed of very large institutions. Of the 174 institutions in this group, 48 of them—more than a quarter of the total—had assets below $500 million, including 26 institutions with assets below $250 million. It is true that institutions in this size range are precluded from investing in some funds with high minimum commitment sizes, and they are unlikely to be able to support an internal staff to build and implement the program. But a sizable number of them have concluded that the benefits of private investments justify the efforts required to build a program, relying on assistance from external consulting or advisory firms like Cambridge Associates.
Finally, the belief that success in private investing requires access to a very small group of tightly closed top-tier firms that consistently generate the best returns is based on a somewhat narrow view of the private investment industry. As the industry has grown and developed, some established firms have successfully completed generational transitions and remain strong performers. At the same time, capable newer private equity and venture capital funds frequently appear at the top of the lists of vintage year returns (Figures 8 and 9), outperforming established firms, and a number of these go on to develop enduring franchises themselves. While it is indisputable that good manager selection is critical to achieving the objectives of a private investment program, the manager universe offers a wide array of managers that are open to new investors and that can generate top-tier returns.
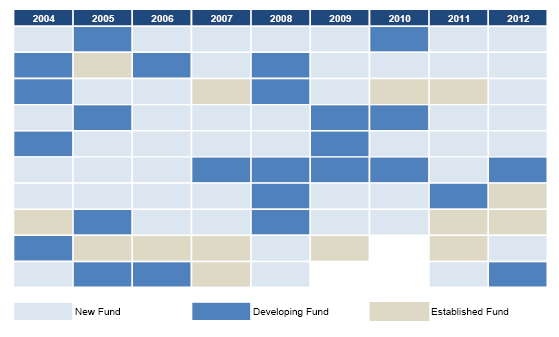
Figure 8. Top Ten Top Quartile US Private Equity Funds by Vintage Year
As of September 30, 2015 • Based on Net TVPI Multiple
Source: Cambridge Associates LLC Private Investments Database.
Notes: Pooled total value to paid-in capital multiple is net of fees, expenses, and carried interest. Fund order is determined as funds raised under the same strategy and does not include friends and family funds. New fund is defined as the first or second fund, developing fund is the third or fourth fund, and established fund is the fifth fund and beyond. Vintage years formed since 2012 are too young to have produced meaningful returns. On average in the vintage years examined, established funds represent 25% of the universe, and new and developing funds 75%. In years with fewer than 40 total funds, the top quartile is made up of fewer than ten funds.
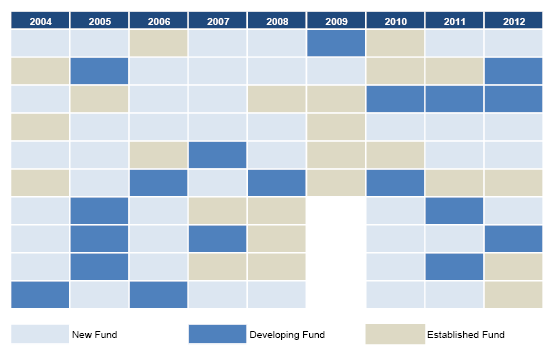
Figure 9. Top Ten Top Quartile US Venture Capital Funds by Vintage Year
As of September 30, 2015 • Based on Net TVPI Multiple
Source: Cambridge Associates LLC Private Investments Database.
Notes: Pooled total value to paid-in capital multiple is net of fees, expenses, and carried interest. Fund order is determined as funds raised under the same strategy and does not include friends and family funds. New fund is defined as the first or second fund, developing fund is the third or fourth fund, and established fund is the fifth fund and beyond. Vintage years formed since 2012 are too young to have produced meaningful returns. On average in the vintage years examined, established funds represent 30% of the universe and new and developing funds 70%. In years with fewer than 40 total funds, the top quartile is made up of fewer than ten funds.
Looking at the historical record, the case for higher allocations to private investments is compelling, and while the future does not always replicate the past, we see no reason to believe that the factors that produced the superior returns in the past ten and 20 years will not persist into the future. We would encourage all investors to carefully measure their liquidity tolerance and consider whether a move toward and beyond the 15% frontier makes sense given the superior returns that have come with a higher allocation to private investments.
Index Disclosures
The Cambridge Associates Endowment and Foundation universe includes colleges and universities, cultural and environmental institutions, foundations, healthcare institutions, independent schools, and other endowment nonprofit institutions. The mean and median long-term investment portfolio market values for the 453 institutions in this universe as of June 30, 2015, were $1.5 billion and $272.6 million, respectively. For time periods greater than one year in this report, only institutions that provided data for all years in the given period are included. Data are presented as of June 30, 2015, as this is the most robust period for analysis given that the largest number of institutions report to our database for the June 30 period. Advisory clients of Cambridge Associates compose a significant portion of the universe, but the universe includes institutions for which Cambridge provides discretionary and nondiscretionary investment advice with respect to entire portfolios and discreet subdivisions of portfolios, as well as institutions for which Cambridge Associates provides performance analytics and other administrative services. The performance of the universe and its constituents is intended to illustrate the potential benefits of an allocation to private investments, and is not intended to represent, and is not representative of, any investment strategy offered by Cambridge Associates.
Cambridge Associates does not provide stock selection recommendations, and any reference to specific companies is not to be interpreted as a recommendation of that company as an investment option.
Cambridge Associates Indexes
Cambridge Associates derives its US private equity benchmark from the financial information contained in its proprietary database of private equity funds. As of March 31, 2015, the database comprised 1,206 US buyouts, private equity energy, growth equity, and mezzanine funds formed from 1986 to 2014, with a value of nearly $564 billion. Ten years ago, as of March, 31, 2005, the index included 587 funds whose value was roughly $161 billion.
Cambridge Associates derives its US venture capital benchmark from the financial information contained in its proprietary database of venture capital funds. As of March 31, 2015, the database comprised 1,576 US venture capital funds formed from 1981 to 2015, with a value of roughly $158 billion. Ten years ago, as of March 31, 2005, the index included 1,053 funds whose value was about $52 billion.
The pooled returns represent the net end-to-end rates of return calculated on the aggregate of all cash flows and market values as reported to Cambridge Associates by the funds’ general partners in their quarterly and annual audited financial reports. These returns are net of management fees, expenses, and performance fees that take the form of a carried interest.
Both the Cambridge Associates LLC US Venture Capital Index® and the Cambridge Associates LLC US Private Equity Index® are reported each week in Barron’s Market Laboratory section. In addition, complete historical data can be found on Standard & Poor’s Micropal products and on our website,
www.cambridgeassociates.com.
The CA Distressed Securities (Private) Index is a horizon calculation based on data compiled from 291 distressed securities funds, including fully liquidated partnerships, formed between 1987 and 2015.
The CA Natural Resources Index is a horizon calculation based on data compiled from 361 natural resources funds, (including 79 Energy Upstream & Royalties, 171 US Private Equity Energy, 67 Ex-US Private Equity Energy, and 44 Timber funds), including fully liquidated partnerships, formed between 1986 and 2015.
The Cambridge Associates Real Estate Index is a horizon calculation based on data compiled from 847 real estate funds, (including opportunistic and value-added real estate funds) including fully liquidated partnerships, formed between 1986 and 2015.
Barclays Government/Credit Intermediate Bond Index
The Barclays Government/Credit Intermediate Bond Index is the intermediate component of the US Government/Credit Index. It consists of securities in the intermediate-maturity range of the Government/Credit Index. Securities must have a maturity from one to (but not including) ten years. The Government/Credit Index includes Treasuries (i.e., public obligations of the US Treasury that have remaining maturities of more than one year), government-related issues (i.e., agency, sovereign, supranational, and local authority debt), and USD corporates.
Barclays US Corporate High Yield Index
The Barclays US Corporate High Yield Index measures the US corporate market of non-investment grade, fixed-rate corporate bonds. Securities are classified as high yield if the middle rating of Moody’s, Fitch, and S&P is Ba1/BB+/BB+ or below.
Bloomberg Commodity Total Return Index
The Bloomberg Commodity Total Return Index is composed of futures contracts and reflects the returns on a fully collateralized investment in the BCOM. This combines the returns of the BCOM with the returns on cash collateral invested in 13 week (three-month) US Treasury Bills.
The Citigroup US High-Yield Market Index
The Citigroup US High-Yield Market Index is a US Dollar–denominated index that measures the performance of high-yield debt issued by corporations domiciled in the United States or Canada. Recognized as a broad measure of the North American high-yield market, the index includes cash-pay, deferred-interest securities, and debt issued under Rule 144A in unregistered form.
FTSE NAREIT US Real Estate Index Series
The FTSE NAREIT US Real Estate Index Series is a comprehensive family of REIT-focused indexes that span the commercial real estate industry, providing market participants with a range of tools to benchmark and analyse exposure to real estate across the US economy at both a broad industry-wide level and on a sector-by-sector basis. Indexes within the series are suitable for benchmarking purposes and as tools in the creation of a wide variety of financial products, such as index-linked funds, exchange-traded funds (ETFs), and derivatives contracts.
HFRI ED: Distressed/Restructuring Index
The HFRI ED: Distressed/Restructuring Index includes investment managers that maintain positions both long and short in primarily equity and equity derivative securities. A wide variety of investment processes can be employed to arrive at an investment decision, including both quantitative and fundamental techniques; strategies can be broadly diversified or narrowly focused on specific sectors and can range broadly in terms of levels of net exposure, leverage employed, holding period, concentrations of market capitalizations and valuation ranges of typical portfolios. Equity hedge managers would typically maintain at least 50% exposure to, and may in some cases be entirely invested in, equities, both long and short.
HFRI Equity Hedge Index
The HFRI Equity Hedge Index includes distressed/restructuring strategies that employ an investment process focused on corporate fixed income instruments, primarily on corporate credit instruments of companies trading at significant discounts to their value at issuance or obliged (par value) at maturity as a result of either formal bankruptcy proceeding or financial market perception of near term proceedings. Managers are typically actively involved with the management of these companies, frequently involved on creditors’ committees in negotiating the exchange of securities for alternative obligations, either swaps of debt, equity, or hybrid securities. Managers employ fundamental credit processes focused on valuation and asset coverage of securities of distressed firms; in most cases portfolio exposures are concentrated in instruments that are publicly traded, in some cases actively and in others under reduced liquidity, but in general for which a reasonable public market exists. In contrast to special situations, distressed strategies employ primarily debt (greater than 60%) but also may maintain related equity exposure.
HFRI Fund-of-Fund Diversified Index
The HFRI Fund-of-Funds Diversified Index is a non-investable product of diversified fund of funds. The Index is equal weighted (fund weighted) with an inception of January 1990.
MSCI EAFE Index
The MSCI EAFE Index is a free float–adjusted, market capitalization–weighted index designed to measure the equity market performance of developed equity. As of January 2012 the index consisted of the following 22 developed country indexes: Australia, Austria, Belgium, Denmark, Finland, France, Germany, Greece, Hong Kong, Ireland, Israel, Italy, Japan, Netherlands, New Zealand, Norway, Portugal, Singapore, Spain, Sweden, Switzerland, and the United Kingdom.
MSCI Emerging Markets Index
The MSCI Emerging Markets Index represents a free float–adjusted market capitalization index that is designed to measure equity market performance of emerging markets. As of February 2013, the MSCI Emerging Markets Index includes 23 emerging markets country indexes: Argentina, Brazil, Chile, China, Colombia, Czech Republic, Egypt, Hungary, India, Indonesia, Israel, Korea, Malaysia, Mexico, Morocco, Peru, Philippines, Poland, Russia, South Africa, Taiwan, Thailand, and Turkey.
MSCI World Natural Resources Index
The MSCI World Natural Resources Index is based on the MSCI ACWI, its parent index, and includes energy sector stocks plus metals & mining, paper & forest products sub-industries. The MSCI data are composed of a custom index calculated by MSCI.
Russell 3000® Index
The Russell 3000® Index measures the performance of the largest 3,000 US companies representing approximately 98% of the investable US equity market. The Russell 3000® Index is constructed to provide a comprehensive, unbiased, and stable barometer of the broad market and is completely reconstituted annually to ensure new and growing equities are reflected.
S&P Global Natural Resources Index
The S&P Global Natural Resources Index includes 90 of the largest publicly traded companies in natural resources and commodities businesses that meet specific investability requirements, offering investors diversified and investable equity exposure across three primary commodity-related sectors: agribusiness, energy, and metals & mining.
Thomson Reuters Datastream World-Datastream Mining Index
The Datastream World DS Mining Index (MNINGWD) is part of Thomson Reuters Datastream Global Equity Indexes dataset. It is composed of any equities within the Datastream World Index that is classified within the oil & gas industry based on the Industry Classification Benchmark (ICB) classification system. As of December 2015, the Datastream World Index is composed of 66 countries (26 developed and 40 emerging markets) worldwide. For each market, a representative sample of stocks covering a minimum 75%–80% of total market capitalization enables market indexes to be calculated. By aggregating market indexes for regional groupings, regional and world indexes are produced. Within each market, stocks are allocated to industrial sectors using the ICB jointly created by FTSE and Dow Jones. Sector indexes are then calculated.
Thomson Reuters Datastream World-Datastream Oil & Gas Index
The Datastream World DS OIL & Gas Index (OILGSWD) is part of Thomson Reuters Datastream Global Equity Indexes dataset. It is composed of any equities within the Datastream World Index that is classified within the oil & gas industry based on the Industry Classification Benchmark (ICB) classification system. As of December 2015, the Datastream World Index is composed of 66 countries (26 developed and 40 emerging markets) worldwide. For each market, a representative sample of stocks covering a minimum 75%–80% of total market capitalization enables market indexes to be calculated. By aggregating market indexes for regional groupings, regional and world indexes are produced. Within each market, stocks are allocated to industrial sectors using the ICB jointly created by FTSE and Dow Jones. Sector indexes are then calculated.
Footnotes
- The performance of the universe is not intended to represent, and is not representative of, any investment strategy offered by Cambridge Associates. Past performance is not indicative of future returns. The Cambridge Associates Endowment and Foundation universe includes colleges and universities, cultural and environmental institutions, foundations, health-care institutions, independent schools, and other endowment nonprofit institutions. The mean and median long-term investment portfolio market values for the 453 institutions in this universe as of June 30, 2015, were $1.5 billion and $272.6 million, respectively. For time periods greater than one year in this report, only institutions that provided data for all years in the given period are included. Additional information regarding the universe is set forth at the end of this paper.
- Private investments include non-venture private equity, venture capital, distressed securities (private equity structure), private real estate, private oil & gas/natural resources, timber, and other private investments.
- Of the institutions in the universe with an allocation to private investments, approximately 83% used a current basis where the total portfolio return incorporates private investment valuations for the entire period of a given fiscal year. Another 17% reported private investment returns on a lagged basis, whereby private investment valuations perpetually lagged other assets in the portfolio by one quarter. While the use of lagged private valuations can result in a different total portfolio return than that calculated using current valuations, the differential is generally negligible for long-term periods and does not significantly impact the overall conclusions of this paper.
- Public market returns are evaluated on a modified public market equivalent (mPME) basis. Cambridge Associates mPME methodology replicates private investment performance under public market conditions and allows for an appropriate comparison of private and public market returns. The mPME analysis evaluates what return would have been earned had the dollars invested in private investments been invested in the public market index instead.
- Figure 4 breaks the endowment and foundation universe down into four quartiles based on the trailing ten-year investment return. Each institution’s asset allocation was averaged across all of the June 30 periods that fell from 2005 to 2015. The four quartiles in the heat map table represent the average of the institutions within each quartile.
David Thurston - David Thurston is a Managing Director at Cambridge Associates.
About Cambridge Associates
Cambridge Associates is a global investment firm with 50+ years of institutional investing experience. The firm aims to help pension plans, endowments & foundations, healthcare systems, and private clients achieve their investment goals and maximize their impact on the world. Cambridge Associates delivers a range of services, including outsourced CIO, non-discretionary portfolio management, staff extension and alternative asset class mandates. Contact us today.