Growth Equity: Turns Out, It’s All About the Growth


Growth equity, we believe, is an attractive strategy for investors and an important component in a private investments program. As a refresher, in our 2013 US Market Commentary, “Growth Equity Is All Grown Up,” we defined a “classic” growth equity investment as having most, if not all, of the following characteristics:
- Founder-owned
- No prior institutional capital
- No, or limited, leverage
- Proven business model (established product and/or technology, and existing customers)
- Substantial organic revenue growth (usually in excess of 10%; often more than 20%)
- EBITDA 1 positive, or expected to be so within 12–18 months.
The strategy’s resulting exposure to lightly levered growing companies in expanding areas of an economy could prove quite resilient during downturns, one of which may not be far away given the maturity of the current economic expansion. Indeed, our operating metrics data revealed growth equity portfolio companies grew revenue and EBITDA even during the 2007–09 global financial crisis (GFC). Further, growth equity offers investors an investment profile distinct from its venture and buyout brethren: upside return potential more akin to venture but with the lower losses of buyouts. Investors should take notice and consider growth equity investments as an attractive complement to existing private investment holdings.
This paper’s analysis of manager-provided operating metrics data confirms the fundamental characteristics of growth equity investments remain unchanged from what we described in our earlier research. But the space continues to mature and competition is intensifying; for evidence, look no further than rapidly increasing entry prices. That said, our data show limited correlation between entry pricing and investment outcomes. A better predictor of returns is a manager’s ability to sustain or accelerate revenue growth after investment. That’s not easy, and can only come after finding the best companies and convincing them to take one’s capital, two important prerequisites for a successful growth equity strategy. We expect post-investment capabilities will be an increasingly important dimension in which managers will need to differentiate themselves.
Growth Equity Lives Up to Its Name
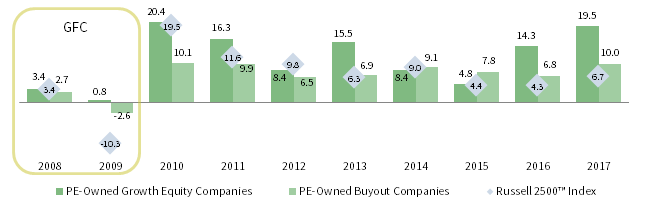
Exposure to rapidly growing companies is an attractive element of growth equity, and Cambridge Associates’ operating metrics data support that premise. In our prior research, we defined growth equity companies as having annual revenue growth in excess of 10% and often more than 20%. Based on our data from 2008 through 2017, 2 growth equity companies generated an average annual revenue growth rate of 17.2%, more than double the growth rate of buyout companies and more than triple that of public companies. Although many growth equity managers seek even higher growth, it turns out that 20% revenue growth is distinctive (Figure 1).
FIGURE 1 AVERAGE ANNUAL REVENUE GROWTH RATE
As of December 31, 2017 • Percent (%)

Sources: Cambridge Associates LLC Private Investments Database (as reported by investment managers), FactSet Research Systems, and Frank Russell Company.
Notes: Outliers were identified and excluded, and the same methodology was applied to the private equity and public company universes. Private equity–owned companies were identified by the manager’s strategy. Analysis includes 1,383 buyout and 600 growth equity deals from 2008–17.
In fairness, this growth is often off of a smaller base; in each year from 2008 to 2017, the median trailing 12-month (LTM) revenue level at entry for growth equity investments was roughly 15%–42% the size of the buyout companies in our operating metrics database. Nonetheless, the stronger growth is still significant and, notably, growth equity companies also averaged positive revenue growth in 2009 during the GFC, in contrast with declining revenues for buyouts and public companies.
EBITDA Growth Is More Muted
Similar to their revenue trajectory, growth equity companies exhibited stronger EBITDA increases than their buyout counterparts (Figure 2). However, growth equity’s advantage is less pronounced with respect to EBITDA growth, due to growth equity–backed companies’ tendency to invest for revenue growth. Like venture capital–backed companies, many growth equity–stage companies invest heavily in growth, with a key difference: growth equity companies often self-fund, or bootstrap, that growth prior to receiving institutional capital. Running significant operating losses for extended periods of time is often not an option for a growth equity company due to the lack of outside capital; they tend to focus on getting to profitability (or near profitability) as quickly as possible. Many growth equity companies have positive EBITDA but are often running close to breakeven when they take on an investment from a growth equity investor.
FIGURE 2 AVERAGE ANNUAL EBITDA GROWTH RATE
As of December 31, 2017 • Percent (%)
Sources: Cambridge Associates LLC Private Investments Database (as reported by investment managers), FactSet Research Systems, and Frank Russell Company.
Notes: Outliers were identified and excluded, and the same methodology was applied to the private equity and public company universes. Private equity–owned companies were identified by the manager’s strategy. Analysis includes 1,321 buyout and 395 growth equity deals from 2008–17.
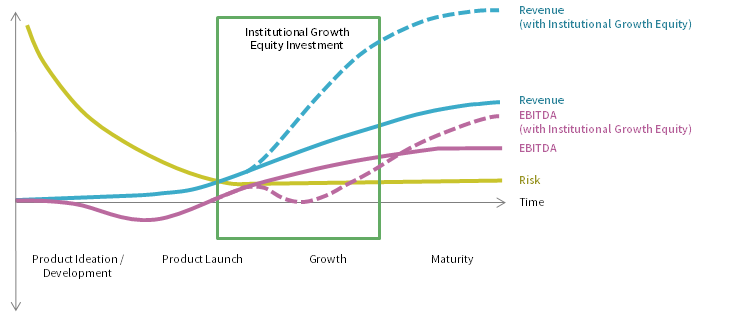
After investment, institutionally backed growth equity companies often add resources, infrastructure, and systems to support the business ahead of expected top-line growth. Doing so can result in depressed EBITDA margins in the first one to two years of investment. This EBITDA “j-curve” (or perhaps a “g-curve,” given these losses are incurred in pursuit of growth) is not unusual, but investors should closely monitor portfolio company operating metrics for evidence that the business is beginning to reap the benefits of that additional investment and is scaling accordingly. This approach contrasts with institutionally backed leveraged buyout companies, where cost-cutting and operational efficiencies identified in due diligence are pursued soon after an investment is made, typically resulting in an EBITDA uplift (Figure 3).
FIGURE 3 GROWTH EQUITY PORTFOLIO COMPANY LIFECYCLE
Illustration
Source: Cambridge Associates LLC.
Growing Companies Yield Better Results
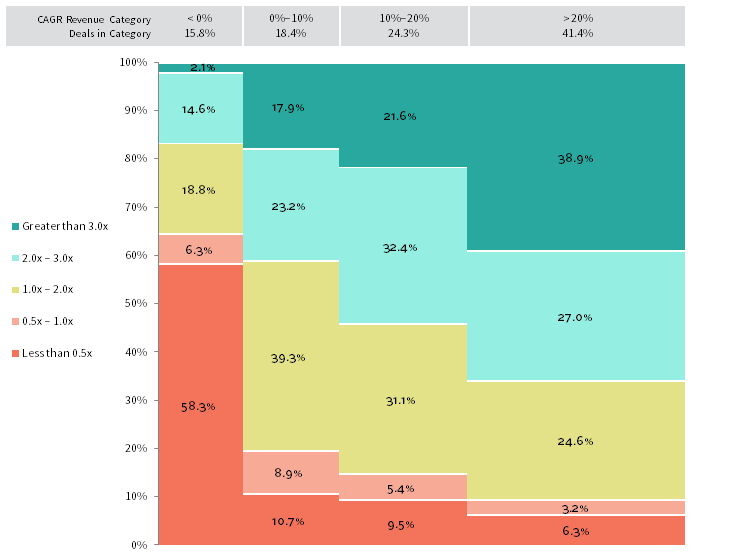
Achieving meaningful investment success in a growth equity investment requires growth to continue and, preferably, accelerate over the life of the investment. It’s not a stretch to assume that the more a company can deliver sustained revenue and/or EBITDA growth, the more likely there will be a positive investment outcome (provided the entry price is right, which we discuss later). An examination of realized multiples of invested capital (MOIC) grouped by revenue growth rates supports that hypothesis. Approximately two-thirds of high-growth, realized growth equity companies (i.e., those with greater than 20% annual revenue growth) achieved a gross MOIC of 2.0x or better at exit; just over 40% of all investments analyzed were in the 20%-plus revenue growth category. In contrast, nearly two-thirds of non-growth companies were realized at less than cost. Approximately 15% of realized growth equity companies fell into this category (Figure 4).
FIGURE 4 US GROWTH EQUITY: REALIZED MOIC BY REVENUE GROWTH
As of December 31, 2017
Sources: Cambridge Associates LLC Private Investments Database (as reported by investment managers).
Notes: The chart shows the percentage of deals generating different realized multiples of invested capital (MOIC) within a revenue CAGR category. The universe includes 304 fully realized US growth equity deals, not excluding outliers, which were exited between 2002 and 2017. CAGR is calculated from date of investment to date of exit.
But Growth Does Not Come Cheap
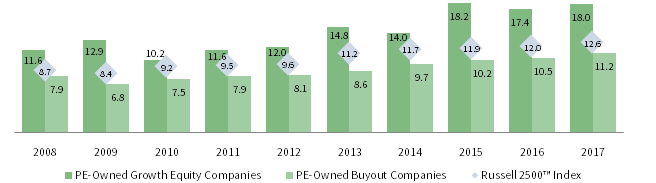
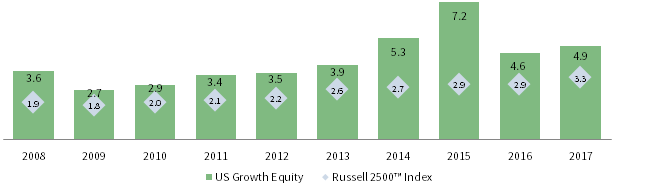
Headline returns look compelling, but entry valuations have risen markedly in recent years. As shown in Figure 5, growth equity investments commanded a significantly higher LTM EBITDA purchase price multiple than buyout investments and Russell 2500™ Index companies every year going back to 2008, and that premium has generally increased since 2010. In fact, from 2010 to 2017, the average purchase price multiple for growth equity investments increased more than 75% to 18.0 times LTM EBITDA. In contrast, buyout investments experienced a nearly 50% increase to 11.2x and public companies in the Russell 2500™ Index saw an increase of 35% to 12.6x.
FIGURE 5 AVERAGE LTM EBITDA PURCHASE PRICE MULTIPLES
As of December 31, 2017 • Enterprise Value/EBITDA
Sources: Cambridge Associates LLC Private Investments Database (as reported by investment managers), FactSet Research Systems, and Frank Russell Company.
Notes: Outliers were identified and excluded, and the same methodology was applied to the private equity and public company universes. Private equity–owned companies were identified by the manager’s strategy. Analysis includes 1,408 buyout and 393 growth equity deals from 2008–17.
Because growth equity–backed companies are typically self-funded and may be operating at an “artificially low” EBITDA level, investment valuations for this strategy are often expressed as a multiple of revenue. Revenue purchase price multiples also confirm an increasingly expensive environment (Figure 6). Since 2010, average LTM revenue purchase price multiples increased from 2.9x to 4.9x in 2017, well in excess of valuations of public companies in the Russell 2500™ Index, which have generally ranged between 2.0 times and 3.3 times LTM revenue.
FIGURE 6 AVERAGE LTM REVENUE PURCHASE PRICE MULTIPLES
As of December 31, 2017 • Enterprise Value/Revenue
Sources: Cambridge Associates LLC Private Investments Database (as reported by investment managers), FactSet Research Systems, and Frank Russell Company.
Notes: Outliers were identified and excluded, and the same methodology was applied to the private equity and public company universes. Private equity–owned companies were identified by the manager’s strategy. Analysis of private data includes 655 growth equity deals from 2008–17.
Is the Price Right? Yes, if You Keep Growing
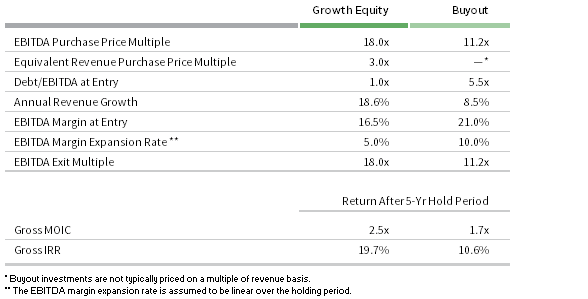
Increasing entry valuations are a common concern for investors today, particularly at the growth stage where increases have been most pronounced. However, in some cases, high-entry valuations can be justified if the portfolio company is demonstrating strong growth or the investment manager can accelerate growth post investment. To illustrate this, we constructed two “back of the napkin” examples, one growth equity and one buyout, that are summarized in Figure 7. The inputs for these investment models were based on information from the Cambridge Associates LLC Private Investments Database and typical elements associated with growth equity and buyout strategies:
- Entry revenue and EBITDA purchase price multiples are 2017 averages (the most recent available). No multiple expansion was assumed for either model at exit.
- Debt/EBITDA are 2018 year-to-date averages from Standard & Poor’s Leveraged Commentary & Data. The models assume the debt/EBITDA multiple is held constant.
- Annual revenue growth represents the most recent five-year average.
- EBITDA margins at entry are 2017 averages. EBITDA margin expansion is assumed to be 5% for the growth equity company and 10% for the buyout company, to reflect the “g-curve” impact discussed earlier.
FIGURE 7 TYPICAL INVESTMENT RETURNS: GROWTH EQUITY VS BUYOUT
Sample Model Analysis
Sources: Cambridge Associates LLC Private Investments Database (as reported by investment managers) and Standard & Poor’s.
The examples illustrate that, despite a significantly higher entry valuation, the growth equity investment generates a higher return over the same period of time. Of course, the key to the growth equity investment’s higher return is a robust level of growth well in excess of the buyout investment. Maintaining that high level of growth is not trivial (nor is substantially improving margins for a leveraged buyout business that is only growing in the single digits).
In the early days of growth equity, managers identified companies in the initial stages of their growth trajectory and developed conviction around the prospects for future growth. There was usually little, if any, post-investment involvement in company operations and returns were largely a function of “betting on the right horse.” Today, well-informed underwriting is no longer enough. Growth equity managers need to be prepared to deliver active post-investment value-add capabilities such as recruiting, business development, product road-mapping, and merger & acquisition advice, among others, to drive growth in deals that might be “perfectly priced” (or to shore up flagging growth). Managers having or developing specialized industry expertise are likely better positioned to contribute to value creation today. Founders of target companies increasingly expect these competencies to accompany private capital.
Growth Equity’s Compelling Return Profile
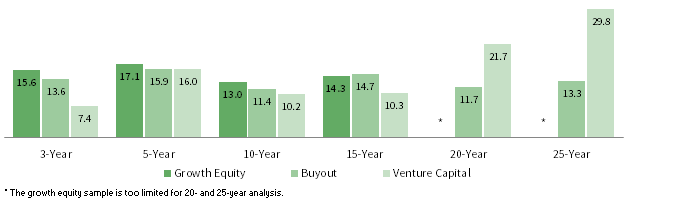
Along the spectrum of private investments, growth equity sits between venture capital and buyouts and offers a combination of the better aspects of both: upside return potential similar to venture but with the lower losses of buyouts. As shown in Figure 8, growth equity’s fund-level returns have been stronger than venture capital in all time periods of 15 years or fewer, and have been comparable to buyouts but with different underlying portfolio company characteristics (which we explored earlier). Of course, due to its outsized performance in the mid- and late 1990s, US venture capital shines over the longest time periods.
FIGURE 8 US GROWTH EQUITY, BUYOUT, AND VENTURE CAPITAL PERIODIC RATES OF RETURN
As of June 30, 2018 • Periodic Rates of Return (%)
Source: Cambridge Associates LLC Private Investments Database (as reported by investment managers).
Notes: Analysis includes 256 US growth equity funds, 849 US buyout funds, and 1,806 US venture capital funds. Periodic asset class returns are pooled returns for each asset class, net to LPs.
Because growth equity investments are typically in companies that have eliminated or mitigated early-stage risks—for example, proof of concept, technology, and adoption—they exhibit lower impairment and capital loss compared to venture capital investments. However, the bootstrapping element of growth equity companies and the need to be profitable early, due to lower levels of outside investment, can also imply the product or service may be less revolutionary than that of a venture capital–backed company. Consequently, the upside return potential of a growth equity investment may be less interstellar than that of venture capital.
Compared to leveraged buyout investments, which are defined by the use of debt to achieve returns, growth equity companies employ little to no leverage. Rather than siphoning off capital to meet debt obligations, all available capital can be used to fuel operations and growth initiatives. It is the investment in sustaining growth that results in these investments exhibiting greater upside than buyouts. That said, growth equity and leveraged buyouts have similar impairment and capital loss statistics. Both types of investments are in companies that are going concerns and can be sold for at least some value in a downside scenario.
The complementary nature of growth equity’s performance to its sister strategies are showcased in two ways: comparative outperformance and underperformance (or lack thereof). Across the three strategies, the percentage of capital producing a MOIC greater than 5.0x indicates, not surprisingly, that venture capital is reliant on a small subset of investments (8% of capital) for half of the value it delivers. In contrast, growth equity capital generated 28% of its total value from investments with MOICs greater than 5.0x and buyouts generated just 18%. Both growth equity (31%) and buyouts (35%) have a larger percentage of capital invested in deals generating a narrower band of outcomes (between 2x and 5x) than venture capital (18%) (Figure 9).
FIGURE 9 INVESTMENT-LEVEL RETURNS DISPERSION
As of June 30, 2018 • Percent (%)

Source: Cambridge Associates LLC Private Investments Database (as reported by investment managers).
Notes: Invested capital column shows the percentage of capital invested in deals generating specified gross total value (unrealized + realized) multiples (TVPI). Total value column shows the percentage of total value (unrealized + realized) generated by deals held or realized at specified total value multiples. Analysis includes 36,286 venture capital investments; 4,248 growth equity investments; and 9,240 buyout investments made between 1990 and 2016. Growth equity deals are those completed by firms classified by Cambridge Associates as pursuing a growth equity investment strategy.
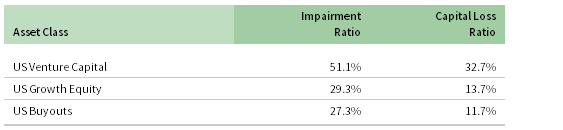
If we were to build a Maslowian 3 pyramid of investing, the first level would have to be “preserve capital.” Indeed, many investors first focus on this element of any private investment strategy given its illiquid nature. From this perspective, growth equity incurs less loss than venture capital (Figure 10), and is fairly close to US buyouts, both having realized loss ratios in a fairly narrow range of 10%–15%, versus 30%–35% for US venture capital. Put another way, growth equity incurs a loss on 13.7% of its capital and earns its overall return on the remaining 86.3%. Buyouts is similar. In contrast, venture capital sustains a loss on 32.7% of its invested capital and earns its overall return on the remaining 67.3%.
FIGURE 10 AGGREGATE CAPITAL LOSS RATIOS
As of June 30, 2018
Source: Cambridge Associates LLC Private Investments Database (as reported by investment managers).
Notes: Analysis included 4,248 growth equity investments, 36,286 venture capital investments, and 9,240 leveraged buyout investments made between 1990 and 2016. Growth equity deals are those completed by firms classified by Cambridge Associates as pursuing a growth equity investment strategy. Capital loss ratio is defined as the percentage of capital in deals realized below cost, net of any recovered proceeds, over total invested capital.
Conclusion
Cambridge Associates’ operating metrics data indicate that the fundamental characteristics of growth equity–portfolio companies remain intact, and the asset class continues to offer investors a compelling return profile that combines the downside protection of buyouts with some of the upside potential of venture capital. The current US economic expansion entered its ninth year in 2018, making it the second longest on record and suggesting that a downturn may come sooner rather than later. Growth equity’s exposure to growing, lightly levered companies may be particularly attractive in a recessionary environment.
Although the appeal of the broad growth equity asset class is clear, manager selection remains critical given the dispersion of returns that is part and parcel for private investment strategies. Today’s growth equity industry is much more competitive than the one that was pioneered by a handful of firms in the 1980s and 1990s. Successful firms today and in the future will need to underpin their sourcing efforts with software and data analytics, and develop more robust post-investment value-add capabilities to drive growth. Firms with specialized industry expertise are better positioned to do well in this competitive environment. Industry specialists’ strong domain experience and deep relationships allow them to better identify and win the best opportunities, and provide industry-specific operating and strategic skills to drive value creation and successful exits.
Disclosures
Cambridge Associates Indexes
Cambridge Associates derives its US private equity benchmark from the financial information contained in its proprietary database of private equity funds. As of June 30, 2018, the database comprised 1,481 US buyouts, private equity energy, growth equity, and mezzanine funds formed from 1986 to 2018, with a value of $767 billion. Ten years ago, as of June 30, 2018, the index included 876 funds whose value was $387 billion.
Cambridge Associates derives its US venture capital benchmark from the financial information contained in its proprietary database of venture capital funds. As of June 30, 2018, the database comprised 1,807 US venture capital funds formed from 1981 to 2018, with a value of $224 billion. Ten years ago, as of June 30, 2008, the index included 1,271 funds whose value was $94 billion.
The pooled returns represent the net end-to-end rates of return calculated on the aggregate of all cash flows and market values as reported to Cambridge Associates by the funds’ general partners in their quarterly and annual audited financial reports. These returns are net of management fees, expenses, and performance fees that take the form of a carried interest.
Public Index
The Russell 2500™ Index consists of the bottom 500 securities in the Russell 1000® Index and all 2,000 securities in the Russell 2000® Index. It measures small to medium-small stock performance.
Footnotes
- EBITDA refers to earnings before interest, tax, depreciation, and amortization.
- As of December 31, 2017, Cambridge Associates tracked historical operating data that encompassed 4,000 realized and unrealized US portfolio companies. Cambridge Associates identified and removed outliers.
- All apologies to Abraham Maslow!
Andrea Auerbach - Andrea Auerbach is the Global Head of Private Investments and a Partner at Cambridge Associates.
Caryn Slotsky - FootnotesEBITDA refers to earnings before interest, tax, depreciation, and amortization. As of December 31, 2017, Cambridge Associates tracked historical operating data that encompassed 4,000 realized and unrealized US portfolio companies. Cambridge Associates identified and removed outliers. All apologies to Abraham Maslow!
About Cambridge Associates
Cambridge Associates is a global investment firm with 50+ years of institutional investing experience. The firm aims to help pension plans, endowments & foundations, healthcare systems, and private clients achieve their investment goals and maximize their impact on the world. Cambridge Associates delivers a range of services, including outsourced CIO, non-discretionary portfolio management, staff extension and alternative asset class mandates. Contact us today.