Constructing Superior Equity Portfolios

Executive Summary
- A common perception among investors that employ active equity management is that the “donut” structure—an all-active manager structure often composed of four or more high conviction managers—is more aggressive, more expensive, and riskier than the “core-satellite” structure—which blends active and passive management by adding a large passive core component to the donut—because of the donut structure’s heavier reliance on concentrated, high tracking error, high fee managers. In contrast, the large passive element of the core-satellite structure is presumed to reduce these risks. The research we present in this report calls into question these perceptions.
- Over the 17-year period examined in this report, the donut structure has offered higher returns net of fees with similar levels of risk to the core-satellite structure. Though the core-satellite structure had a tighter range of return outcomes, performance for the donut structure was superior across all four performance quartiles. The median outcome for the donut structure was 72 bps higher, while the upper range (1st percentile) of outcomes outperformed by 140 bps. Notably, even the worst (99th percentile) outcomes of the donut structure were slightly superior, beating those of the core-satellite structure by 23 bps.
- Any historical analysis of returns—especially one encompassing 17 years—is subject to survivorship bias. In addition, because the donut structure relies more heavily on active management, it is more likely to benefit from that bias than the core-satellite structure. We conducted a detailed analysis of the impact of that bias and found that survivorship bias accounted for 15 bps of the median donut portfolio’s relative performance—meaning that 57 bps of the 72 bps outperformance is attributable solely to manager structure.
- Does the higher return of the donut structure come with an unpalatable level of risk? Our analysis indicates the answer is no. While the average volatility of the core-satellite portfolios is indeed slightly lower (16.8 versus 17.1, consistent across all four performance quartiles), the higher return of the donut structure across quartiles makes for a higher risk-adjusted return.
- The 17-year period of our analysis contains several unique market environments: the tech bubble, the tech bust, the easy-credit bull market from 2002 to 2007, the 2008 liquidity crisis, and the stimulus-driven rally since 2009. In each of these five periods, the donut structure had higher median performance and better performance in the top quartile than the core-satellite structure. However, the 99th percentile portfolios of the donut structure underperformed those of the core-satellite structure in each of the five periods. The underperformance of the donut structure’s 99th percentile portfolios was more pronounced over two of these periods: the speculative environment of the tech bubble between 1996 and March 2000 and the liquidity crisis of 2008–09.
- For most rolling three-year periods since 1996, the median and upper percentiles of the donut structure materially outperform those of the core-satellite structure, while the performance of the lower percentiles is generally similar. However, there are extended periods where the rolling three-year performance of the worst-performing (90th percentile) donut portfolios substantially underperformed the worst-performing core-satellite portfolios.
- For investors that adopt a manager structure populated by concentrated, high tracking error managers, whether in a donut or core-satellite structure, perhaps the greatest risk they face is the natural tendency to focus on short-term results. Given the cyclicality of manager returns, the temptation to fire a manager based on poor recent performance—and to replace it with one showing strong recent performance—can lead to disappointing results. Success for either structure depends on patience and a long-term view. A five-year time frame—encompassing a more complete market cycle—is likely a better yardstick of success or failure than shorter evaluation periods.
- While rebalancing is not critical to the success of the donut structure, it seems to have a more positive impact for the donut structure than for the core-satellite structure. Further, because rebalancing has a small positive impact over time—particularly in reducing the magnitude of negative outcomes—investors may find it worthwhile to put in place target allocations for individual managers to establish a framework (and impose discipline) for annual rebalancing.
- Investors with core-satellite portfolios might benefit from revising their rationale for implementing with such a structure. If it is to protect portfolio downside or mitigate volatility, investors may not be getting the result they expect. Recognizing the behavioral challenge that might exist in moving to a donut structure, we would encourage investors to consider how their equity returns may be augmented by abandoning a traditional core-satellite structure and allowing a well-selected portfolio of high conviction equity managers to fuel the return engine in their equity portfolios.
For investors that choose to employ active equity management, a great deal of time and effort is spent trying to identify managers that can beat their benchmarks. But how you structure your equity manager portfolio may be just as important as the managers you choose in outperforming the market. Manager structure takes many forms, ranging from completely passive to completely active. This report takes an in-depth look at two common equity manager structures to assess whether investors may fare better with one structure or the other. The first is the “donut” structure, typically composed of four or more high conviction managers diversified by style, capitalization, or strategy. The second is the “core-satellite” structure, which essentially blends active and passive management by pairing the donut structure with a large passive “core.”
A common perception among investors is that the donut structure is more aggressive, more expensive, and riskier than the core-satellite structure because of its heavier reliance on concentrated, high tracking error, high fee managers. In contrast, the large passive element of the core-satellite structure is presumed to reduce these risks. However, our research calls into question these perceptions: over the 17-year period examined in this report, the donut structure has offered higher returns net of fees with similar levels of risk to the core-satellite structure. Our analysis suggests that, at a minimum, investors should reassess whether a core-satellite structure is as likely to help them earn their payout as a donut structure.
Methodology
To weigh the tradeoffs between the donut and core-satellite structures, we developed a model to construct portfolios at random using return data from a subset of managers in the Cambridge Associates LLC Investment Manager Database. In selecting managers for this analysis, we wanted to achieve three things:
- Sufficiently long time horizon. Recognizing that there are extended periods in which certain factors fare better or worse—or where active management as a whole tends to struggle relative to passive management—extending the analysis as far back as possible while maintaining sufficiently robust data proved critical in creating an even playing field for both structures. The period between January 1997 and December 2013 offered the most robust data set while encompassing multiple market cycles. Excluding any managers that reported performance for only part of that 17-year period, we began with 713 equity products with complete performance records.
- Diversification by style and capitalization. To neutralize the impact of factor exposures, each portfolio created by our model contains only one manager from each of the all-cap, large-cap value, large-cap growth, small-cap value, and small-cap growth categories. If an investment strategy did not fit into one of these buckets (e.g., single sector strategies, enhanced index strategies, REITs), it fell out of consideration. After isolating managers into each of these five categories, we further whittled our universe down to 409 equity products.
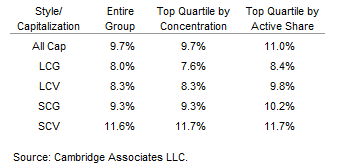
- High Active Share. 1 Both the donut and core-satellite structures attempt to add value by emphasizing concentrated, high conviction managers. To select those managers from our universe of 409, we used the findings of an earlier Cambridge Associates report as a guide. That report found that the combination of high active share, high concentration, and modest tracking error had the greatest power to predict superior returns. 2 However, as there is such a strong correlation between active share and concentration 3 we simply used active share as a proxy for both criteria. Moreover, high active share in isolation is a strong predictor of superior return, while the same cannot be said of concentration, as illustrated in Table 1. Selecting for only the top quartile by active share in each of the style and capitalization categories described above, we were left with a final universe of 108 strategies diversified by style and capitalization, filtered for active share, and with complete performance records.
Table 1. Median Performance by Selection Criteria
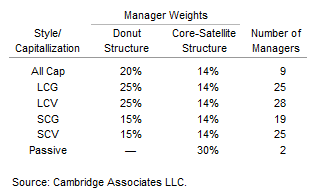
For both structures, our model constructed portfolios of five high active share managers diversified by style and capitalization, with a sixth passive element added for the core-satellite structure. Manager weights were designed to eliminate any relative style or capitalization bias between the two structures. As illustrated by Table 2, the core-satellite structure has a 30% allocation to the passive index and an equal weight (14%) to each of the five active managers, while the donut structure has a 25% weight to each of the large-cap managers, a 15% weight to each small-cap manager, and a 20% weight to the all-cap manager. When accounting for the passive element of the core-satellite structure, this results in similar capitalization and style exposures for both structures.
Table 2. Universe Construction
We modeled each structure for 10,000 iterations, meaning that 10,000 different combinations of individual all-cap, large-cap, small-cap, value, and growth managers were analyzed. While there were millions of possible portfolio combinations for each structure studied, 10,000 iterations was the minimum number necessary to ensure statistical significance at a 95% confidence level plus or minus a small margin of error.
All returns in this paper are net of fees. Annual management fees were determined by averaging the fees of each active share quartile from the eVestment universe of large-cap and small-cap products—a widely used, institutional manager–reported database—and then subtracting the average fees for the highest active share quartile from each manager’s returns. This methodology deducted 100 bps from all-cap managers, 96 bps from small-cap managers, and 76 bps from large-cap managers. For those strategies that already reported net returns in the Cambridge Associates database, annual management fees were left as is.
These criteria were designed to focus outcomes on the effects of portfolio structure rather than factor exposure. Our overall objective was two-fold: first, to determine whether—since there are discrete periods where passive or active management tends to perform better or worse—the addition of a passive core improved the risk/return tradeoff of a manager portfolio. Second, as all manager returns in our model are net of fees, to determine whether the reduction in fees gained by adding a passive component improved performance outcomes relative to the donut structure.
Outcomes
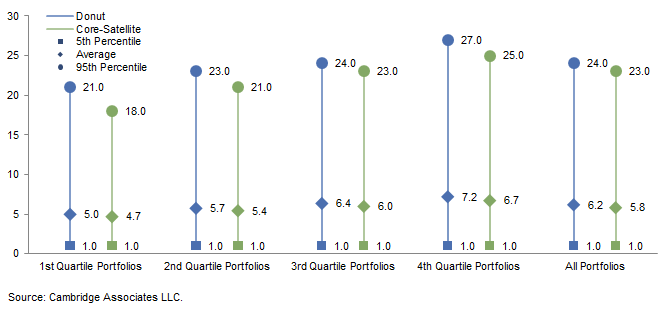
Using the methodology just described, Figure 1 illustrates the range of outcomes for the donut and core-satellite structures in terms of annualized return, net of fees, for the 17 years in our analysis.
Figure 1. Range of Return Outcomes
Average Annual Compound Return (%)
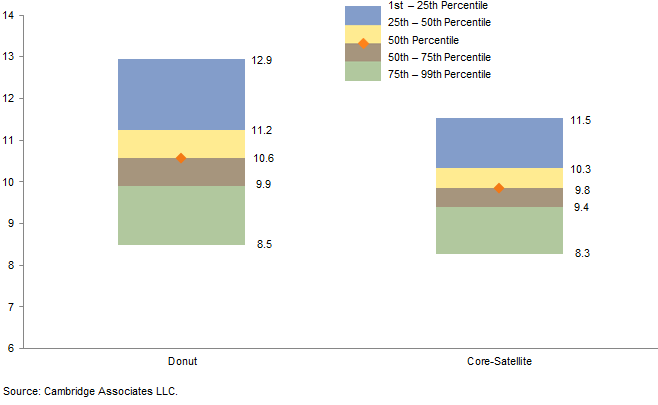
The results are surprising. While investors may pursue a core-satellite structure with the expectation of similar upside potential to a purely active donut structure with fewer negative outcomes (i.e., reducing the impact of extreme manager underperformance), Figure 1 indicates that the opposite is true: though the core-satellite structure had a tighter range of return outcomes, performance for the donut structure was superior across all four performance quartiles. The median outcome for the donut structure was 72 bps higher, while the upper range (1st percentile) of outcomes outperformed by 140 bps. Notably, even the worst (99th percentile) outcomes of the donut structure were slightly superior, beating those of the core-satellite structure by 23 bps. 4 In other words, while the worst-case scenarios of the donut structure were similar to those of the core-satellite structure, the potential for upside was far greater. 5
Risk-Adjusted Returns
From this analysis, it seems clear that the donut structure increases the likelihood of achieving better absolute performance—but what about the risk side of the equation? Does the higher return of the donut structure come with an unpalatable level of risk? Our analysis indicates the answer is no. While the average volatility of the core-satellite portfolios is indeed slightly lower (16.8 versus 17.1, consistent across all four performance quartiles), the higher return of the donut structure across quartiles makes for a higher risk-adjusted return, as illustrated by Figure 2.
Figure 2. Portfolio Sharpe Ratios
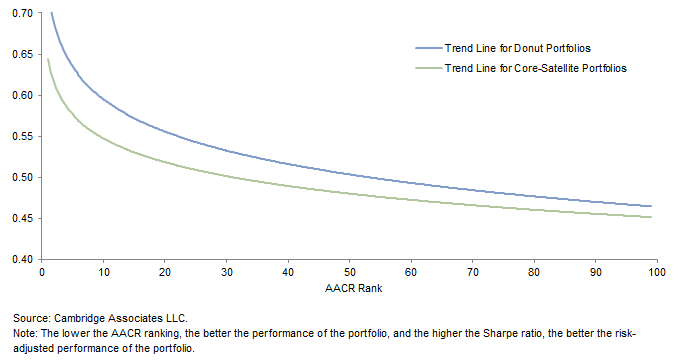
Because our model analyzes 10,000 individual portfolios for each structure, it is impossible to arrive at a single risk-adjusted measure (Sharpe ratio) representative of a given structure. Instead, we have illustrated below the logarithmic trend line for Sharpe ratios of the two structures relative to their performance percentile ranking (1 being best and 100 being worst). While Sharpe ratios drop off at lower-performing percentiles for both structures, the donut structure’s Sharpe ratios are higher at every percentile than for the core-satellite structure. There are exceptions among the 10,000 portfolios generated for each structure, of course, but this analysis illustrates that in general, the donut structure not only produces better return outcomes but at similar—if not superior—levels of risk.
We have shown that over a period of nearly two decades, a high active share donut structure is more likely to provide better risk-adjusted returns than the active-passive blend of the core-satellite structure. But what do investors have to endure in the short term to gain those long-term benefits? Are there discrete periods where the core-satellite structure performs markedly better than the donut structure? How long should investors expect to wait to see consistent value add from the donut structure? Are investors more likely to endure long periods of sub-benchmark performance with a purely active approach? We attempt to address these questions in the following sections, and once again the answers support rethinking the relative safety of the core-satellite structure.
Different Market Environments
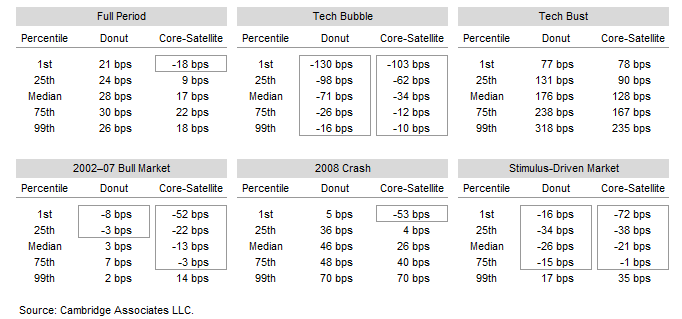
Macroeconomic forces, government intervention, and behavioral factors all combine to create different market environments in which certain active management strategies—or manager structures—may fare better or worse. The 17-year period of our analysis contains several unique market environments: the tech bubble, the tech bust, the easy-credit bull market from 2002 to 2007, the 2008 liquidity crisis, and the stimulus-driven rally since 2009. To gauge the relative strengths of the donut and core-satellite structures in different markets, we tested them across discrete time periods approximating each of these market environments.
In each of the five periods shown in Figure 3, the donut structure had higher median performance and better performance in the top quartile than the core-satellite structure. Indeed, even the lower-range outcomes were in most cases similar to, if not better than, those of the core-satellite structure—with the exception of the very worst-performing portfolios: the 99th percentile portfolios of the donut structure underperformed those of the core-satellite structure in each of these five periods. How, then, over the entire 17-year period did even the worst donut structure portfolios beat those of the core-satellite structure, as shown in Figure 1? It is important to bear in mind the individual portfolios that make up a given quartile are not consistent over time: the 99th percentile portfolio during, say, the tech bust, may have been a first- or second-quartile portfolio in the subsequent bull market. Thus, in aggregate and over the full time period of our analysis, even the 99th percentile outcomes of the donut structure were superior to those of the core-satellite structure.
Figure 3. Returns in Different Market Environments
Percent (%)
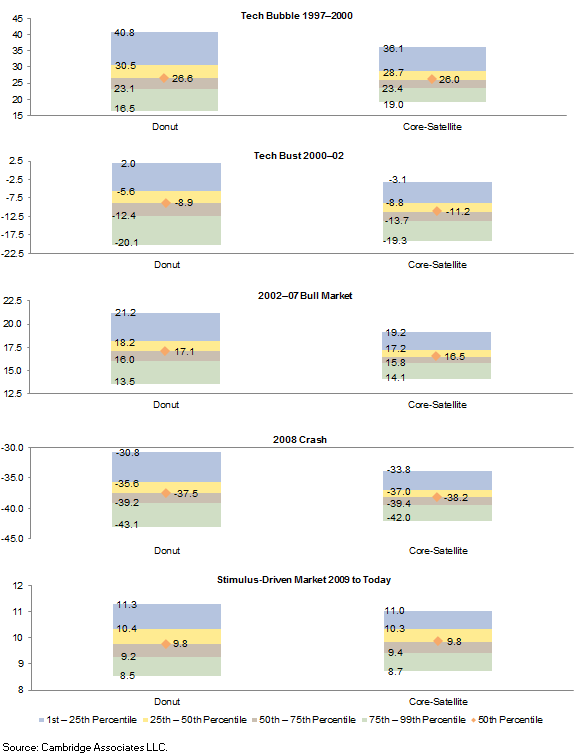
That said, the underperformance of the donut structure’s 99th percentile portfolios was more pronounced over two of these periods: the speculative environment of the tech bubble between 1996 and March 2000 and the liquidity crisis of 2008–09. Taking the tech bubble first, in this environment—when revenue-negative companies were trading at astronomical multiples and active managers with any valuation or quality discipline were punished—the passive market exposure of the core-satellite structure allowed for similar upper-range outcomes with substantially improved lower-range outcomes, thanks to the index’s heavier tilt toward the bubbling tech sector.
Looking at the liquidity crisis of 2008–09, the donut structure again modestly underperformed on the low end but still outperformed at the median and upper end. A possible explanation could be essentially the reverse of what happened in the tech bubble. Correlations tend to increase during market crises and the whole market traded down, but in the case of concentrated active managers this was likely amplified by their large active bets versus the benchmark. During the latter period, so-called low-quality stocks that had become inflated during the 2007 bubble were the main drivers of the subsequent correction. However, the level of underperformance during this period pales in comparison to the magnitude of outperformance during the tech bubble crash. As a result, over complete market cycles, the donut portfolio still offers potential for greater upside while meaningfully limiting the downside compared to the core-satellite structure.
In general, during speculative or liquidity-driven markets, the passive exposure of the core-satellite structure allows for better outcomes among the worst-performing portfolios—although the best donut portfolios still outperform 6 the best core-satellite portfolios. Inevitably during these periods, cries in the financial press about the folly of active management become loudest, but as we have illustrated, patient investors that stick to their guns through complete market cycles will be rewarded.
Different Rolling Periods
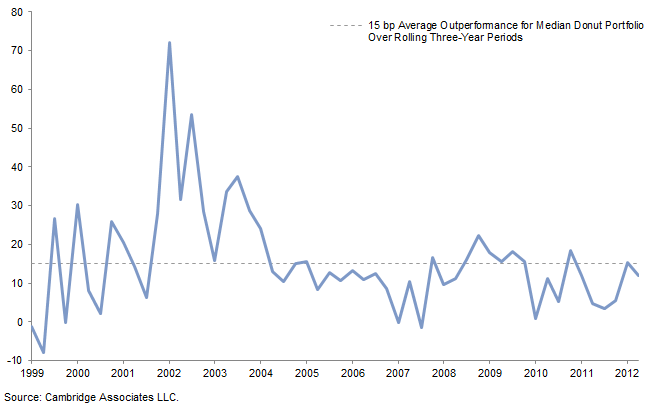
A natural extension of this analysis is to then look at uniform sub-periods to answer the question of how long investors should expect to wait to see consistent value add. Upon incorporating three- and five-year rolling periods into the analysis, the results in Figure 4 confirm the same general trends and outcomes observed over the full 17-year period. 7 Since we have already illustrated that the donut structure generally outperforms the core-satellite structure, Figure 4 depicts the rolling value added of the donut structure by subtracting the rolling three-year performance of the core-satellite structure from that of the donut at the 10th, 50th, and 90th percentiles.
Figure 4. Value Added by Donut Structure vs Core-Satellite Structure Over Rolling Three-Year Periods
Percent (%)
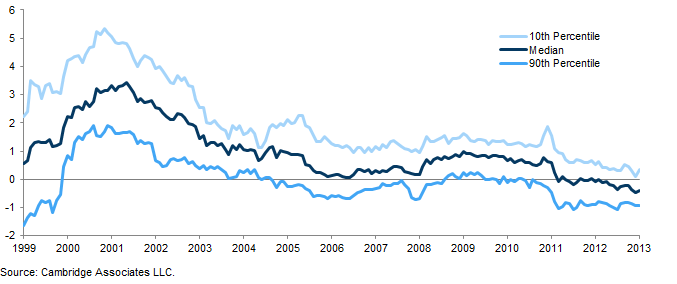
For most rolling three-year periods since 1996, the median and upper percentiles of the donut structure materially outperform those of the core-satellite structure, while the performance of the lower percentiles is generally similar. Again, however, there are some important exceptions: between 2006 and 2009, and again between 2011 and 2013, there are extended periods where the rolling three-year performance of the worst-performing (90th percentile) donut portfolios substantially underperformed the worst-performing core-satellite portfolios. During these periods even the median donut portfolio lagged the median core-satellite portfolio on a three-year rolling basis (albeit much more briefly). This result is not surprising, however, as these three-year periods include the discrete market environments in which lower-end outcomes of the core-satellite structure generally fared better than those of the donut structure.
In the rolling five-year analysis, the donut structure begins to distinguish itself a bit more. As shown in Figure 5, both the duration and magnitude of the donut structure’s lower-quartile underperformance versus the core-satellite structure are substantially reduced over a longer time horizon. Moreover, the median consistently adds value, while the potential for substantial upside among the higher percentile outcomes remains.
Figure 5. Value Added by Donut Structure vs Core-Satellite Structure Over Rolling Five-Year Periods
Percent (%)
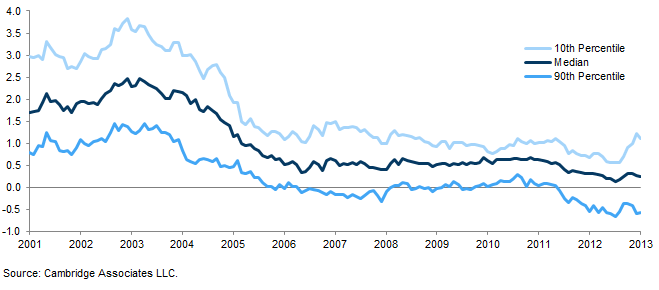
For investors that elect to pursue an all-active portfolio of concentrated, high conviction managers like the donut structure, a five-year time frame—encompassing a more complete market cycle—is likely a better yardstick of success or failure than shorter evaluation periods.
Behavioral Risk: Time Spent Below the Benchmark
For investors that adopt a manager structure populated by concentrated, high tracking error managers, whether in a donut or core-satellite structure, perhaps the greatest risk they face is the natural tendency to focus on short-term results. Given the cyclicality of manager returns, the temptation to fire a manager based on poor recent performance—and to replace it with one showing strong recent performance—can lead to disappointing results. Success for either structure depends on patience and a long-term view.
Indeed, as Figure 6 illustrates, even the best-performing portfolios from our model spent a significant amount of the 17-year period from 1996 to 2013 with one or more managers underperforming by at least 200 bps, even on a rolling three-year basis. The potential is even greater over shorter periods to have one or more managers below the benchmark by a significant margin. In fact, the single best-performing portfolio of the ten thousand we ran spent more than half of the 17-year period with one or more managers below the benchmark by at least 200 bps—and this is a portfolio that nearly doubled the index return over that time.
Figure 6. Average Percent of Time Portfolios in Each Quartile Spent With Individual Managers
Below the Benchmark by at Least 200 bps
Rolling 36-Month Periods
This analysis suggests that, while it is still important to carefully monitor individual manager performance, investors that adopt either of these structures may be better able to avoid behavioral pitfalls by placing greater emphasis on evaluating performance at the equity portfolio level than at the equity manager level.
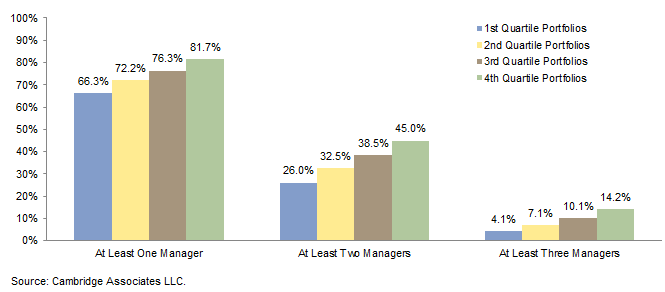
What, then, about sub-benchmark performance at the equity portfolio level? Investors might reasonably assume that because of its large passive (i.e., benchmark) component, the core-satellite structure would naturally spend less time below the benchmark than the donut structure. Our analysis shows that this is not true. Figure 7 shows the time spent below the benchmark for each performance quartile of both the donut and core-satellite structures. The outcomes are remarkably similar for both structures. For example, for the first (best) performance quartile, the longest discrete period spent below the benchmark ranged from 1 to 21 months for the donut structure, and from 1 to 18 months for the core-satellite structure. The average for both was around 5 months. Not surprisingly, the range widens moving toward the lower-performing quartiles—with 27 months being the longest (95th percentile) single period of underperformance for the donut structure and 25 months for the core-satellite structure in the fourth quartile—but the average difference in time spent lagging the benchmark between the two structures is negligible.
Figure 7. Number of Months Spent Below the Benchmark
Rolling Three-Year Periods
Nor is there a significant difference in the discrete number of times (of whatever duration) the portfolios of either structure fell below the benchmark. Looking at the same data we found that the total universe of portfolios fell below the benchmark between zero and 20 times over the 17-year period for the donut structure and between zero and 21 times for the core-satellite structure. Once again the results are the same across performance quartiles, with only a few minor exceptions.
In short, while behavioral risk is an important concern for either structure, there is nothing inherent in the average donut portfolio that should cause more concern about prolonged underperformance than the more traditional core-satellite approach.
The Importance of Rebalancing
One of the key differences in analyzing the performance of an individual manager versus that of a portfolio of managers is the fact that the portfolio’s risk/return profile can be materially altered over time through rebalancing. But how does an investor’s choice of which manager structure to employ influence the impact of rebalancing on the portfolio—and how does that impact vary over different market environments? Table 3 illustrates the effect of annual rebalancing on the two different structures for the full time period and in the various sub-periods, and the differences are enlightening. Not surprisingly, for the full 17-year period, rebalancing improved outcomes for both groups at nearly every percentile of performance. Notably, the greatest impact was generally on the poorest-performing quartiles across both groups, meaning that rebalancing reduced the magnitude of negative outcomes while generally enhancing the magnitude of positive outcomes. The exception is the top percentile of outcomes for the core-satellite structure. This is not surprising: as the portfolios in the top percentile had the best-performing active managers, rebalancing to the passive index was somewhat costly in performance terms.
Table 3. Value Added or Detracted by Annual Rebalancing
More specifically, however, rebalancing seems to have a slightly more positive impact overall on the donut portfolios. This implies that using high active share as a selection criterion in a donut structure not only improves a portfolio’s chances of outperforming the market over time, but increases the value added from rebalancing as a measure to ensure balance among market capitalization, style, or even factor influences.
The story is not the same in all market environments, however. Generally speaking, in bear markets rebalancing tends to add value uniformly, but in bull markets—or more specifically, in speculative or liquidity-driven markets—rebalancing actually reduced returns more or less across the board. In particular, rebalancing tended to reduce returns more for the higher percentile performance outcomes than the lower end. No doubt this phenomenon encourages the sentiment that investors should “let the winners run”—but even that is not true in all market environments.
This analysis suggests that while rebalancing is not critical to the success of the donut structure, it seems to have a more positive impact for the donut structure than for the core-satellite structure. Further, because rebalancing has a small positive impact over time—particularly in reducing the magnitude of negative outcomes—investors may find it worthwhile to put in place target allocations for individual managers to establish a framework (and impose discipline) for annual rebalancing. 8
Conclusion
Many investors have adopted a core-satellite portfolio in a belief that a passive core will reduce the risks associated with the concentrated, high tracking error, high fee managers that characterize a donut structure. Comparing these two high active share manager structures, we have demonstrated that the best way to earn returns above the benchmark may be not to invest in the benchmark at all. By taking an all-active approach through a diversified, high conviction donut structure, investors can improve their opportunity for superior returns. Through diligent rebalancing of a diversified structure of high active share managers, investors can achieve similar diversification benefits to a passive index while simultaneously improving both upside and downside outcomes. Investors with core-satellite portfolios might benefit from revising their rationale for implementing with such a structure. If it is to protect portfolio downside or mitigate volatility, investors may not be getting the result they expect. Recognizing the behavioral challenge that might exist in moving to a donut structure, we would encourage investors to consider how their equity returns may be augmented by abandoning a traditional core-satellite structure and allowing a well-selected portfolio of high conviction equity managers to fuel the return engine in their equity portfolios.
Appendix A: A Note on Survivorship Bias
Studies that focus on a shorter time horizon (say, five to seven years) than ours may effectively reduce the impact of survivorship bias, but are limited to illustrating how active managers performed in a very specific market environment. The last five to seven years, for example, have been a particularly unusual environment for equity management, driven more by global macroeconomic policy decisions than company fundamentals.
Understanding this limitation, we structured our analysis in an attempt to neutralize the impact of survivorship bias. Over longer periods, compounding returns inflate survivorship bias. Thus, we chose managers that provided performance over the same period, the simplifying assumption being that managers with performance available over the same time interval should have approximately the same degree of survivorship bias embedded in their compound returns. The goal of this paper is not to compare the relative performance of individual managers, but rather to compare the absolute results of different manager structures composed of those managers.
We do recognize, however, that survivorship bias is higher for high active share managers. This is because high active share managers tend to have volatile performance patterns and so the likelihood of persisting and performing well is probably lower. Our research shows that investors that have been willing to stomach volatility associated with individual higher-concentration managers as part of a portfolio of concentrated managers have been rewarded over time. We note also that high active share managers are also more likely to have higher levels of business risk, but investors should be rewarded for taking that risk over time.
In an attempt to determine whether the survivor group had significantly better performance than the other managers, we did evaluate portfolios over shorter periods. We analyzed survivorship bias with two objectives in mind: to quantify the impact of survivorship bias on our results and to determine whether the preferential ranking of these portfolio structures holds true over each rolling three-year period. To gauge the magnitude of survivorship bias, the performance of the managers that featured complete data sets from first quarter 1997 through fourth quarter 2013 (survivors) was compared against managers that reported to the Cambridge Associates database for only a portion of that time. Accounting for market capitalization and style left 612 equity products with incomplete performance records. The comparison found that over three-year rolling periods, the survivors outperformed by 46 bps for the donut structure and 31 bps for the core-satellite structure on an average annualized basis. Given the higher active weight inherent to the donut structure versus the core-satellite structure (100% compared to 70%), focusing on the relative survivorship bias difference between the two portfolios also deserved scrutiny as it could explain some degree of the donut structure’s outperformance. Figure A indicates that over the same three-year rolling periods, the donut structure averaged an additional 15 bps of survivorship bias.
Figure A. Survivorship Bias Structure Difference
Rolling Three-Year Periods. Basis Points
In short, the questions we attempted to address, whatever the available universe of managers over a given time period, were (1) is active share a better predictor than random manager selection?, and (2) did a donut structure outperform a core-satellite structure? Our analysis indicates that by and large the answer to both questions is yes. While survivors are expected to be top performers, the findings were satisfying in demonstrating the superiority of a donut portfolio consisting of high conviction (e.g., high active share) satellite managers across the entire manager universe. 9
Appendix B: Tracking Error as a Selection Criterion
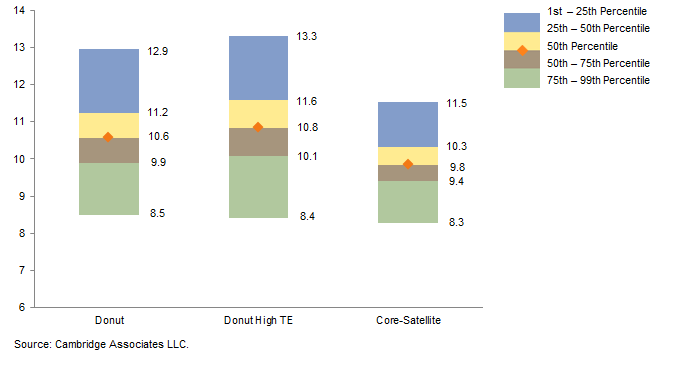
Donut Structure, High Active Share, Top Quartile Tracking ErrorWe acknowledge that many investors are used to considering tracking error in manager selection. We illustrate in our analysis that a high level of active share—and, by extension, concentration—do indeed have positive predictive power in a portfolio structure. But what about the third criterion: tracking error? CA’s earlier analysis indicated that, at the individual manager level, by selecting for high concentration and active share but eliminating managers that fall in the top quartile of tracking, investors can retain much of the positive outcomes of the resulting universe while limiting negative outcomes. The most likely reason for this is that managers that fall in the top quartile of tracking error are more likely to have substantial factor bets (such as sector concentration), which creates the potential for meaningful outperformance and underperformance. We sought to extend this analysis by testing whether the observation about tracking error applies similarly in the context of a portfolio of managers. To facilitate this analysis, we evaluated managers based on a different set of criteria than that used in our main analysis in this report. We narrowed down the high active share universe to include only those high active share managers that fell in the top quartile of tracking error within their respective capitalization or style universe.
Our analysis found a slightly different result when applied in a portfolio context. As illustrated in Figure B, a donut portfolio of high active share managers in only the top quartile of tracking error has generally superior outcomes relative to the high active share–only structure, which has the same criteria but encompasses all tracking error quartiles. In fact, while the worst outcomes are similar (99th percentile annualized returns of 8.4% and 8.5%, respectively), the upper outcomes are slightly different (1st percentile annualized return of 13.3% for the highest tracking error quartile versus 12.9% for the donut structure that encompasses all tracking error quartiles).
Figure B. Range of Return Outcomes Inclusive of High Active Share, High Tracking Error (TE)
Average Annual Compound Return (%)
Why is this? Why would one criterion for selection of individual managers generate different outcomes in the context of a portfolio of managers? The answer is likely that—just as adding a highly volatile asset class with low correlations to a broader portfolio improves its overall risk/return profile—having idiosyncratic elements in a manager portfolio enhances long-term outcomes. This raises two important issues, however. First, to the extent there are substantial factor bets among individual managers in the portfolio, it may be helpful to ensure that they are offset by factor bets among other managers. Second, rebalancing among the managers when those factor bets pay off—or suffer—may be crucial to reaping the diversification benefits of having idiosyncratic positions.
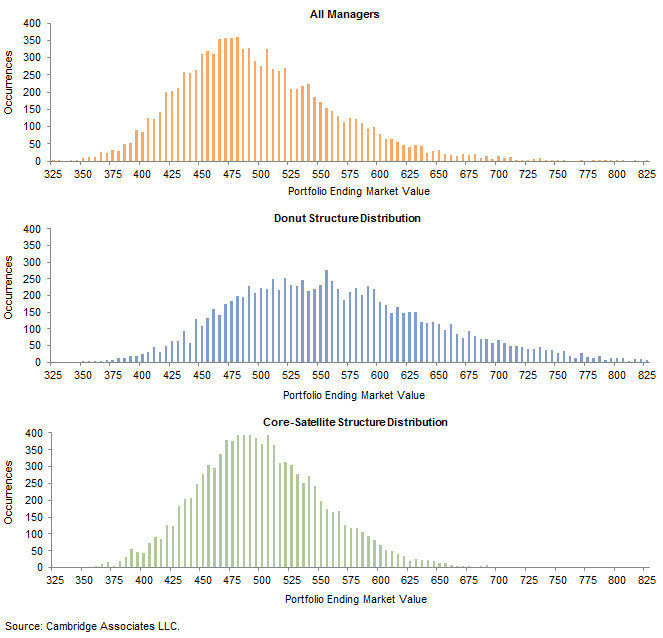
Appendix C: Distribution of Model Outcomes
Figure C shows the distribution of the 10,000 individual outcomes in terms of ending market value at the close of the 17-year period (beginning value = $100). As illustrated below, while the core-satellite group conforms roughly to a normal distribution, the donut structure follows a distribution that is skewed to the right, offering both a broader dispersion of outcomes and a higher number of more positive results. While the lower-end outcomes fall in roughly the same spot for both groups (around $350), the return distribution of the donut structure offers much more potential for extremely positive outcomes.
Figure C. Distribution of Model Outcomes
Footnotes
- Active share is a measure that quantifies the degree to which a portfolio’s holdings are different from those of its benchmark. It is calculated by summing the absolute value of the differences of the weight of each holding in a manager’s portfolio and the weight of that same holding in the manager’s benchmark index and then dividing the result by two. While much of the research on active share focuses on retail mutual funds, testing our criteria against the Cambridge Associates universe of institutional managers (whether actively recommended by us or not) better reflects the opportunity set available to our clients.
- This analysis will focus on active share as the primary predictor of superior return. For an investigation into the influence of tracking error on manager selection, please see Appendix B.
- For example, it is mathematically implausible for an equally weighted manager benchmarked to the S&P 500 to have high active share if the fund holds 250 stocks. Active share represents high conviction—expressed as either a concentrated number of overall holdings or a concentration among the top holdings of an otherwise more numerous portfolio of securities.
- We recognize that any historical analysis of returns—especially one encompassing 17 years—is subject to survivorship bias. In addition, because the donut structure relies more heavily on active management, it is more likely to benefit from that bias than the core-satellite structure. We conducted a detailed analysis of the impact of that bias (please see Appendix A) and found that survivorship bias accounted for 15 bps of the median donut portfolio’s relative performance—meaning that 57 bps of the 72 bps outperformance is attributable solely to manager structure.
- See Appendix C for further analysis of different outcomes. Appendix C shows the distribution of all outcomes from the 10,000 iterations run by the model. While the distributions largely conform to a bell curve for both structures, the outcomes for the donut structure are significantly skewed to the right.
- One exception is the recent stimulus-driven market from 2009 to 2013, where outcomes across quartiles were similar for both structures.
- For this analysis we conducted 5,000 iterations, as the 10th, median, and 90th percentiles proved consistent with those achieved through 10,000 iterations.
- While a discussion of various rebalancing methodologies is beyond the scope of this paper, our model did allow us to test the effectiveness of various time-based methods. In short, annual rebalancing is basically as effective—if not more effective—than more complex methods and has the added benefit of being simple and thus more likely to be followed.
- While we understand that the statistical probability of selecting five managers in 1996 that would survive the full 17-year period without being replaced may be low (there were 1,055 managers during this time with incomplete performance that met our style criteria), this study is meant as a demonstrative exercise to give guidance on manager structure.
Hamilton Lee - Hamilton is Co-Head of the Healthcare Practice at Cambridge Associates.
About Cambridge Associates
Cambridge Associates is a global investment firm with 50+ years of institutional investing experience. The firm aims to help pension plans, endowments & foundations, healthcare systems, and private clients achieve their investment goals and maximize their impact on the world. Cambridge Associates delivers a range of services, including outsourced CIO, non-discretionary portfolio management, staff extension and alternative asset class mandates. Contact us today.