Don’t Count Out Government Bonds Just Yet


Historically, we have recommended investors hold high-quality government bonds as a counterbalance in equity-heavy portfolios. However, in recent years, some investors have reduced their exposure to government bonds, given their low yields, in favor of cash. This was prescient in 2022. Global equities returned -16% in local currency terms, but government bonds also suffered steep losses, while cash was one of the best-performing assets.
It is rare for both stocks and bonds to have negative returns in the same year, and we expect cash to continue to underperform both asset classes over the long term. Further, the outlook for government bonds is more constructive; yields have increased sharply and the sell-off is overdone, valuations have improved, and the economic and policy backdrop are turning more supportive.
Inflation is a risk, and some investors are concerned that bonds are in a structural bear market, but this is not certain, and the potential structural risks do not outweigh the clear cyclical tailwinds. Investors should not underweight high-quality government bonds, as we are likely in the later stages of the current macro cycle, but they should wait for a better entry point to overweight government bonds or extend duration.
A Terrible, Horrible, No Good, Very Bad Year
Bond investors will not look back fondly on 2022. The Bloomberg US Treasury Index 1 returned -12.5%, its worst year since its inception in 1973. It was also only the sixth year in the previous 123 years that both stock and bond returns were negative in the same year, and only the 20th year that both asset classes trailed cash.
Last year was unique. One of the major challenges was low interest rates. US Treasury bonds entered the year yielding 1.23%, not far off their record lows. This meant they offered little resistance in terms of income to offset a sharp rise in yields (bond prices fall when yields rise), which is exactly what happened when the Federal Reserve aggressively raised policy rates last year to cool the economy and bring down inflation. US Treasury yields ended 2022 near their highest level in over 15 years, at 4.18%.
Another sharp uptick in interest rates would be challenging, but yields are much higher today and Treasuries are in a better position to weather this scenario. For example, if US Treasury yields rose another 100 basis points over the next 12 months, they would return around -1.6% through May 2024, compared to -5.1% for an equivalent change in yields from the start of last year.
Why Not Just Hold Cash?
Still, it’s understandable why some investors have soured on government bonds. A consistent question we’ve received since recommending a benchmark neutral position in government bonds in late 2022 is “Why not just hold cash?”
Not only did government bonds disappoint investors recently, but the yield curve is deeply inverted, so cash currently yields more than a ten-year Treasury bond despite having less interest-rate risk! This lowers the opportunity cost of holding cash and increases the likelihood cash outperforms in the short term. The average monthly excess return of ten-year Treasuries over cash is 0.14% when the yield curve is positively sloped, but it is -0.20% when it is negatively sloped.
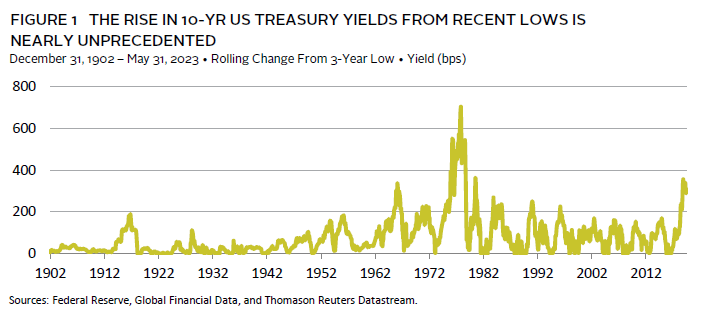
However, there are several factors that suggest Treasuries are likely to do better over the next one to three years. First, US Treasuries are probably oversold. The recent rise in yields is almost unprecedented, with only one instance since 1900 when yields increased by more over such a short period (Figure 1). The supply/demand imbalance in the Treasury market remains a headwind. Increased issuance and waning demand could keep interest rates rangebound in the near term, but their upward momentum appears to be rolling over.
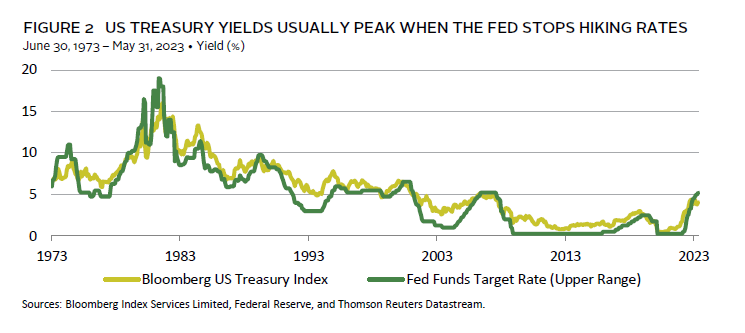
Second, the rise in yields has slowed as both the economic and policy environments have turned more supportive. Last year’s sell-off was driven by a sharp rebound in economic activity and inflation. Economic growth has been considerably weaker this year, and inflation appears to have peaked and is now softening as well. According to consensus forecasts, nominal growth will fall below trend in 2024. In addition, the Fed has telegraphed at recent policy meetings that it is likely near the end of its rate-hiking cycle, which should help limit any further rise in yields. US Treasury yields usually peak around the same time the Fed delivers its last rate hike (Figure 2).
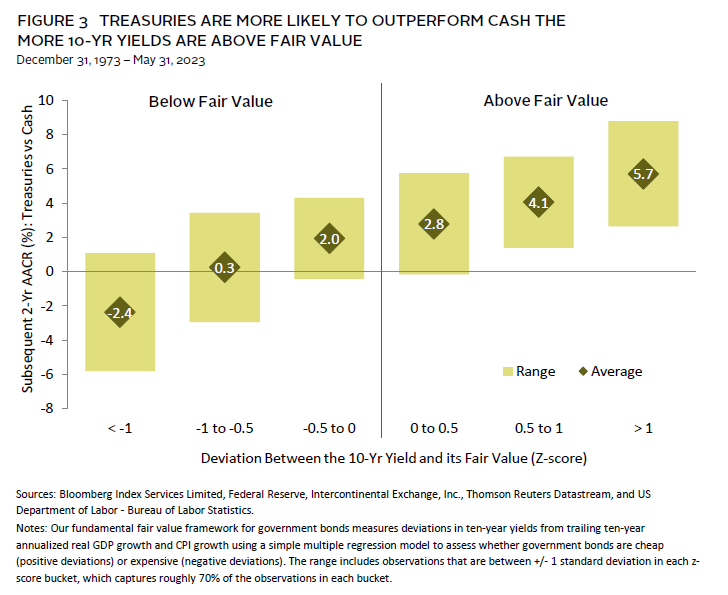
Lastly, US Treasury yields are starting to look more attractive based on our fundamental fair value framework. This model has a strong relationship with future returns and suggests Treasuries are more likely to outperform cash when ten-year yields are above their estimated fair value. Yields have moved lower in recent months, but they remain slightly above fair value, suggesting Treasuries are still a reasonable bet versus cash. If ten-year yields moved back to between 4.0% and 4.5% (i.e., 0.5 to 1.0 standard deviation above fair value), as was briefly the case late last year, then Treasuries would be more likely to outperform cash over the next one to three years (Figure 3).
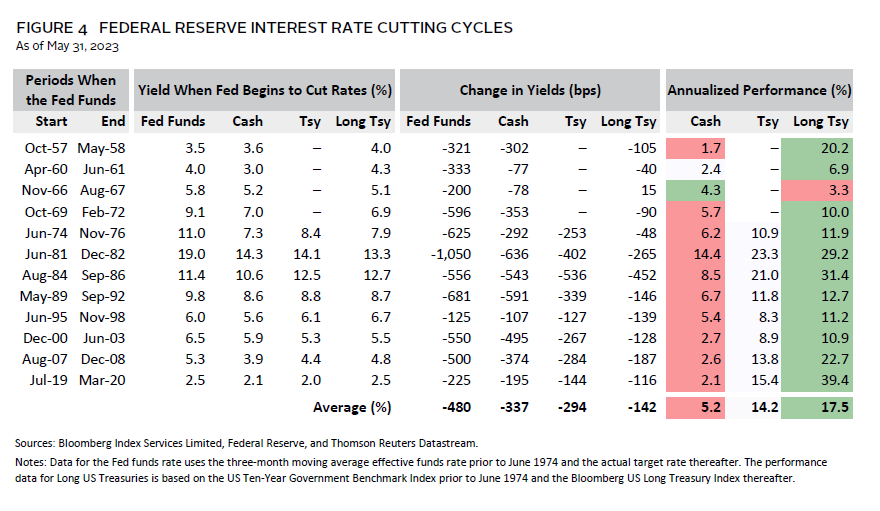
Inflation is still a risk. If it remains elevated the Fed might resume raising rates. However, investors should weigh the risk of investing in government bonds if yields increase versus the reinvestment risk of investing in cash if yields fall sharply. Any additional increase in yields is likely limited, but yields could fall significantly if there is a recession and the Fed cuts rates aggressively (Figure 4). Both cash yields and Treasury yields typically fall in this scenario, and the yield curve steepens. Not only would the reinvestment risk skyrocket as cash yields plummet, but cash would likely fail to provide the same gains as government bonds in the process.
Long Treasuries would likely benefit the most if the Fed cuts rates, given their sensitivity to rates has increased significantly over the previous two decades. Though, inflation uncertainty and the cash drag when the yield curve is inverted are challenges. As such, it’s appropriate to wait to overweight duration until either the yield curve shifts to price in easing or a better entry point with more valuation-upside potential is available.
Is the Bond Bear Coming Out of Hibernation?
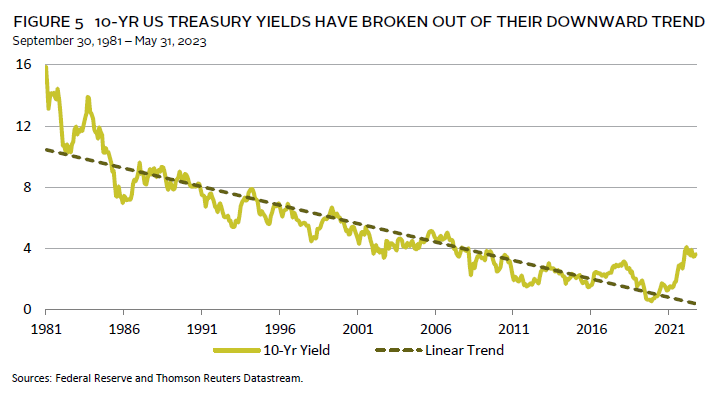
For the previous 40 years, interest rates have been steadily trending lower. Over this period, government bonds have proven to be an excellent counterbalance for equity-heavy portfolios, in absolute terms and relative to cash. However, interest rates have clearly broken out of their long-term downward trend and many investors are wondering whether this is the beginning of a structural bond bear market (Figure 5).
There are similarities between conditions during the previous structural bond bear market, which lasted from 1946 to 1981, and the current macro environment. Both periods were preceded by major global shocks—World War II versus COVID-19 and the war in Ukraine—that resulted in severe supply shortages, pent-up demand, and shifts in economic activity. These and other forces contributed to higher and more volatile inflation and interest rates during the 1946–81 period. It remains unclear if we are entering a similar environment, but if history repeats itself, government bonds’ role as a diversifier will surely be tested.
Between 1946 and 1981, ten-year US Treasury returns were below average, cash outperformed ten-year Treasuries, inflation expectations rose significantly, and stock and bond returns were positively correlated for much of this period. In this environment, Treasuries still provided ballast during major equity sell-offs, but not as consistently as in other periods or compared to cash. Ten-year Treasuries returned 4.5% on average during the eight US equity bear markets that occurred between 1946 and 1981, but they underperformed cash by 3.2% on average and in five out of the eight equity bear markets over this period.
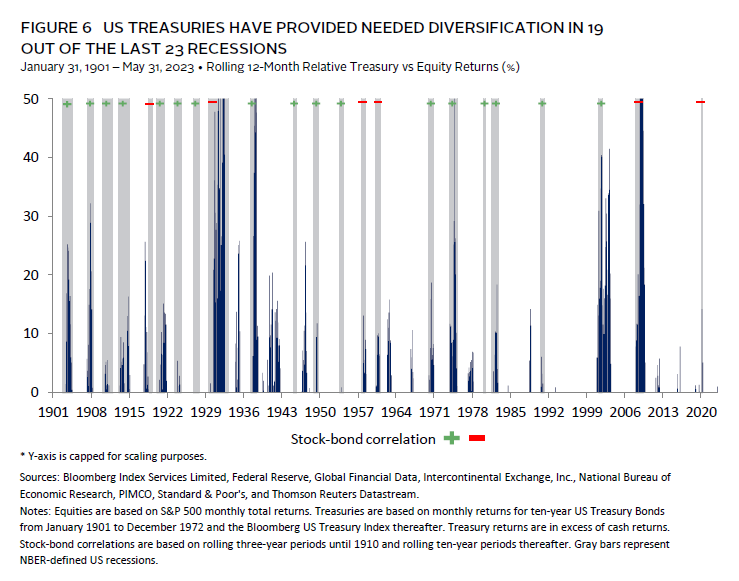
With that being said, history shows that structural trends do not occur in a straight line. Treasuries can still deliver outsized returns relative to cash as the macro cycle turns and interest rates move from higher highs to higher lows. Importantly, US Treasuries have consistently provided needed diversification for equity risk during recessions for more than 120 years, independent of the stock-bond correlation, and even after adjusting for cash returns (Figure 6).
Investment Implications
For investors that typically rely on high-quality government bonds as a counterbalance in equity-heavy portfolios, poor recent performance, higher cash yields, and uncertainty about inflation are difficult hurdles to overcome. However, they are not a reason to underweight government bonds. The outlook for government bonds is more constructive, and we expect them to outperform cash over the next one to three years. US Treasuries, for example, are oversold following last year’s sell-off, their valuations have improved, and both the economic and policy cycles have turned more supportive. Further, cash would likely fail to provide the same ballast as government bonds if there is a recession and the Fed and other central banks cut rates.
A rebound in inflation is the biggest risk to this view, given our concern about structurally higher interest rates. In our view, the potential structural risks do not offset the clear cyclical tailwinds that favor government bonds versus cash over the next one-to-three years. It does, however, warrant caution about overweighting government bonds or extending duration. Therefore, while investors should not underweight high-quality government bonds, before overweighting government bonds or extending duration, they should wait for a better entry point with either more valuation-upside potential or when macro conditions deteriorate further and the yield curve starts to shift.
Index Disclosures
Bloomberg US Long Treasury Index
The Bloomberg US Long Treasury Index measures the performance of US dollar-denominated, fixed-rate, nominal debt issued by the US Treasury with a maturity greater than 10 years. STRIPS are excluded from the index because their inclusion would result in double-counting. The US Treasury Index is a component of the US Aggregate, US Universal, Global Aggregate and Global Treasury Indexes. The US Long Treasury Index has history back to January 1, 1973.
Bloomberg US Treasury Index
The Bloomberg US Treasury Index includes public obligations of the US Treasury with a remaining maturity of one year or more.
Footnotes
- For simplicity, US Treasuries are used as a proxy for high-quality government bonds. Historically, developed markets government bonds in other major local markets (e.g., UK gilts) have been highly correlated with US Treasuries. That said, investors should have a good understanding of conditions in local markets, as differences in the drivers of bond performance across markets can cause performance to diverge over shorter periods and in certain environments.
TJ Scavone - T.J. is a Senior Investment Director in the Capital Markets Research Group at Cambridge Associates.
About Cambridge Associates
Cambridge Associates is a global investment firm with 50+ years of institutional investing experience. The firm aims to help pension plans, endowments & foundations, healthcare systems, and private clients achieve their investment goals and maximize their impact on the world. Cambridge Associates delivers a range of services, including outsourced CIO, non-discretionary portfolio management, staff extension and alternative asset class mandates. Contact us today.