Community Foundations: The Power of Aggregated Capital


Community foundations deliver a range of philanthropic, programmatic, and investment services. They bring together the complexities of private foundations and operating nonprofit organizations. Like universities and cultural and environmental organizations, community foundations lead and serve their local community, fundraise, and deliver programs. Like private foundations, they identify grant-making opportunities and support charitable causes with grants and program-related investments.
Community foundation assets have grown steadily over the years, accumulating a mix of endowment funds and other funds with more expedient spend-down expectations. With the right expertise and attention, the endowment model can be applied to these complex, dynamic assets to differentiate the foundation and deliver on its mission. This paper discusses how community foundations can develop customized investment programs to better support their long-term goals.One of the most important roles of a community foundation is to steward philanthropic assets well. A thoughtful and disciplined investment approach increases the probability of generating higher portfolio returns and amplifies the foundation’s philanthropic impact. The endowment model of investing 1 can deliver on investment and stewardship goals, but the approach requires a deep understanding of risk, liquidity, and investable assets, and may not be the appropriate strategy for all assets under management.
Growth and Competition
The first community foundation (as the term is used today) was established in Cleveland in 1914 by Judge Fredrick Goff. According to the Cleveland Foundation, “Goff envisioned an alternative mechanism for ensuring the honorable and productive use of monies accumulated over and above one’s immediate needs. Endowing such a foundation was a simple and affordable way for individuals of modest to comfortable means to leave a charitable legacy.” Goff recognized that the community’s needs may change, but they would need to be supported in perpetuity. The Cleveland model was replicated throughout the country. For several decades, these young organizations experienced steady growth fueled by relationships with local banks and later financial advisors that directed their clients’ philanthropic assets to local community foundations.
While financial advisors continue to be a source of assets for many community foundations today, wealth owners now have many more options for asset management and philanthropy, changing the way they receive advice, invest, and donate. 2 The development of Donor Advised Funds (DAFs) represents the most drastic change in donor options. DAFs allow donors to set aside funds for charitable purposes and receive an immediate charitable deduction. The funds can be invested and grow tax free, and the donor can recommend how the funds are donated. 3 DAFs may be endowed with the expectation that the capital will support designated causes in perpetuity, or non-endowed where the fund owner expects to distribute all the capital at some point.
While DAFs date back to the 1930s, their astronomical growth began in the early 1990s when commercially sponsored DAFs were introduced. In 2017, four of the top ten charities that raised money primarily from private sources were charitable extensions of commercial asset managers. 4 Community foundations have also received growing levels of DAF contributions. Over the past five years, DAF contributions have nearly doubled to $110 billion, with more than one-third of those contributions going to community foundations in 2017 (Figure 1).
FIGURE 1 TOTAL DAF ASSETS BY SPONSOR TYPES
2013–17 • US Dollar (Billions)
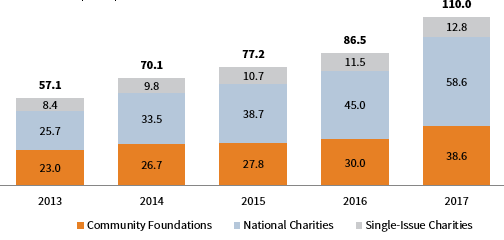
Source: National Philanthropic Trust.
Despite disruption and competition, the largest 100 community foundations have nearly doubled assets under management since 2010 (Figure 2). Some have grown by focusing on their endowments, while others have grown primarily by DAFs. Many, however, have grown through both types of funds, which introduces complexities and opportunities for the community foundation investment model.
FIGURE 2 TOTAL COMMUNITY FOUNDATION ASSETS OVER TIME
2010–17 • US Dollar (Billions)
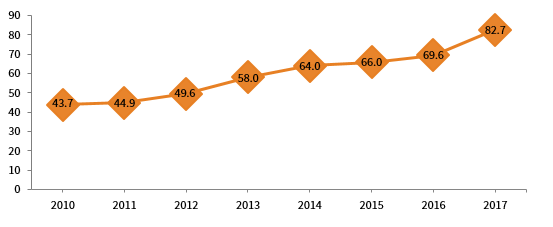
Source: National Philanthropic Trust.
Note: Total assets based on constant universe of 100 largest community foundations by asset size and data availability in the CF Insights Database.
Enterprise Review
As a wise client once told us, “If you know one community foundation, you know one community foundation.” Each has a unique focus on the needs and priorities of its particular community, which translates into a particular mix of assets under management. Implementing a successful investment program requires a customized approach that considers all the philanthropic funds under management, their role in supporting philanthropy and programs, and how they come together in the aggregate. This enables the foundation to provide the advantages of scale and combined activity, so those funds can do more together under the foundation’s umbrella than they could do separately. An investment strategy that employs the endowment model can differentiate a community foundation in a vast landscape of options available to donors. This strategy may include a mission-related investment lens. It may also be integrated with philanthropic programs, such as program-related investments (PRIs) and place-based investments, such as opportunity zones.
Given that each organization brings a unique combination of circumstances, the development of the optimal investment program starts with an enterprise review. This provides a deeper understanding of a foundation’s assets, fundraising flows, and the role the investment assets play in supporting the mission. These factors frame the portfolio’s risk and liquidity, which are then reflected in investment policy and implemented in portfolio construction.
To illustrate the importance of an enterprise review in optimizing an investment program, we created a representative community foundation with $500 million in assets under management. We named it Greater Community Foundation (GCF) and based it on our prior engagements with this type of organization.
Investable Assets
GCF has a combination of investable assets under management, which includes permanent capital and more dynamic non-endowed DAFs that may be spent down over various time horizons (Figure 3).
FIGURE 3 INVESTABLE ASSET COMPOSITION
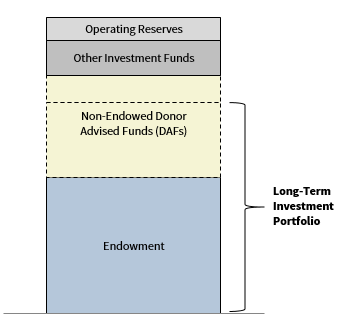
Source: Cambridge Associates LLC.
GCF has placed all the endowment funds and the majority of non-endowed DAFs in the long-term investment portfolio (LTIP). Non-endowed DAFs introduce additional layers of complexity, as they often come with high transaction volume, different time horizons, and irregular cash flows. The strong relationship between GCF’s finance and development staff and donors has allowed the foundation to make reasonable assumptions on future spending from these non-endowed DAFs, and therefore their suitability in the LTIP.
The foundation also has some investment funds outside of the LTIP because they do not fit with the long-term strategy. Operating funds outside of the LTIP may be a source of liquidity that can provide some ballast for LTIP spending in times of market stress.
Net Flow Rate
Given dynamic fundraising and philanthropic activity at community foundations, spending is just one piece of the investment puzzle. As an aggregator of assets, the foundation needs to look across these assets and evaluate the total net flow rate, which measures all the inflows to and outflows from the portfolio, exclusive of performance. Net flow captures spending, such as grant-making and administrative fees, as well as new donations made to the foundation. The aggregate net flow rate provides a more robust profile of how the funds function and their liquidity needs.
For GCF, the aggregate net flow rate has averaged 0% over multiple years, meaning that total inflows typically match total outflows (Figure 4). This neutral level of flows has been driven by non-endowed DAFs, where inflows have exceeded outflows each year. So, while these non-permanent funds could be depleted at a rate that exceeds the foundation’s endowment spending policy, this has not been the experience at GCF. Understanding the extreme case of what net flow could be and balancing that extreme scenario versus actual experience and rational expectations is an important input into GCF’s financial and investment policy setting.
FIGURE 4 TOTAL LONG-TERM INVESTMENT PORTFOLIO NET FLOW RATE
2014–18
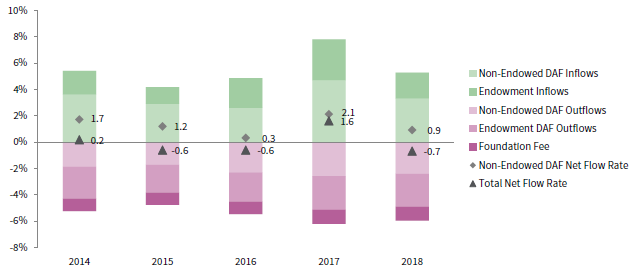
Source: Cambridge Associates LLC.
Once truly short-term philanthropy has been set aside, community foundations often find that the aggregate portfolio of funds is aligned with a long-term investment strategy, because spending is matched by fundraising. This provides a level of stability for investment assets and indicates that liquidity requirements do not constrain investment policy. The foundation’s portfolio is in an advantageous position where spending needs are matched or exceeded by inflows of new funds, so the investment portfolio can take on more illiquidity to achieve return objectives.
Endowment Dependence
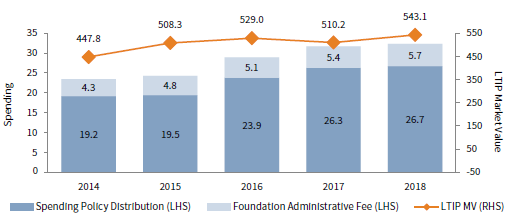
Spending from the community foundation’s investment portfolio comes in two forms: philanthropy and the administrative fee applied to assets under management, which funds the foundation administration and programs. In the enterprise review we study how the portfolio supports both mission-critical activities to understand the foundation’s risk tolerance and spending expectations. For GCF, the long-term investment portfolio growth over the past five years has led to more portfolio spending, which has grown 30% (Figure 5).
FIGURE 5 LONG-TERM INVESTMENT PORTFOLIO SPENDING
2014–18 • US Dollar (Millions)
Source: Cambridge Associates LLC.
In the enterprise review, we ask: Does higher dependence on spending constrain the investment strategy? What is the foundation’s tolerance for fluctuations in the level of support? Implementing an investment program that results in volatility in the pursuit of higher return could impact the administrative fee revenue and the effective spending rate needed to maintain grant funding levels. Before adopting any changes to the investment policy, GCF needs to understand the impact of any shifts in the portfolio’s investment profile.
The enterprise review establishes the key links between the dynamic community foundation enterprise and the investment portfolio so that enterprise factors are incorporated into the investment process. This information can help the investment committee and management align the investment program and the foundation to determine if the policy needs to be adjusted to accommodate changes as they evolve.
Crafting the Optimal Long-Term Investment Program
Insights from the GCF enterprise review have indicated that the foundation is positioned to implement a more diversified portfolio that is expected to deliver higher returns. While the foundation has a substantial level of non-endowed funds, those funds behave like long-term capital because of strong fundraising that replenishes fund levels each year. The foundation can thus grow assets and offer donors a risk-appropriate, competitive return on their philanthropic funds. Optimizing the endowment investment offering further distinguishes the foundation from competitors.
To capitalize on this profile, GCF intends to follow recommendations to increase the allocation to equities and reduce the allocation to fixed income and cash. The recommended portfolio’s greater emphasis on private investments and increased overall diversification provide stronger return expectations on an absolute and risk-adjusted basis. Therefore, it is more likely to preserve purchasing power and grow market value over time. These shifts also increase the anticipated volatility and illiquidity of the portfolio (Figure 6).
FIGURE 6 EFFICIENT FRONTIER PORTFOLIOS AND THEIR ALLOCATIONS
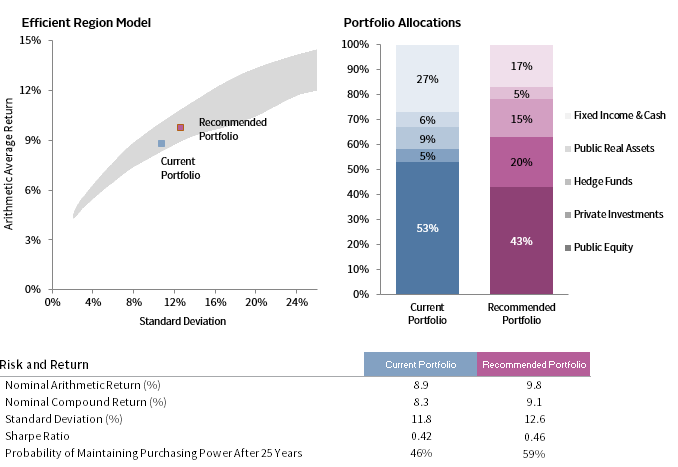
Source: Cambridge Associates LLC.
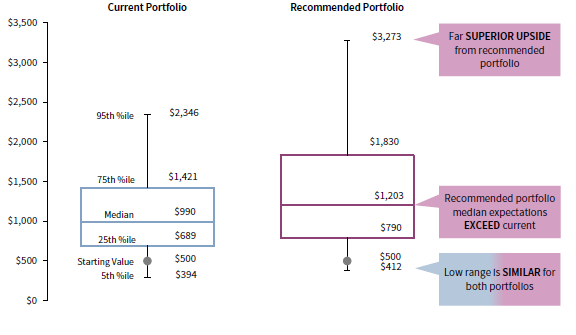
The stronger return expectations associated with the more diversified portfolio may translate into greater performance over the long term. For instance, the initial $500 million portfolio may have a market value of $1.2 billion in 25 years, according to the median result in a Monte Carlo simulation and assuming a 5.5% annual spend rate (Figure 7). The recommended portfolio is expected to outperform more significantly in higher return environments (depicted in 75th and 95th percentile expectations). In lower return market environments (shown as 25th and 5th percentile investment performance), the recommended portfolio delivers comparable downside performance.
FIGURE 7 RANGE OF PROJECTED MARKET VALUES IN 25 YEARS (5.5% SPENDING POLICY)
US Dollar (Millions)
Source: Cambridge Associates Spending and Shortfall Model.
Note: Please see disclosures for more details.
Understanding Stress – Portfolio Enterprise Risk Model
Before embarking on the recommended portfolio, GCF wants to have a keen understanding of how the new liquidity profile and potential investment risk would affect the enterprise. This involves analyzing how the recommended LTIP may behave in different market scenarios and understanding how market stress could impact the portfolio’s ability to support annual foundation operations, programs, and grant-making. 5
In the following analysis, we have simulated how a stress scenario would impact the recommended portfolio using the Cambridge Associates Portfolio Enterprise Risk (PER) model. The Stress Scenario simulates the returns for each asset class based on performance during and following the global financial crisis (Figure 8).
FIGURE 8 STRESS SCENARIO ANNUAL INVESTMENT RETURNS
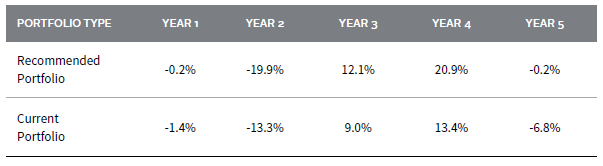
Source: Cambridge Associates LLC.
As the PER analysis indicates, the recommended portfolio would experience a significant decline during a short-term market downturn, but it would capture higher returns when the markets recovered. The simulation also stresses net flows to the portfolio in two ways. First, the foundation decides to maintain its level of grant-making to help grantees weather financial challenges, despite the fact that the effective spending rate will exceed its policy target. We have seen this increased commitment play out at many foundations during economic downturns. Second, the simulation cuts the foundation’s fundraising achievement level in half, so the rate in which new capital is added to the portfolio is 2.5%.
Our analysis focuses on four important outcomes of the stress simulation:
- The effective spending from the portfolio;
- The level of budget that the levied administrative fees on the portfolio will cover;
- The market value of the LTIP; and
- Liquidity of the LTIP.
GCF has a typical spending policy of 5% (of a 12-quarter market value), and the foundation also assesses a 0.5% administrative fee to assets in the LTIP. Under long-term performance expectations, as modeled in Figure 6, market value growth would enable the foundation to increase spending on grant-making and administrative fees. But the foundation should understand that if markets crumble, the market value of the portfolio could fall, forcing it to adopt a higher effective spend rate if it wants to maintain grant spending levels. GCF experienced this in the stress scenario (Figure 9). In Year 3, effective spending on the reduced market value climbed to 7.2%. By Year 5, the foundation was spending $4.3 million beyond spending policy to maintain $25 million grant commitments.
FIGURE 9 STRESS SCENARIO IMPACT ON SPENDING RATE AND ANNUAL LTIP OUTFLOWS
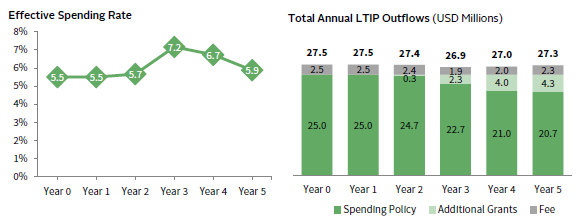
Source: Cambridge Associates Portfolio Enterprise Risk Model.
Note: Please see disclosures for more details.
The nominal value of the endowment starts to rebound in Year 3, but with constrained fundraising and muted returns in Year 5, spending outpaces growth and results in further deterioration of endowment value (Figure 10). While the foundation would have lost market value in this short-term period, liquidity would not have been a concern. Our analysis shows that even after the stress period, the portfolio maintains sufficient liquidity to meet several years of spending.
FIGURE 10 FIVE-YEAR CONTRIBUTION TO CHANGE IN MARKET VALUE AND PORTFOLIO LIQUIDITY
US Dollar (Millions)
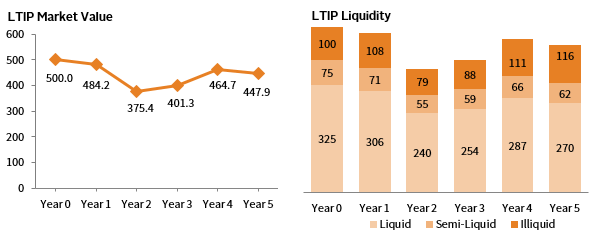
Source: Cambridge Associates Portfolio Enterprise Risk Model.
Note: Please see disclosures for more details.
To evaluate whether the recommended investment portfolio is a good fit, the foundation’s staff, investment committee, and board need to assess whether they are comfortable with the potential portfolio losses and levels of spending presented by a stress scenario. They will also need to consider whether the foundation will maintain grant funding (as modeled) or even grow grant funding in an economic downturn. While an investment policy’s focus is long term, it needs to be able to withstand difficult short-term periods. Ultimately, GCF embraces the recommended portfolio, given the thorough analysis of the enterprise, long-term performance expectations, and the stress scenario results.
ENDNOTES
Hypothetical Performance Disclosure
This publication contains hypothetical performance. Hypothetical performance results have many inherent limitations, some of which are described below. There are frequently sharp differences between hypothetical performance results and the actual results subsequently achieved by any particular investment program. Hypothetical results do not involve financial risk, and no hypothetical record can completely account for the impact of financial risk in actual investing. For example, the ability to withstand losses or to adhere to a particular investment program in spite of losses are material points, which can also adversely affect actual performance results. There are numerous other factors related to the markets in general or to the implementation of any specific investment program, which cannot be fully accounted for and all of which can adversely affect actual results.
Projected Performance Disclosure
Figures 6 and 7 are based on CA’s long-term equilibrium return and standard deviation assumptions and can be unstable over shorter time periods. Projections are based on a portfolio composed of the allocations shown in the figure, rebalanced annually, using CA’s long-term equilibrium assumptions, which include return, volatility, and correlation for each asset class. Projected returns are based on the median of expected total portfolio return outcomes over the long term (20+ years). Projected market values use these same investment assumptions with the added variable of 5.5% annual spending. The probability of maintaining purchasing power represents the probability that, at the end of a 25-year period, the portfolio will have a real market value greater than or equal to the starting $500 million level based on a Monte Carlo simulation using these assumptions.
Portfolio Enterprise Risk Model Disclosure
Modeling in Figures 7, 9, and 10 uses portfolio allocations shown in Figure 6, rebalanced annually. Private investments are not rebalanced and are assumed to have neutral cash flows (capital calls equal to distributions) each year. All exhibits correspond to a stress scenario, which includes: index returns from July 1, 2007 through June 30, 2012; grant-making of 5.0% of three-year average market value, with additional spending if total grants fall short of $25 million; administrative fee of 0.5% of beginning market value for the year; annual gifts equal to 2.5% of portfolio market value, half of what would be expected under healthy market conditions.
Footnotes
- The endowment model is anchored to four core principles: equity bias, diversification, use of less-liquid or complex assets, and value-based investing. For more about this style of investing, please read Mary Cove and David Thurston, “The Endowment Model 2.0: A Success Story That Endures,” Cambridge Associates Research Report, November 2013.
- Kevin K. Murphy, “Community Foundation Business Model Disruption in the 21st Century,” Council on Foundations, 2016.
- See Ray Madoff, “When Is Philanthropy?: How the Tax Code’s Answer to This Question Has Given Rise to the Growth of Donor-Advised Funds and Why It’s a Problem,” in Reich, Cordelli, and Bernholz, Philanthropy in Democratic Societies, University of Chicago Press, 2016.
- Brian O’Leary and Peter Olsen-Phillips, “How Much America’s Biggest Charities Raise: 27 Years of Data,” The Chronicle of Philanthropy, October 31, 2017.
- This example is for illustrative purposes to impose stress on the policy portfolio and evaluate results. Each community foundation should review their past grant-making and fundraising results, particularly during the global financial crisis, to develop custom assumptions.
Nita Patel, CFA - Nita Patel is a Managing Director for the Endowment & Foundation Practice at Cambridge Associates.
Michael Pearce - Mike Pearce is a Managing Director for the Endowment & Foundation Practice at Cambridge Associates.
About Cambridge Associates
Cambridge Associates is a global investment firm with 50+ years of institutional investing experience. The firm aims to help pension plans, endowments & foundations, healthcare systems, and private clients achieve their investment goals and maximize their impact on the world. Cambridge Associates delivers a range of services, including outsourced CIO, non-discretionary portfolio management, staff extension and alternative asset class mandates. Contact us today.