A Summary of Climate Change Science for Investors

We are investors, not scientists; however, investors would be wise to consider climate science in their investment decision-making process. Climate risk is likely underestimated by financial markets, and there is a window of opportunity for investors to get ahead of the curve, given our expected future repricing of this risk. This paper provides a high-level overview of the current climate science and discusses a few economic implications. Put simply, we all need to think like scientists now.
Global temperatures are rising at an accelerating rate. The global average temperature in 2018 was about 1.0°C more than pre-industrial levels, as seen in Figure 1. Increased concentration of carbon dioxide (CO2) in the atmosphere – due to the burning of fossil fuels – is a primary driver of this temperature rise. Warming greater than the global average is occurring in many regions, including the Arctic, where it is rising two to three times quicker. Warming has also happened twice as fast over land than over the ocean. 1
FIGURE 1 DEVIATION FROM THE GLOBAL MEAN SURFACE TEMPERATURE ESTIMATES BASED ON LAND AND OCEAN DATA
1880–2018 • Degrees Celsius (°C)
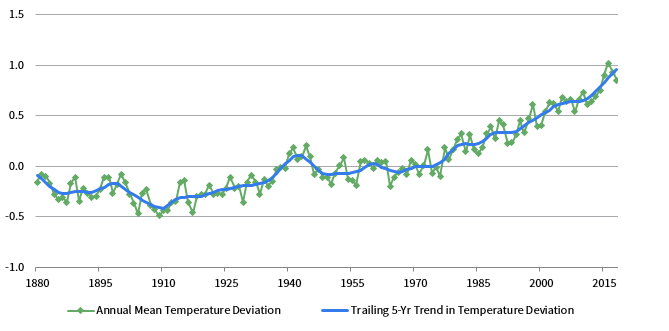
Source: NASA Goddard Institute for Space Studies.
Studies of gas composition inside ancient Arctic and Antarctic ice cores reveal that something as complex as global temperature can be related to just a single variable – the level of atmospheric CO2. 2 In fact, for roughly 800,000 years, until about 150 years ago, CO2 levels and temperatures have varied together (Figure 2).
FIGURE 2 CARBON DIOXIDE LEVELS AND TEMPERATURES OVER TIME AS REVEALED BY ANALYSIS OF ANTARCTIC ICE CORES
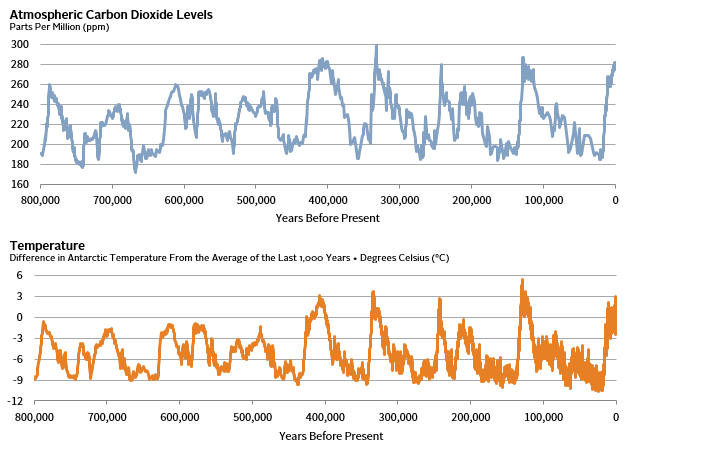
Sources: Jouzel et al. (2007), Lüthi et al. (2008), National Centers for Environmental Information (NCEI), National Environmental Satellite, Data, and Information Service (NESDIS), National Oceanic and Atmospheric Adminitration (NOAA), and US Department of Commerce. See additional sourcing notes below.
The lowest CO2 levels consistently corresponded with the ice ages, while higher levels coincided with stable temperate periods, including the 12,000 years since the last ice age, when our civilisation developed. If we add the last 150 years of atmospheric carbon levels to this ice core data, we see a sharp upward break in atmospheric CO2 levels (Figure 3).
FIGURE 3 AVERAGE CARBON DIOXIDE LEVELS OVER THE PAST 800,000 YEARS
Parts Per Million (ppm)
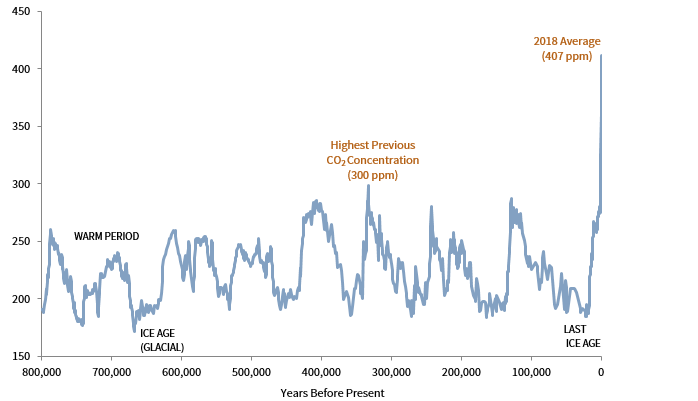
Sources: Climate.gov, Jouzel et al. (2007), Lüthi et al. (2008), National Centers for Environmental Information (NCEI), National Environmental Satellite, Data, and Information Service (NESDIS), National Oceanic and Atmospheric Administration (NOAA), and US Department of Commerce.
Note: Data are through September 2019.
Since 1950, CO2 levels have soared by more than a third to more than 400 parts per million, driven by the burning of fossil fuels. This recent addition is more than the entire difference in atmospheric CO2 between the last ice age 3 – when ice almost two miles thick covered North America from the Canadian Arctic to Missouri – and the recent stable climate period. 4 More than 50% of the CO2 added by humans to the atmosphere was put there since 1990 alone. 5
The 2018 Intergovernmental Panel on Climate Change (IPCC) report compares two global temperature scenarios: a 1.5°C and a 2°C increase in global temperatures. 6 Both scenarios suggest material consequences in the coming decades, such as flooding of coastal cities and disruption to agriculture. They also predict effects that will last thousands of years, regardless of future progress in halting emissions. For example, multi-metre rises in sea levels over hundreds or thousands of years could result in either scenario. The fact that many of climate change’s consequences have been set in motion already, regardless of future emissions levels, means that unlike the global financial crisis, these effects will not mean revert on any timescale of relevance to investors.
A weakness of the IPCC report is that temperatures may rise more than 2°C, with business as usual scenarios predicting uncontrolled heating in excess of 4°C this century. To have a 50% chance of keeping the temperature change below 1.5°C, the IPCC report states, ten years of current emission levels would need to be budgeted as mankind’s entire future net emissions. To have a high chance of limiting temperature rises to 1.5°C or 2°C, global emissions would have to fall to net zero fast, beginning by halving in a decade (Figure 4).
FIGURE 4 STYLISED NET GLOBAL CO2 EMISSION PATHWAYS
1960–2100 • Billion Tonnes CO2 Per Year
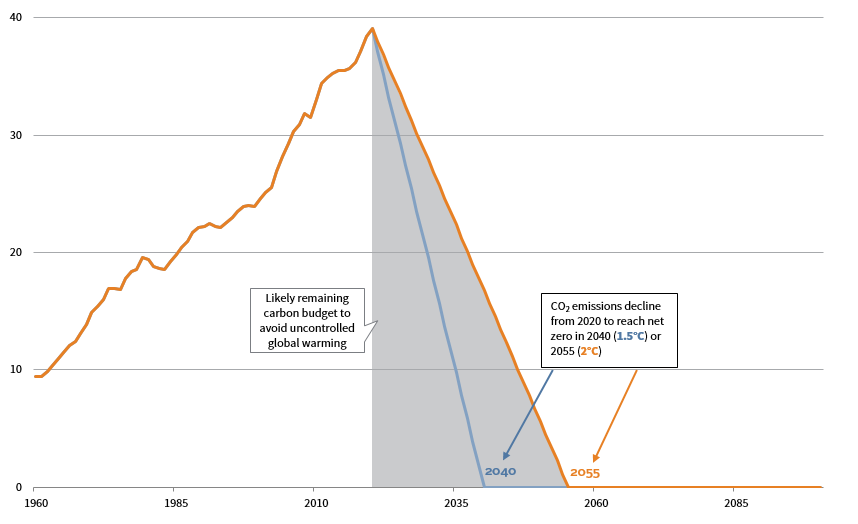
Sources: Carbon Dioxide Analysis Centre (CDIAC), Global Carbon Project, IPCC, and Le Quéré et al. (2018). See additional sourcing notes below.
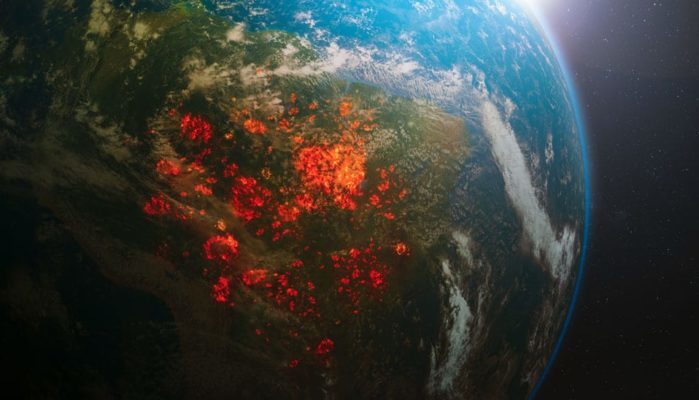
The challenge shown by Figure 4 is sobering. However, some climate science experts regard the IPCC’s data as too conservative. Some note the potential impact of self-reinforcing feedback loops, or tipping points, such as the loss of reflective white sea ice allowing the ocean to absorb more heat, 7 or the potential release of large amounts of methane – a much more potent greenhouse gas than CO2 – from melting surface permafrost on land 8 and the Arctic seabed. 9 In summer 2019, record high temperatures contributed to a totally unprecedented scale of wildfires in Arctic regions, releasing more CO2. During June 2019 alone, it is estimated these fires released 50 megatons of CO2 into the atmosphere – as much as Sweden emits in a year. 10
Compare this statement from the IPCC report: “With 1.5°C of global warming, one sea ice–free Arctic summer is projected per century” with Figure 5, which shows actual post-summer Arctic sea ice volume from 1979 through September 2019. In contrast to the IPCC report, which was released just a year ago, the data presented in Figure 5 suggest we may be moving rapidly to an ice-free Arctic in the summer as the norm.
FIGURE 5 POST-SUMMER (SEPTEMBER) ARCTIC SEA ICE VOLUME
1979–2019 • (10³km³)
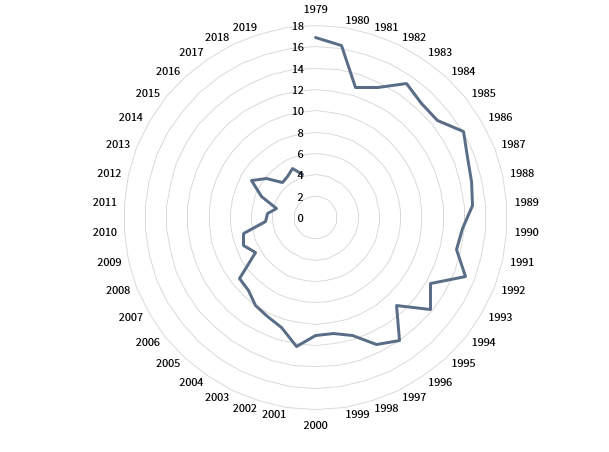
Source: University of Washington – Polar Science Center.
Although more than 75% of the Arctic’s post-summer ice has melted without sea levels rising materially, ice melting remains important. 11 Unlike in Antarctica, there’s no land at the North Pole. Instead, the ice floats in the sea. Sea ice melting does not raise sea levels, since the volume of water it displaces as ice is the same as the volume of water added to the ocean when it melts. Rather, the pace of sea ice melting is a warning about potential land ice melting, which does raise sea levels. According to the National Snow and Ice Data Center, the Antarctic and Greenland ice sheets alone contain enough ice to raise sea levels by 66 metres!
While multi-metre sea-level rises may take hundreds of years, sea levels are rising at an accelerating pace, 12 due to land ice melting and the simple fact that seawater expands as it warms, 13 which it is doing at an accelerating rate. Figure 6 shows these trends. Though Arctic sea ice continues to reach record lows as discussed, 14 the Antarctic is a much larger body of ice and had been much more stable through the vagaries of global climate. However, a recent study 15 shows a worrying threefold increase in the pace of Antarctic melting and the contribution of this to rising sea levels since 2012 versus the prior period. Additionally, Greenland has seen record-breaking land-ice melt in 2019. 16
FIGURE 6 RECENT OCEAN TRENDS: HOTTER AND HIGHER
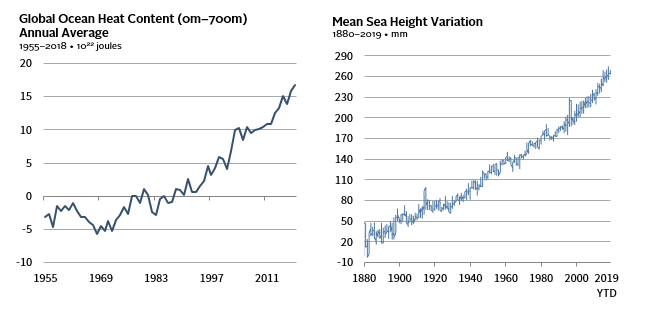
Sources: Church and White (2011), Commonwealth Scientific and Industrial Research Organisation (CSIRO), NASA Physical Oceanography Distributed Active Archive Center, and NOAA National Centers for Environmental Information. See additional sourcing notes below.
Note: For mean sea height variation chart, ground data are from 1870–1993 and satellite data are from 1993–present; satellite data include more observations than ground data.
One recent study suggests that sea levels may rise 65 centimetres by 2100. 17 While a rise of that magnitude is enough to materially impact many coastal cities, the authors of the study acknowledge their estimate is almost certainly too conservative, since it does not factor in further acceleration that new changes to ice sheets imply. A 2019 IPCC study estimates a 60- to 110-centimetre rise in sea levels if greenhouse gas emissions continue rising. 18 High-tide flooding frequency across the United States has already hit all-time records as increasing sea levels combine with more frequent and intense storms and resulting surges. Flooding occurs at twice the rate of just 30 years ago, with Boston among the locations seeing a new record in 2017, with 22 days of high-tide flooding. The rising risk of flooding is already affecting coastal real estate prices in the United States. 19 Looking longer term, a study in 2018 estimated that by 2045 (less than the term of a typical mortgage), 300,000 homes and commercial properties in the United States, worth $136 billion, will be at risk of chronic flooding. By 2100, the number of properties at risk rises to 2.4 million, worth US$1.1 trillion. 20 Globally, an Allianz study estimated that US$25 trillion to US$28 trillion of assets in port megacities would be exposed by a sea-level rise of half a metre. 21
According to the National Oceanic and Atmospheric Administration (NOAA), 2017 and 2018 saw the hottest oceans on record by some margin, and at least half of the ocean warming since 1865 has occurred in the last two decades. Weather is complex, but, all other factors being equal, warmer waters make hurricanes more intense with stronger winds and heavier rainfall. 22 The rising temperature of the Atlantic matters if you are investing in parts of the United States at risk of hurricane damage.
Extreme weather events more generally (e.g., droughts, extreme rainfall, flooding, storm surges from the sea, and extreme hot and cold periods) are rising in frequency and severity. Consequences are already being felt by financial markets. The record cost of US natural disasters in 2017 reached $306 billion. 23 Government data show that costly weather- and climate-related disaster frequency is trending upwards, after adjusting for inflation (Figure 7).
FIGURE 7 NUMBER OF US INFLATION-ADJUSTED BILLION-DOLLAR WEATHER AND CLIMATE DISASTERS PER YEAR
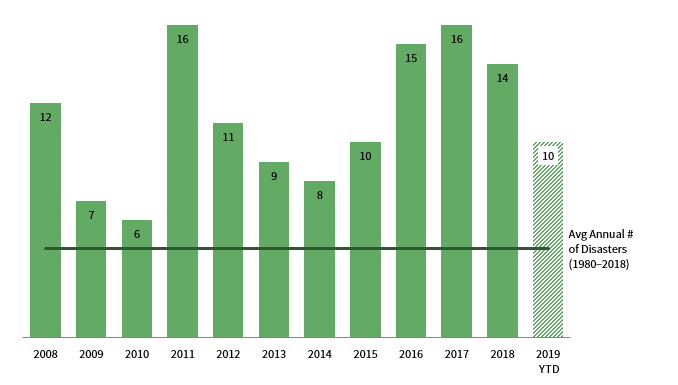
Source: NOAA National Centers for Environmental Information.
Note: Data for 2019 are as of September 30, 2019.
Regardless of differences in longer-term projections from different studies, the influence of climate change is now clear. The 20 warmest years on record have occurred in the past 22 years, with the past four years as the hottest, 24 and 2019 is on course to join these four and likely surpass them all.
Key Implications for Investors
Many studies have attempted to quantify the financial cost of different climate-change scenarios, which can help make the science relevant and actionable to investors. As long as the previous global CO2 emissions noted in Figure 4 is trending up and not down, it is prudent for investors to focus on scenarios based on temperature rises at the higher end of considered ranges when making asset allocation decisions, since this direction is where the climate is heading.
Figure 4 also gives a clear message to long-term investors. The shaded triangle from 2019 onward represents our likely total remaining carbon budget to avoid uncontrolled global warming. Perhaps efforts to curb emissions will be successful, but many will conclude that such drastic cuts in carbon emissions will not occur in the coming decades. Therefore, physical risks threatening asset values will keep increasing. On the other hand, any regulatory or technological response against CO2 to force emissions down successfully will increase transition risk on a very wide range of fossil fuel–producing and carbon-emitting assets (Figure 8).
FIGURE 8 PHYSICAL AND TRANSITION RISKS TO PORTFOLIOS OVER THE NEXT 1–30 YEARS
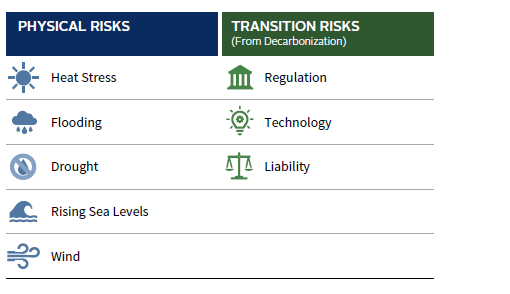
Source: Cambridge Associates LLC.
Either way, increased climate risk is inevitable. Many commentators, such as Bank of England Governor Mark Carney, have discussed future physical shocks and asset-price collapses that may accompany an acceleration in regulation against carbon assets. 25 There are also opportunities to invest in the transition to a low-carbon economy, but for most asset allocations, the likely impact of climate change is skewed to the downside.
Carbon is everywhere. One study pointed out that known fossil fuel reserves exceed the remaining global carbon budget by around five times, meaning that 80% of these reserves would be un-burnable in a scenario limiting temperature rises to 2°C. 26 This means there could be up to US$7 trillion of stranded upstream fossil fuel assets. 27 This concept is now reasonably well known. However, when expanded downstream to include electricity generation, industrials, and real estate, the same study estimated that the current value of stranded assets could rise to US$20 trillion. Beyond the energy sector, carbon emissions from the production of basic materials like steel, cement, plastics, and aluminum alone may exceed the entire carbon budget to meet the 2°C global emission reduction target on current trends. 28 Potential transition risks are therefore more widespread than in just fossil fuel–producing assets, meaning investors should consider the risks climate change presents to their entire portfolios.
The good news is that investment opportunities aimed at solutions are rapidly emerging. The cost of energy supplied by renewable and other clean technologies has now fallen below fossil fuels in most countries without subsidies. For example, a new study has shown that roughly three quarters of US coal-based power production is more expensive than local wind and solar alternatives, despite considering just the marginal operating cost for existing coal plants versus the all-in costs (operating and capital expenditure) for new renewables. 29 In other words, it would be cheaper to shut down the coal plants and build renewable alternatives from scratch. A new study by International Renewable Energy Agency (IRENA) similarly shows how new solar photovoltaic and onshore wind will increasingly be cheaper than the marginal operating cost of existing thermal power plants on a global scale. 30 This relationship now holds true even when adding in battery storage costs to deal with renewable power intermittency. Bloomberg’s 2019 New Energy Finance Report sees global power production shifting from two-thirds fossil-fuel power in 2018 to two-thirds zero-carbon power by 2050. 31 This shift implies that 77% of new investment into power generation will go towards zero-carbon power production over this time. Similar to the energy sector, innovations are also occurring in transportation, agriculture, and industry.
Conclusion
Climate change sciences tells us increased investment risk is now inevitable on a timescale of relevance to most asset owners. As a result, we believe climate change should be a key factor that all long-term investors consider. Currently, risks linked to these changes outweigh opportunities, and we believe their potential impact is likely underestimated by financial markets. Investors who add this new risk dimension to their asset allocation and manager selection process are likely to be better positioned than those that do not, even if it is not clear how climate change will occur. ■
Additional Sourcing Notes
Figure 2: NOAA National Centers for Environmental Information, using original data from Jouzel et al. 2007 and Lüthi et al. 2008.
Figure 4: Figure SPM.1 (b) from the Summary for Policymakers in IPCC, 2018: Global Warming of 1.5°C. [Masson-Delmotte, V., P.Zhai, H.O. Pörtner, D. Roberts, P.R. Shukla, J. Skea, A. Pirani, Y. Chen, S. Connors, M. Gomis, E. Lonnoy, R. Matthews, W. Moufouma-Okia, C. Péan, R. Pidcock, N. Reay, M. Tignor, T. Waterfield (eds.)]. Word Meteorological Organization, Geneva, Switzerland.
Figure 6: Levitus, S., J. I. Antonov, T. P. Boyer, O. K. Baranova, H. E. Garcia, R. A. Locarnini, A.V. Mishonov, J. R. Reagan, D. Seidov, E. S. Yarosh, M. M. Zweng, 2012: World Ocean heat content and thermosteric sea level change (0-2000 m) 1955-2010. Geophys. Res. Lett., 39, L10603, doi:10.1029/2012GL051106 and/or ‘from the NOAA National Centers for Environmental Information.’
Footnotes
- Please see Masson-Delmotte, V., P. Zhai, H.-O. Pörtner, D. Roberts, J. Skea, P.R. Shukla, A. Pirani, W. Moufouma-Okia, C. Péan, R. Pidcock, S. Connors, J.B.R. Matthews, Y. Chen, X. Zhou, M.I. Gomis, E. Lonnoy, T. Maycock, M. Tignor, and T. Waterfield (eds.), ‘Summary for Policymakers. In: Global Warming of 1.5°C. An IPCC Special Report on the impacts of global warming of 1.5°C above pre-industrial levels and related global greenhouse gas emission pathways, in the context of strengthening the global response to the threat of climate change, sustainable development, and efforts to eradicate poverty, IPCC, 2018.
- Please see Holli Riebeek, ‘The Carbon Cycle,’ Nasa Earth Observatory, 16 June 2011.
- The shift in the Earth’s orbit that will prompt the next ice age is well understood, and will occur in about 30,000 years, so this is not on a timescale to counteract man-made climate change.
- According to the World Meteorological Organization, the 2017 level of CO2 in the atmosphere is now 146% of pre-industrial levels.
- Please see ‘Carbon Majors: Update of Top Twenty Companies 1965–2017,’ Climate Accountability Institute, October 9, 2019.
- The Intergovernmental Panel on Climate Change (IPCC) is the key body of the United Nations providing governments with scientific information they can use to develop climate policies.
- Please see Peter Wadhams, A Farewell to Ice: A Report from the Arctic (New York: Oxford University Press, 2017).
- Please see Christian Knoblauch et al., ‘Methane Production as Key to the Greenhouse Gas Budget of Thawing Permafrost,’ Nature Climate Change, Vol 8, no. 4 (April 2018): 309–12.
- Please see Natalia Shakhova et. al., ‘Extensive Methane Venting to the Atmosphere from Sediments of the East Siberian Arctic Shelf,’ Science, vol 327, no. 5970 (5 March 2010): 1,246–50.
- ‘Unprecedented Wildfires in the Arctic,’ World Meteorological Organization, 12 July 2019.
- According to NASA, sea levels have risen, on average, by around 24 centimetres globally since 1880, but 9 centimetres of this is since 1993 alone.
- ‘Global Climate Change: Vital Signs of the Planet,’ NASA website, https://climate.nasa.gov/vital-signs/sea-level/; Note how the accurate post-1993 satellite data shows a marked acceleration versus the older tidal gauge measurements since 1980.
- Please see Patrick Lynch and Katie Weeman, ‘New Study Finds Sea Level Rise Accelerating,’ NASA, 13 February 2018.
- ‘The State of the Global Climate,’ World Meteorological Organization, https://library.wmo.int/doc_num.php?explnum_id=5789.
- Please see Andrew Shepherd et al., ‘Mass Balance of the Antarctic Ice Sheet from 1992 to 2017,’ Nature International Journal of Science, vol 558, no. 7709 (14 June 2018): 219–22.
- Please see Meilan Solly, ‘Greenland Lost 12.5 Billion Tons of Ice In One Day,’ Smithsonian Magazine, 5 August 2019.
- Please see Patrick Lynch and Katie Weeman, ‘New Study Finds Sea Level Rise Accelerating,’ NASA, 13 February 2018.
- ‘Choices Made Now are Critical for the Future of our Ocean and Cryosphere,’ IPPC, 25 September 2019.
- For more information please see ‘Rising Seas Swallow $403 Million in New England Home Values,’ First Street Foundation website, https://firststreet.org/press/rising-seas-swallow-403-million-in-new-england-home-values/.
- For more information please see ‘Underwater: Rising Seas, Chronic Floods, and the Implications for US Coastal Real Estate,’ Union of Concerned Scientists, 18 June 2018.
- ‘Major Tipping Points in the Earth’s Climate System and Consequences for the Insurance Sector,’ Allianz and World Wide Fund for Nature, November 2009.
- Please see ‘Could climate change make Atlantic hurricanes worse?,’ Climate.gov, 29 May 2019.
- Please see ‘2017 U.S. billion-dollar weather and climate disasters: a historic year in context,’ Climate.gov, 8 January 2018.
- ‘WMO Statement on the State of the Global Climate in 2018,’ World Meteorological Organization, 2019.
- ‘Open letter on climate-related financial risks,’ Bank of England website, 17 April 2019, https://www.bankofengland.co.uk/news/2019/april/open-letter-on-climate-related-financial-risks.
- ‘Unburnable Carbon: Are the world’s financial markets carrying a carbon bubble?’ Carbon Tracker, November 2011.
- ‘Perspectives for the Energy Transition,’ The International Energy Agency and the International Renewable Energy Agency, 2017.
- Please see ‘The Circular Economy: A Powerful Force for Climate Mitigation,’ Material Economics, 2018.
- The modeling compares each coal plant’s marginal cost of energy (MCOE) to the lowest levelised cost of energy (LCOE) for wind or solar resource localised around that coal plant. For more information, please see Eric Gimon and Mike O’Boyle, ‘The Coal Cost Crossover: Economic Viability Of Existing Coal Compared To New Local Wind And Solar Resources,’ Energy Innovation, March 2019.
- ‘Renewable Power Generation Costs in 2018,’ The International Renewable Energy Agency.
- ‘New Energy Outlook 2019,’ Bloomberg NEF, 26 June 2019.
Annachiara Marcandalli, CFA - Annachiara Marcandalli is the Global Head of Sustainability & Impact Investing Solutions and a Partner at Cambridge Associates.
About Cambridge Associates
Cambridge Associates is a global investment firm with 50+ years of institutional investing experience. The firm aims to help pension plans, endowments & foundations, healthcare systems, and private clients achieve their investment goals and maximize their impact on the world. Cambridge Associates delivers a range of services, including outsourced CIO, non-discretionary portfolio management, staff extension and alternative asset class mandates. Contact us today.