Room to Run for Muni Bonds


In March 2020, the accelerating spread of the COVID-19 pandemic and the increasing probability of a deep recession prompted a flight to cash that caused sharp market moves and significant strains across financial markets. Typically considered a relatively safe asset class, municipal debt was one of the biggest losers within fixed income markets amid the market turmoil (Figure 1). As equities tanked and Treasuries rallied, substantial fund outflows, volatile market conditions, and liquidity issues resulted in extreme price dislocations and a record sell-off in this small corner of the fixed income market. It wasn’t until an unprecedented intervention by US policymakers that conditions finally stabilized.
FIGURE 1 FIXED INCOME PERFORMANCE DURING THE COVID-19 PANDEMIC
As of May 31, 2020 • Percent (%)
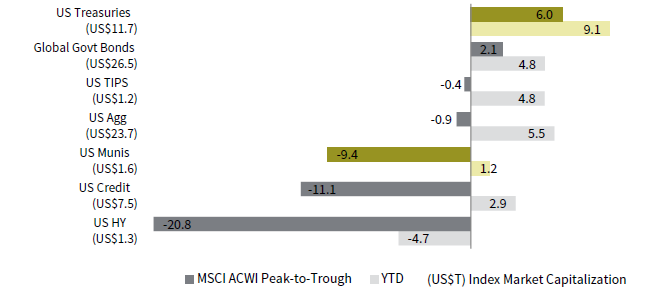
Sources: Bloomberg Index Services Limited, J.P. Morgan Securities, Inc., and Thomson Reuters Datastream.
Notes: Peak-to-trough dates are from February 19, 2020, to March 23, 2020. Total return data are in local currency terms. Asset class returns
are represented by the following indexes: J.P. Morgan United States Government Bond Index, J.P. Morgan Global Government Bond Index,
Bloomberg Barclays US Treasury Inflation-Linked Bond Index, Bloomberg Barclays US Aggregate Bond Index, Bloomberg Barclays Municipal
Bond Index, Bloomberg Barclays US Credit Index, and Bloomberg Barclays US Corporate High Yield Index.
In this paper, we aim to assess the potential upside and looming risks for munis in the aftermath of the pandemic-induced muni sell-off and subsequent policy-driven rally. Despite the recent volatility, in our view, munis continue to be an attractive alternative to both Treasuries and high-quality corporates for long-term taxable investors given their tax advantage, pledged government support, and the likelihood that they will remain a relatively stable, low-default asset class despite their exposure to the COVID-19 pandemic. Tax-exempt investors may even want to consider opportunistic investments in munis, since still-cheap valuations relative to Treasuries suggest this is an attractive entry point for investors regardless of tax considerations. 1
Muni-Land Madness
The municipal bond market entered 2020 on sound footing. Lower interest rates and strong investor demand helped the Bloomberg Barclays Municipal Bond Index return 7.5% in 2019 compared to 6.9% before taxes for the Bloomberg Barclays US Treasury Index. All signs were pointing to another strong year for munis in 2020 before municipals came under extraordinary pressure in March as financial markets unraveled amid the escalating COVID-19 pandemic.
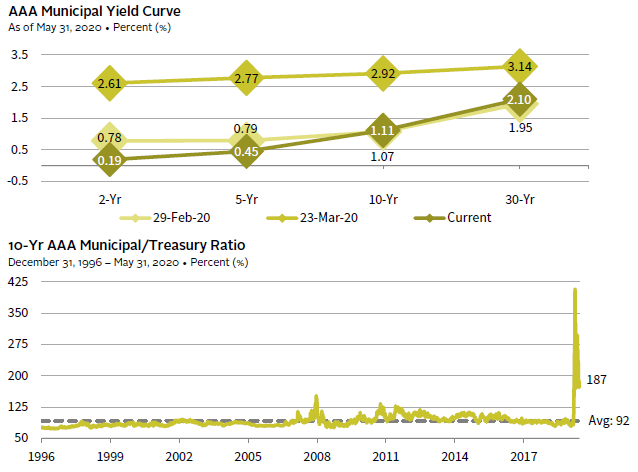
Fearful investors, desperate for cash and concerned about the vulnerability of some muni issuers to the COVID-19 pandemic, fled munis at a record pace. The Investment Company Institute reported a record $42 billion in net outflows from municipal bond funds for the month of March. The mass outflows and volatile market conditions overwhelmed the relatively small and inactive, retail-dominated market, further challenging already strained liquidity conditions. 2 Bid/ask spreads widened and short-term borrowing costs surged as a result, and munis experienced a record sell-off and extreme price dislocations that were reminiscent of the darkest days of the 2007–09 global financial crisis (GFC). Muni yields rose significantly across the curve from the end of February through March 23. Yields of ten-year bonds, for example, increased 184 basis points (bps) and the Bloomberg Barclays Municipal Bond Index recorded its two worst weeks of performance since at least 1997 during the back-to-back weeks ending March 13 (-4.3%) and March 20 (-6.6%). Meanwhile, Treasuries rallied as munis sold off, leaving the markets historically dislocated. Benchmark AAA muni/Treasury ratios blew out across the curve—ten-year ratios increased from 96% at the end of February to more than 400% in mid-March, nearly 3x their previous peak of 152% reached during the GFC (Figure 2). Yields of ten-year AA general obligation (GO) munis even briefly surpassed yields of AA corporates in March, a phenomenon that did not even take place during the GFC.
FIGURE 2 HISTORIC SELL-OFF AND EXTREME DISLOCATIONS IN THE MUNI BOND MARKET
Source: ICE BofA Merrill Lynch.
Note: Data are daily.
Ultimately, government authorities had to intervene to stop the bleeding (Figure 3). The US Federal Reserve introduced several measures to improve liquidity, facilitate the flow of credit, and backstop demand in the municipal bond market, while Congress’s stimulus packages included direct aid for states, municipalities, and hospitals. 3 It appears the aggressive policy response has helped stabilize the muni market for the time being—liquidity conditions have improved, fund flows were slightly positive in May, and AAA ten-year muni yields are now back near their pre-crisis levels. But even though some parts of the muni market have normalized, dislocations between munis and taxable equivalents remain elevated relative to history.
FIGURE 3 MUNI-CENTRIC MEASURES INCLUDED IN COVID-19 POLICY RESPONSE
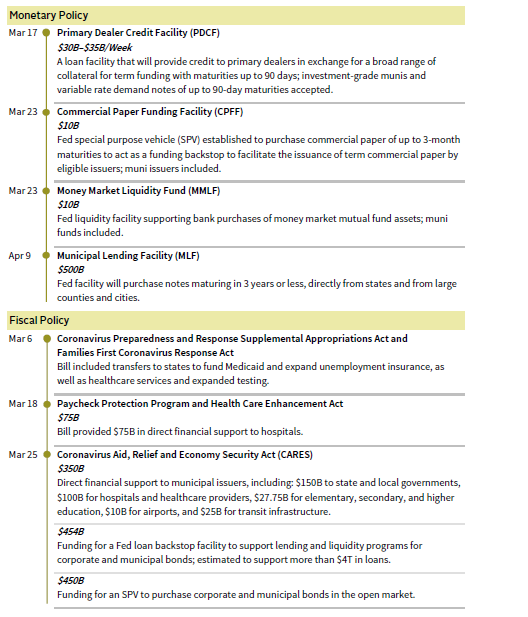
Sources: Barclays, Federal Reserve, Goldman, Sachs & Co., J.P. Morgan Securities, Inc., and PIMCO.
An Attractive Entry Point?
Municipal bonds are typically considered a relatively safe asset class because of consistently strong credit fundamentals (more on this later), and for the most part, their yields have been highly correlated with Treasury yields throughout history. Yet, as we witnessed in March, the muni market has been susceptible to brief but severe periods of stress that result in sell-offs, and at times, muni/Treasury market dislocations. These events have usually been tied to liquidity risks (as well as additional negative credit headlines) and have coincided with souring investor sentiment and significant muni fund outflows (Figure 4).
FIGURE 4 TRAILING 12-MONTH MUNI PERFORMANCE AND MUNI MARKET OUTFLOW CYCLES
January 31, 2000 – May 31, 2020
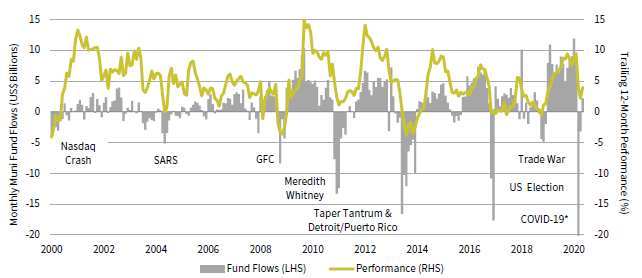
* Left axis capped for scaling purposes. March 2020 fund flows were -$42.1 billion.
Sources: Bloomberg Index Services Limited, Investment Company Institute, and Thomson Reuters Datastream.
Notes: Data are monthly. Performance data are total returns for the Bloomberg Barclays Municipal Bond Index.
Prior to the COVID-19 pandemic, the muni market had experienced seven significant outflow cycles over the previous 20 years: in 2000, 2003, 2008, 2010, 2013, 2016, and 2018. During the first month of significant outflows, when market volatility and dislocations tend to be most pronounced, munis have consistently disappointed, delivering average returns of -2.7% across all seven outflow cycles. Outflows can weigh on their performance for a few months, but the muni market has tended to recover fairly quickly during previous outflow cycles. Over the following 12-month period after the initial month of significant outflows, munis have managed to generate returns between 70 bps and 1,000 bps more than the full period annualized average over the past two decades (4.9%) (Figure 5). Furthermore, most of the gains during the recovery have come after the first three months following the initial month of significant outflows, suggesting munis remain attractive on an absolute basis even after market conditions begin to normalize.
FIGURE 5 SUBSEQUENT 12-MONTH MUNI PERFORMANCE FOLLOWING MUNI MARKET OUTFLOW CYCLES
As of May 31, 2020 • Percent (%)
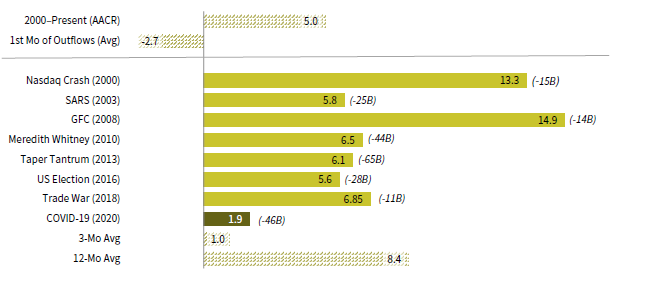
Sources: Bloomberg Index Services Limited, Investment Company Institute, and Thomson Reuters Datastream.
Notes: Categories below the line reflect subsequent 12-month returns after the first month of outflows. Values in parenthesis represent the cumulative outflows during each outflow cycle. Subsequent 12-month returns for the COVID-19 outflow cycle are May 2020 monthly returns. Three-month and 12-month average returns include the seven outflow cycles prior to COVID-19.
This time appears to mirror previous muni outflow cycles—March 2020 featured record fund outflows, skyrocketing yields, and extreme price dislocations. What sets it apart was not just the magnitude of the sell-off (munis were down 11% peak-to-trough over a ten-day period in mid-March), but also the subsequent turnaround. Since reaching its recent nadir on March 23, the Bloomberg Barclays Municipal Bond Index has staged an impressive rally, returning 9.6% through the end of May and recouping most of its losses from mid-March. AAA ten-year muni yields are now just 4 bps higher than they were at the end of February. Yet, while municipal bond yields may have made a roundtrip in absolute terms, they remain elevated relative to yields on taxable equivalents.
Historically, munis have typically offered lower yields than both Treasuries and investment-grade corporates before adjusting for taxes, making them less attractive for tax-exempt investors. Prior to 2020, the trailing five-year average ten-year AAA muni/Treasury ratio was 95%. This is not the case today even after the recent muni market rally, at least compared to Treasuries. As of May 31, 2020, the AAA ten-year muni/Treasury ratio (187%) remains extremely elevated and is well above its GFC peak of 153%. (In spread terms, the muni/Treasury dislocation is less extreme at 52 bps, but is still elevated relative to history.) In the past, munis have tended to outperform Treasuries when ratios are elevated. Munis outperformed Treasuries by roughly 16 percentage points even before adjusting for taxes over the subsequent 12-month period after muni/Treasury ratios peaked during the GFC. Muni/corporate ratios are less extreme but remain elevated following the recent muni market rally; before adjusting for taxes, the ten-year AA GO muni/corporate ratio (79%) is now only slightly above where it was heading into 2020.
With their tax exemption taken into account, munis look even more attractive than usual for taxable investors at current valuations relative to both Treasuries and investment-grade corporates. After adjusting the ten-year AAA and AA GO muni yields by the top individual federal tax rate, the tax-equivalent yields equal 1.88% and 2.23%, respectively, more than 131 bps above comparable Treasury yields and 58 bps above comparable corporate yields (Figure 6).
FIGURE 6 TAX-EQUIVALENT MUNICIPAL YIELDS VS TAXABLE BOND YIELDS
As of May 31, 2020 • Yield (%)

Sources: Bloomberg L.P. and ICE BofA Merrill Lynch.
Notes: Figure compares the taxable-equivalent yields for benchmark 10-Yr AAA and AA GO municipal bonds to the pre-tax municipal bond yields and respective US Treasury and AA US corporate bond yields. Taxable-equivalent yields are calculated using the maximum federal individual tax rate (37%) plus the Medicare surtax (3.8%).
A Bumpy Road Ahead
As mentioned before, while near-term liquidity risks have dissipated following the aggressive policy response directed toward the municipal bond market, those liquidity concerns primarily drove the extreme and volatile moves in the muni market in mid-March. That is not to say credit risk is absent. The COVID-19 pandemic is likely to test the credit fundamentals of the normally resilient and stable municipal sector like no other event in modern history.
Historically, municipal bonds have been a high-quality, low-default asset class, especially compared to corporates (Figure 7). According to Moody’s, the average trailing five-year default rate for all rated munis from 1970 to 2018 was 0.09% versus 6.62% for comparable global corporates. Yet, many municipal sectors and issuers find themselves on the frontlines of the COVID-19 pandemic, with most expected to experience unprecedented financial strains due to the combination of rising expenditures and declining revenues. For instance, state unemployment payments have surged amid widespread job losses, and the Center on Budget and Policy Perspectives estimates that states could face budget shortfalls totaling $650 billion in fiscal years 2020 through 2022, substantially deeper than during the GFC (state budget shortfalls totaled $510 billion in fiscal years 2009 through 2011).
FIGURE 7 RATING DISTRIBUTIONS FOR MUNICIPALS AND GLOBAL CORPORATES
As of December 31, 2018
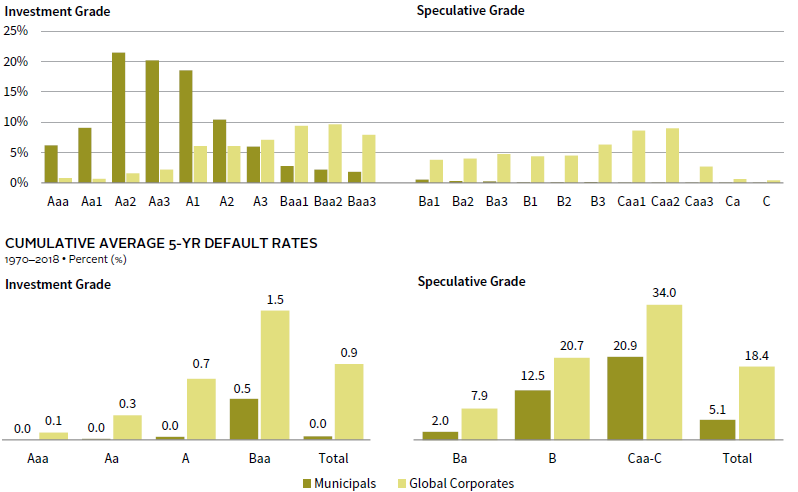
Source: Moody’s Investors Service.
Note: Data based on the Moody’s most recent US Municipal Bond Defaults and Recoveries (1970–2018) study.
That said, the municipal debt sector has remained resilient in the wake of the GFC—the average trailing five-year municipal default rate since 2009 was 0.16%, compared to 6.2% for global corporates—and many high-quality municipal issuers entered this crisis on more solid footing than in the leadup to the GFC. According to Municipal Market Analytics, it had been 16 months since the last “safe sector” payment default prior to this crisis, the longest gap since at least 2009 (earliest recording). Several of the hardest-hit sectors had substantial funds set aside to help them weather the next crisis; state reserves were at their highest level in 20 years prior to the pandemic, while major healthcare systems and airports generally have about one to two years of cash on hand. Additionally, these sectors have been, and are likely to continue to be, major beneficiaries of government support. Not all traditionally safe sector issuers will come out of this crisis unscathed. Issuers more at risk include those that were under stress before the COVID-19 pandemic, such as state and local governments with poorly funded retirement liabilities, which have become overly exposed to the stock market in recent years. For example, Illinois, which faces more than $130 billion of unfunded pension liabilities, was the first state to tap the Fed’s Municipal Liquidity Facility program and Fitch recently cut its GO bonds rating to BBB-, the lowest level of any state.
Credit fundamentals will deteriorate—S&P has already issued negative outlooks for all municipal debt sectors. But, while investors should anticipate a significant uptick in ratings downgrades and some payment defaults among high-quality munis, most payment defaults and any permanent impairments will likely be contained to riskier segments of the market, as they have been in the past. Riskier sectors that are overly dependent on user revenues and lack government support, such as convention centers and nursing and retirement homes, appear to be particularly vulnerable in this crisis. This outcome is highly sensitive to the length and severity of the economic disruption caused by governments’ efforts to contain COVID-19, as well as to future federal support for the municipal sector. Credit risks could become much more widespread from some combination of either an extension of social distancing measures beyond a few months, a more severe second wave of COVID-19 cases in the fall, and/or pushback against further government aid. 4
The Bottom Line
Municipal bonds experienced a historic sell-off during the first half of March 2020, but the muni market has stabilized over the following weeks thanks in large part to unprecedented federal policy support for the municipal sector. Yet, despite improved market conditions, muni yields remain elevated relative to comparable Treasuries—as well as investment-grade corporates on an after-tax basis—and the muni market likely has more room to normalize over the medium term, presenting an attractive entry point for long-term investors. For taxable investors, munis look more attractive than usual versus taxable equivalents and we continue to recommend high-quality municipal bonds for portfolio ballast given their tax advantage, attractive relative valuations, improved liquidity conditions, pledged federal support, and the expectation that defaults will remain low during the COVID-19 pandemic. Given today’s historically cheap relative valuations versus Treasuries, high-quality municipal bonds may even be appealing to some tax-exempt investors at this time. That said, the recent rally has likely taken some of any potential future relative muni outperformance off the table for opportunistic investors that do not benefit from municipals tax advantage.
In the event of future muni market volatility, long-term, risk-tolerant investors with adequate liquidity may want to consider a tactical allocation to closed-end municipal bond funds (CEFs). These strategies buy closed-end muni funds trading at wide discounts to net asset value (NAV) and wait for the discounts to narrow over time; they also tend to provide higher yields than open-end funds, typically by using leverage to generate more income. However, CEFs can be volatile and potentially have exposure to less liquid and riskier issues, some of which may be particularly vulnerable in the current environment. The market volatility in mid-March pushed market prices on CEFs to their widest discount ever relative to the NAV on their underlying bonds, creating an attractive entry point for investors, but CEFs are currently trading much closer to a more typical discount. Investors should continue to monitor the CEF market for future opportunities.
Index Disclosures
Bloomberg Barclays Municipal Bond Index
The Bloomberg Barclays Municipal Bond Index currently contains approximately 46,200 bonds. To be included in the index, bonds must be rated investment grade (“Baa3/BBB-” or higher) by at least two of the following ratings agencies: Moody’s, Standard & Poor’s, and Fitch, if all three rate the bond. If only two of the three agencies rate the bond, the lower rating is used to determine index eligibility. If only one of the three agencies rates a bond, the rating must be investment grade. To be included in the index, bonds must have an outstanding par value of at least $7 million and be issued as part of a transaction of at least $75 million. The bonds must be fixed rate, have a dated date after December 31, 1990, and must be at least one year from their maturity date.
Bloomberg Barclays US Aggregate Bond Index
The Bloomberg Barclays US Aggregate Bond Index is market capitalization–weighted and includes Treasury securities, government agency bonds, mortgage-backed bonds, and corporate bonds. It excludes municipal bonds and Treasury inflation-protected securities because of tax treatment.
Bloomberg Barclays US Corporate High Yield Index
The Bloomberg Barclays US Corporate High Yield Index measures the US corporate market of non-investment-grade, fixed-rate corporate bonds. Securities are classified as high yield if the middle rating of Moody’s, Fitch, and S&P is Ba1/BB+/BB+ or below.
Bloomberg Barclays US Credit Index
The Bloomberg Barclays US Credit Index measures the investment-grade, US dollar–denominated, fixed rate, taxable corporate and government related bond markets. It is composed of the US Corporate Index and a non-corporate component that includes foreign agencies, sovereigns, supranationals, and local authorities.
Bloomberg Barclays US Treasury Index
The Bloomberg Barclays US Treasury Index measures US dollar–denominated, fixed-rate, nominal debt issued by the US Treasury. The US Treasury Index is a component of the US Aggregate, US Universal, Global Aggregate and Global Treasury Indexes. It was launched on January 1, 1973.
Bloomberg Barclays US Treasury Inflation-Linked Bond Index
The Bloomberg Barclays US Treasury Inflation-Linked Bond Index measures the performance of the
US Treasury Inflation Protected Securities (TIPS) market. Federal Reserve holdings of US TIPS are not index
eligible and are excluded from the face amount outstanding of each bond in the index. The index was launched in March 1997.
J.P. Morgan Global Aggregate Bond Index (JPM GABI)
The JPM GABI consists of the JPM GABI US, a US dollar–denominated, investment-grade index spanning asset classes from developed to emerging markets, and the JPM GABI extends the US index to also include multi-currency,
investment-grade instruments.
Footnotes
- Municipal bonds aren’t often found in the portfolios of non-taxable institutions (particularly not plain vanilla funds holding quality bonds), but more esoteric strategies could compete with other credit investments; these include closed-end muni fund strategies (discussed later) and strategies that buy distressed muni bonds and take ownership of the defaulted issuer’s assets (such as convention centers or retirement communities).
- Compared to the Treasury market, the municipal debt market is relatively illiquid. The muni market has a roughly $4 trillion market cap versus about a $16 trillion market cap for Treasuries, while only about $11 billion of munis change hands every day and roughly 70% of the muni market is either owned by individuals or mutual funds, ETFs, or other daily vehicles. Additionally, given that the muni market consists of a lot of small issuers and mostly buy-and-hold investors, those looking to sell in a stressful environment can find that a lower price relative to “market” is required to induce someone to buy.
- Congress also expanded the Fed’s mandate, allowing it to purchase longer dated municipal securities. Previously, the Fed only had limited authority to purchase short-term municipal debt under Section 14 of the Federal Reserve Act.
- Additional fiscal aid for states and municipalities was left out of the recently passed $484 billion Phase 4 stimulus package. In a radio interview on April 22, 2020, Senate Majority Leader Mitch McConnell said he was in favor of states being allowed to declare bankruptcy as opposed to the federal government providing additional assistance. Muni market participants note that there is little momentum/support for a state bankruptcy bill in Congress, given that state bankruptcies are most likely not allowed under the US Constitution, and of course, many municipal bonds are not general obligations of the state in which they are issued.
TJ Scavone - T.J. is a Senior Investment Director in the Capital Markets Research Group at Cambridge Associates.
About Cambridge Associates
Cambridge Associates is a global investment firm with 50+ years of institutional investing experience. The firm aims to help pension plans, endowments & foundations, healthcare systems, and private clients achieve their investment goals and maximize their impact on the world. Cambridge Associates delivers a range of services, including outsourced CIO, non-discretionary portfolio management, staff extension and alternative asset class mandates. Contact us today.