Risks and Opportunities From the Changing Climate: Playbook for the Truly Long-Term Investor


Executive Summary
- Considering climate factors is an economic risk management and opportunity capitalization issue core to prudent investing for the long term. As a possible systemic driver of more frequent and/or severe weather events over the coming decades, climate change—defined as the long-term evolution of global and regional weather patterns driven by the rising level of greenhouse gas emissions—has the potential to materially impact businesses, economic assets, and communities. Potential impacts include direct effects on real property and supply chains, economic consequences from policy and regulatory responses to climate change, and/or indirect effects on financial markets at a global scale through the heightening of broader uncertainty and risk aversion.
- As part of incorporating climate risk into long-term investment decision-making, investors should consider whether and how to stay ahead of the climate risk curve to preserve value in their portfolios (“defense”), as well as whether and how to position themselves to capitalize on investment opportunities arising from technological advances, business model innovations, and policy evolution (“offense”). For many, the first step is not necessarily making immediate portfolio changes, but rather asking key questions to establish guideposts today to arrive at better decisions tomorrow.
- Given the interconnected and systemic nature of climate risks, investors will find it difficult to predict and precisely manage every potential impact on portfolios. However, we have identified four approaches investors can take to better understand and manage these risks: (1) engagement through delegation to managers, asking them to consider incorporating climate risks; (2) engagement through advocating for more transparency and reporting on climate risk metrics, while overlaying a climate risk lens to the due diligence and monitoring process; (3) proactive hedging via low-carbon index products, derivatives, or use of active managers that employ environmental, social, and governance (ESG) metrics; and (4) policy-level exclusion of fossil fuel and other sectors. Not all these themes are appropriate for all investors, and some will pursue none or only a few of them. But considering the options will enable long-term investors concerned about climate risks to craft their own strategy reflecting their views and objectives.
- Beyond defense, investors should consider proactive, solution-oriented strategies to capitalize on investment opportunities linked to climate change. Our basic thesis is that the more challenging the problem, the greater the opportunity set for innovations, solutions, and, ultimately, attractive investment returns. We identify five current themes: renewable infrastructure, clean transportation, smart energy, energy efficiency in buildings, and water and agricultural efficiency. Attractive risk/return profiles exist in select areas within the broader “resource efficiency” arena. The themes discussed and the various approaches to access them are neither all-inclusive nor static, as new themes can emerge and existing themes can evolve over time. The objective for truly long-term investors is not only to identify and evaluate the available and accessible investment opportunities today, but also to uncover and capitalize on the opportunities that will present themselves in the future.
- Both strong defense and offense are important to manage risks and capitalize on opportunities associated with climate change. Long-term investors would benefit from properly integrating defense and offense into a cohesive investment strategy aligned with their own views and motivations.
- We continue to seek and refine effective approaches to understand and manage risks amplified by climate change, and search for positive returns from capturing the value created by businesses and assets that play a role in the world’s gradual transition to a lower-carbon and more resource-efficient economy. These opportunities are and will continue to be driven by a combination of technological and business model innovations, policy and regulatory shifts, and, perhaps more fundamentally, the human entrepreneurial spirit that is drawn to creating real solutions to large problems.
The uncertain and changing climate poses serious challenges to investors making decisions for the very long term. As a possible systemic driver of more frequent and/or severe weather events over the coming decades, climate change—defined as the long-term evolution of global and regional weather patterns driven by the rising level of greenhouse gas emissions—has the potential to materially impact businesses, economic assets, and communities. Potential impacts include direct effects on real property and supply chains, economic consequences from policy and regulatory responses to climate change, and/or indirect effects on financial markets at a global scale through the heightening of broader uncertainty and risk aversion.
Yet precisely predicting every aspect of the when, the where, and the how of climate change impact is guaranteed to be inaccurate. While one might categorize climate change as a “tail risk,” traditionally defined as a low probability event with large magnitude consequences, perhaps it is more appropriate to categorize climate change as an uncertain-probability event with uncertain timing and magnitude of consequences. This multi-dimensional uncertainty, coupled with the difficulty of empirically isolating and measuring climate-induced losses, creates a unique type of risk management challenge for investors. That said, long-term investors would benefit from recognizing and integrating climate change as a real economic factor in positioning portfolios for the future. Fundamentally, considering climate factors is an economic risk management and opportunity capitalization issue core to prudent investing for the long term.
For investors seeking to manage their assets in perpetuity, a long-term perspective is critical. Yet despite many investors’ stated long-term time horizon, actual time horizons for investment risk/return evaluation and decision-making are largely skewed to the near term. For truly long-term investors, integrating a more comprehensive set of risk factors and opportunity sets into investment decision-making is a sensible and necessary approach. As part of incorporating climate risk into long-term investment decision-making, investors should consider whether and how to stay ahead of the climate risk curve to preserve value in their portfolios (“defense”), as well as whether and how to position themselves to capitalize on investment opportunities arising from technological advances, business model innovations, and policy evolution (“offense”). Effectively integrating both defense and offense into a cohesive investment strategy is important. For many, the first step is not necessarily making immediate portfolio changes, but rather asking key questions to establish guideposts today to arrive at better decisions tomorrow.
As with any other risk factor (central bank policy and interest rates, inflation, deflation, unemployment, corporate earnings, etc.), not all risks are created equal. Indeed, different investors will weigh climate risk differently as they assess the future investment landscape, depending on their view of the materiality and urgency of the risk. Some will likely assign climate risk a zero or near-zero weighting in their risk models today, discounting risks related to climate change as a non-issue for their investment portfolios. Others will likely assign a higher weighting if they view the economic impacts of climate change as more immediate and/or severe, and seek to establish the guideposts that will allow them to position their portfolios accordingly. Recognizing the wide range of perspectives, we aim to provide a working “playbook” for investors to customize their climate risk management approach.
In Part I: Risks and the Playbook for Defense, we discuss the potential risks that climate change can inflict upon certain sectors and asset classes and outline corresponding strategies to defend against those risks. In Part II: Opportunities and the Playbook for Offense, we review the thematic areas across public and private asset classes to proactively capitalize on the evolving opportunity set within the “resource efficiency” sector. While we are framing the discussion into these two broad categories for the sake of simplicity, we recognize that underlying investment approaches and themes lie along a continuum where lines of separation between “defense” and “offense” are blurred. The key for long-term investors is to develop a cohesive and customized strategy that fits their beliefs, motivations, and governance structures.
Part I: Risks and the Playbook for Defense
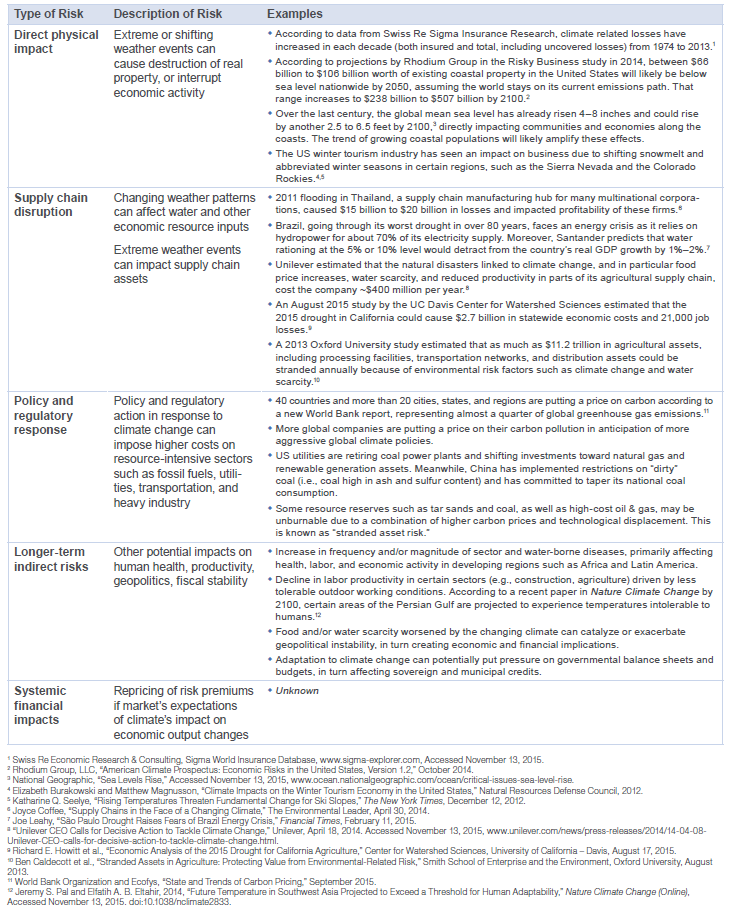
According to a recent report from the Economist Intelligence Unit, the economic consequences of climate change could be dire. The study attempts to model the climate-affected value at risk (VAR) 1 of the $143 trillion global stock of manageable assets. 2 According to the report, the mean expected loss through the year 2100, in discounted present value terms, amounts to $4.2 trillion, which is the approximate equivalent of Japan’s entire GDP. 3 At more severe climate scenarios, for example a 5°C warming, mean expected loss rises to $7 trillion, while a 6°C warming scenario could result in $13.8 trillion of losses, which approximates 10% of the current global stock of assets. The Stern Review, which accounts for governmental losses in addition to private investors, estimates the total costs of climate change to be anywhere in the range of 5%–20% of global GDP depending on the scenario. 4 As recently as September 2015, a Nature paper by Stanford and Berkeley researchers suggested that unmitigated warming is expected to reduce global incomes by roughly 23% by 2100, relative to scenarios without climate change. 5
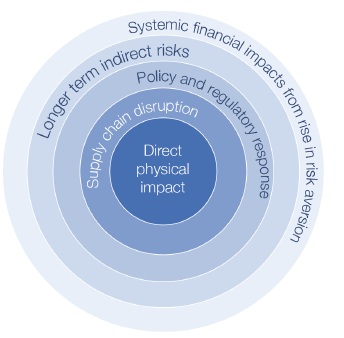
The Many Layers of Climate Risks
Naturally, economists have and will continue to debate the methodology of these imperfect forecasts. We cite these forecasts not to draw any conclusions on the certainty or magnitude of economic loss, but rather to paint a picture of one tail risk scenario. Directionally, the economic risks to the status quo introduced by climate-related uncertainties skew to the downside, not the upside. The various economic risk factors of climate change are complex and multi-dimensional. They will likely range in their method, timeframe, and severity of manifestation. Some impacts may be sudden, while others may be much more gradual. The many facets of climate risk 6 include: (1) the physical impairment or destruction of real estate property and infrastructure assets caused by more frequent or severe extreme weather events; (2) supply chain disruptions to businesses as a result of these events, particularly related to disruption of resource inputs, such as water; (3) increased costs for carbon-intensive sectors such as coal, oil sands, and many utilities as policymakers and regulators take action in responding to climate change and other environmental issues; (4) longer-term indirect effects on human health, productivity, geopolitical and fiscal stability; and (5) potential systemic re-pricing of broader risky assets driven by increased societal risk aversion to climate impacts. These risks are described in more detail in Figure 1.
Figure 1. The Many Layers of Climate Risk
One might view direct physical impact, supply chain disruption, and longer-term indirect risks as primarily driven by ecological factors. Policy, regulatory, and systemic financial risks, in contrast, are primarily human responses to climate risks that in turn become economic risks themselves. That is, policy and regulatory activity can create a “recoil” effect, where the attempt to defend against and mitigate climate impact can itself cause economic repercussions. These repercussions can occur even if the ecologically driven risks do not materialize. For investors, understanding policy and regulatory risks is critical, as those risks can affect the long-term competitiveness and cost structures of many existing industries that are intricately linked within the current high-carbon global economy. Moreover, unexpected policy or regulatory developments may also affect near-term pricing and sentiment. See Appendix A for examples of policy, regulatory, and legal developments relating to climate change.
Systemic financial risk, a second form of human response, is perhaps the most unpredictable and undiversifiable. This risk relates to the market’s “endogenization” of the climate change externality and could lead to a rise in the equity risk premium. As any experienced investor knows, perceived risk may drive markets as much as materialized risk, so any systemic change in the market’s perception of how climate affects long-term economic output may create real volatility and impairment in asset values. While there is limited evidence that this systemic risk has materialized to date, investors should be on the lookout for broader market reactions to climate driven catalysts in the future.
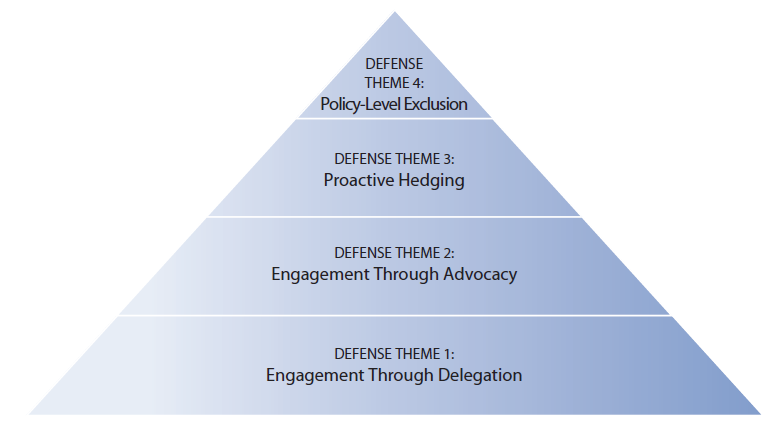
Given the interconnected and systemic nature of these and other climate risks that could arise, investors will find it difficult to predict and precisely manage every potential impact on portfolios. However, we have identified gradations in defensive themes and suggest approaches investors can take to better understand and manage these risks.
Defense Theme #1
Engagement Through Delegation
In the simplest approach, investors can engage with managers by asking them to discuss and consider climate-related factors. This allows the investor to delegate the responsibility of incorporating climate risk with the agents most actively making buying and selling decisions on specific assets. In an August 2014 letter from Yale’s Chief Investment Officer David Swensen, written to the endowment’s external investment managers, he asks Yale’s managers to “assess the greenhouse gas footprint of prospective investments, the direct costs of the consequences of climate change on the expected returns, and the costs of policies aimed at reducing greenhouse gas emissions on expected returns. Simply put, those investments with relatively small greenhouse gas footprints will be advantaged relative to those investments with relatively large greenhouse gas footprints.” In making these assessments, investment managers are expected by Yale to discuss financial risks driven by climate change and by governmental polices intended to reduce emissions—policies that impose costs on investments with high emissions. Finally, Swensen opines that “consideration of the risks associated with climate change should produce higher-quality portfolios.” 7
In our observation, Yale’s, and an increasing number of other institutions’ approach to managing climate risk emphasizes basic engagement with underlying managers. Engagement via delegation is a relatively time- and resource-efficient approach for the asset allocator. It allows for increased climate risk integration without necessarily making changes to the roster of existing active managers, the highest quality of which may be difficult to re-access if terminated.
Defense Theme #2
Engagement Through Advocacy
Some investors may prefer to pursue a more hands-on form of defense, especially if they believe that the delegation model of engagement is insufficient. Asking managers to consider climate risk is one thing, advocating for managers to follow through with implementation and reporting is another. Some managers may not even have the appropriate motivation, frameworks, tools, and data to effectively monitor and manage climate risks. As such, investors can: (1) advocate for more transparency and reporting on climate risk metrics, and (2) actively overlay a climate risk lens to the due diligence and monitoring process.
Advocating for climate-related transparency/reporting. Some investors may choose to engage in advocacy primarily through their investment managers, while others may engage with companies through shareholder discussions and/or proxy voting. Regardless of the preferred channel, by advocating for more transparency and reporting from managers and companies on climate risk metrics, investors can enhance stakeholders’ and their own ability to better understand and manage climate risk.
Climate risk metrics include portfolio companies’ carbon emissions, sensitivity to climate policy and regulation, water resource security, fossil fuel resource reserves, energy intensity, and broader resource consumption. Managers and underlying portfolio companies often do not closely track or report this data. This lack of transparency makes it challenging for investors to understand their exposure to various climate risks. For example, only 7% of asset owners surveyed are currently able to calculate the carbon emissions embedded in their portfolios. 8 But the industry is recognizing this gap and is developing new frameworks and resources. To that end, the World Resources Institute and the UNEP Finance Initiative recently compiled a list of currently available commercial tools and resources for investors seeking to assess carbon risk in portfolios. 9
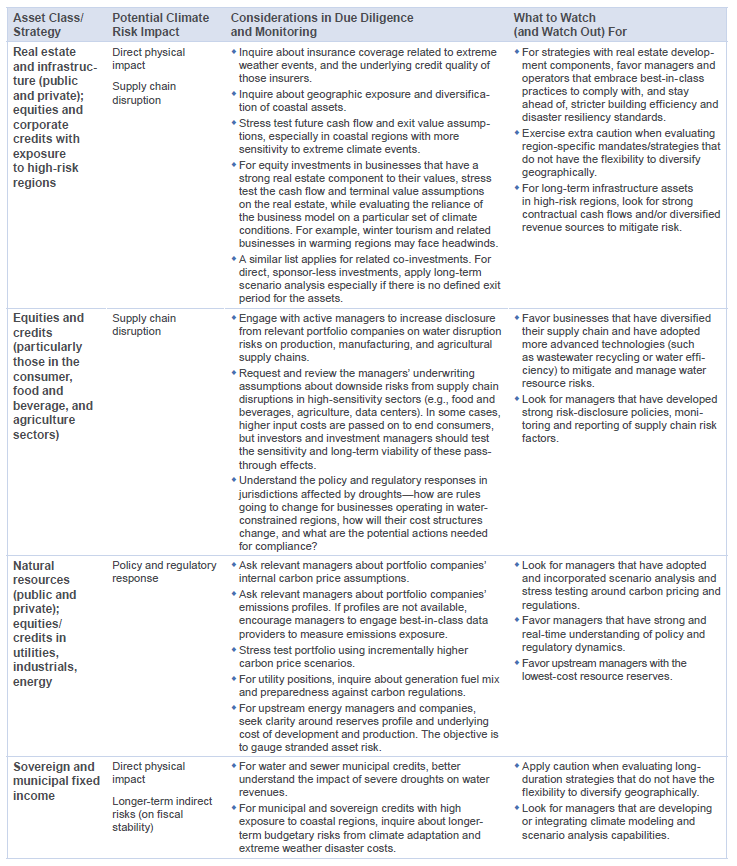
Overlaying a climate risk lens in manager diligence and monitoring. Applying a “climate overlay” in manager diligence and monitoring requires ongoing discussions around the many facets of climate risk (discussed above). Simply asking a question such as “how do you think about water security in your companies’ supply chain?” could lead to productive conversations about those companies’ sustainable competitive advantage and supply chain security. Similarly, asking a question such as “are your energy and industrial companies using an internal carbon price?” could prompt discussions about portfolio companies’ preparedness for more stringent carbon regulation. Asking long-term oriented real estate managers about the geographic exposure and diversification of properties, as they relate to coastal risks, should shed light on their risk management and time horizon. By engaging in these discussions, investors can actually gain more insight into managers’ thinking about all risks and not just climate risk. Figure 2 provides a few examples of overlaying a climate lens on the investment process for various asset classes. Of course, application of this overlay should fit within standard considerations such as valuations and near-term fundamentals to balance the longer-term dynamics with near-term catalysts. A possible outcome from this overlay exercise could be to take no immediate action upon assessing the risks, for example, if the investor feels comfortable that the underlying assets are expected to exit within the near term and/or are located away from high-risk coastal regions. The important takeaway is that the investor should integrate climate risk in the underwriting and ongoing monitoring process.
Figure 2. Illustration of Overlaying a Climate Risk Lens on Selected Assets
Defense Theme #3
Proactive Hedging
Beyond engagement, investors that want to take more aggressive action to defend against various climate risks may consider several other measures. We consider the risk management approaches we discuss below primarily as defensive tools for mitigating risks to existing portfolio assets, rather than vehicles to capitalize on solution-oriented opportunities. That said, some investors may justifiably view them as more proactive actions and therefore classify them as offensive tools. As noted, the lines between defense and offense are blurred and the ideas we discuss in this paper fall onto a continuum of options to navigate climate risk and opportunity.
Low-carbon index products. Investment products based on low-carbon indexes are becoming increasingly available. These include exchange-traded funds (ETFs) and mutual funds. The products are different from fossil-free index products in that they are sector neutral relative to a mainstream index (e.g., MSCI All Country World Index), but the positions within each sector have the lowest carbon emissions profile. As a result, the index weights the “cleanest” companies highest, while underweighting or excluding companies with the dirtiest carbon footprints. Some investors may pursue these strategies primarily to mitigate policy and regulation risks from climate change, but there also may be reputational, management quality, and governance benefits associated with these cleaner companies. Additionally, we are seeing the industry develop broader resource efficiency beta-oriented products that integrate factors such as water consumption and waste creation. These emerging products may help investors mitigate supply chain risks in addition to policy and regulatory risks.
Traditional (non-exclusionary) ESG active managers. Investors that prefer active management can consider active managers that integrate ESG (environmental, social, governance) metrics into company selection and weighting. These investors should keep in mind that many of these managers may not exclusively focus on climate risk factors but rather a broader set of ESG factors, so the extent of defense against climate-specific risks will vary by manager.
Hedging with derivative instruments (e.g., options and total return swaps). Some investors might choose to use derivatives to more precisely hedge against climate-sensitive assets. One route is to employ put options to hedge against indexes or select baskets of securities. Alternatively, investors could implement a total return swap. This involves first identifying specific long positions the investor believes will face headwinds from climate impacts (e.g., coal, tar sands, and coal-heavy utilities as they relate to climate policy/regulation, coastal businesses and municipal credits as they relate to physical impact risk). The investor can then enter into a total return swap with a counterparty to short that basket of positions. The timing and duration of the hedge relative to the duration of the risks need to be considered. Depending on the tenor of the derivative instrument, the hedging position may not be a sufficiently long-term hedge against climate risks if the risks materialize gradually. The credit risk of the counterparty providing the total return swap is another consideration. Finally, while using derivatives may optimize for precision in fulfilling specific risk management objectives, it will nonetheless carry some opportunity and transaction costs.
Defense Theme #4
Policy-Level Exclusion
Investors worried about the long-term risk of stranded assets could avoid investing in them altogether. Stranded asset risk refers to the notion that certain resources (like fossil fuels) could become unusable due to climate policies, regulations, legal rulings, and technological displacement. In turn, unusable resources would limit the investment returns of investors in those companies that hold the reserves. Excluding investments in strategies tied to assets at risk from stranding can be a long-term economic decision to defend against climate risk. That said, permanent exclusion or divestment of broad fossil fuel sectors at the policy level, without any consideration for price, can pose a handicap to the investor. Policy constraints may preclude investors from capitalizing on the broadest universe of opportunities at any given time. As we elaborated in our 2014 research note “The Fossil Fuel Divestment Discussion,” policy-level divestment is a decision specific to each institution and should incorporate that institution’s specific objectives, including its mission and values.
A Note on Green Bonds
An emerging and growing asset class, green bonds are fixed income instruments whose proceeds are earmarked for environmental, climate mitigation, or climate adaptation projects. Supranational entities (e.g., World Bank and European Investment Bank), municipalities, and corporations typically issue these bonds to support investment in areas such as renewable energy infrastructure, energy efficiency, sustainable waste management, sustainable land use, biodiversity conservation, clean water, and clean transportation. That said, guidelines and definitions around what exactly constitutes “green” activities and projects are still developing. Moreover, not all green bonds are backed by the cash flows of the green projects they are meant to fund; in fact most corporate green bonds are backed by the issuers’ balance sheet, similar to their plain vanilla bonds. Regardless, the issuers are generally held to higher transparency and reporting scrutiny. As such, green bonds can serve as both defense and offense for investors, depending on the precise use of proceeds.
See our 2014 research note “The Growing Market for Green Bonds” for a more thorough discussion of this evolving area.
The Playbook for Defense: Summary
Long-term investors concerned about economic risks from climate change should be aware of the set of available risk management options, which are summarized in Figure 3. We recognize that some investors will pursue none or only a few of these defensive measures. For long-term investors concerned about incorporating climate risks into their decision-making process, considering the options will enable them to craft their own defensive strategy reflecting their views and objectives.
Figure 3. The Playbook for Defense Against Climate Risk
Be mindful of opportunity costs. The latter two themes carry opportunity costs. Investors shifting assets into low-carbon index strategies, for example, should think carefully about the source of funds and remain sensitive to relative value. With natural resources equities at relatively cheap valuations today, the opportunity cost for funding out of this asset class will be relatively high. While carbon regulation and technological advances in alternative energy may be long-term headwinds for traditional fossil fuels, markets are likely to see many more cycles in which investors can capture returns. Investors should benefit from the flexibility to take advantage of near- to medium-term valuation opportunities, no matter the sector in which these opportunities may arise.
Beyond defense. Along those lines, long-term investors should consider looking beyond defense as a risk management approach and seek proactive, solution-oriented strategies to capitalize on investment opportunities linked to climate change.
Part II: Opportunities and the Playbook for Offense
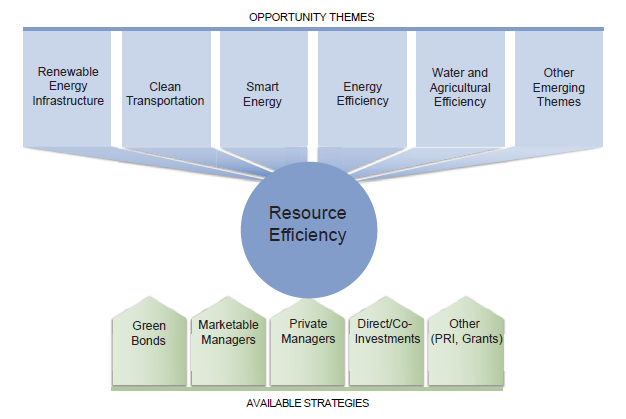
Our basic thesis is that the more challenging the problem, the greater the opportunity set for innovation, solutions, and, ultimately, attractive investment returns. Thus, investors seeking to incorporate climate risk in their long-term decision-making should focus not just on defending against climate risk, but also on planning a strategy to invest (and/or be prepared to invest) in related solutions. In this section, we discuss the many themes associated with climate change that should lead to actionable investment opportunities, some in the near term and others in the long term. Investors can access these themes through a variety of vehicles and strategies. For each theme, we identify various drivers of opportunity, available strategies to pursue these themes in a portfolio, manager characteristics and skillsets, and market signposts that investors should look for along the way as they seek to gain conviction in, and exposure to, these opportunities.
Some of these opportunities are more sensitive to policy and regulatory actions guiding the economy toward a lower-carbon future, but many are more market-driven solutions, with their success reliant on factors such as unit economics, technological differentiation, business model innovation, and sheer execution. Some investors, burned by their experience investing in clean tech in the 2000s, may justifiably find it hard to stomach investment opportunities that feel similar to arguments from that time. Yet, the clean tech experience is more nuanced than often presented, as discussed in the sidebar. For investors today, attractive risk/return profiles do exist in select areas within the broader “resource efficiency” arena, regardless of an investor’s stance on incorporating climate risks into investment decision making.
Economic opportunities appear when a resource can be used more efficiently at lower or comparable cost—hence the “resource efficiency” opportunity. Given the demands on all types of resources that climate change will impose, innovations that create more with less, and businesses that implement these innovations with unit economics that make sense, will generate value. Resources can mean energy sources for electricity generation and transportation; water, food, and agricultural inputs; industrial production inputs such as metals and other materials; and even waste products that can in turn be repurposed into useful economic assets. Efficiency can be created by a combination of superior technology, business model innovations and value-added services, strong execution, and/or economies of scale.
We recognize the universe of institutional- quality managers in this area is still evolving, and some of the highest quality and ultimately successful teams are not yet formed. Similarly, trends such as rapid technological advancements, declining cost structures, business and financing model innovations, policy and regulatory evolution, and improving management quality will open up new areas of investment opportunity in the future. Managers and teams that have the multi-dimensional expertise and networks to navigate these trends will have the highest likelihood of success. For investors, there is a need for continued monitoring and coverage of resource efficiency themes, strategies, and managers. The objective for truly long-term investors is not only to identify and evaluate the available and accessible investment opportunities today, but also to uncover and capitalize on the opportunities that will present themselves in the future.
The Clean Tech Experience
We are fully aware that the “clean tech” sector comes with a tarnished track record, as the area is littered with failed companies and projects from the last boom and bust cycle leading up to and through the great recession. According to our Clean Tech Company Performance Benchmark as of March 31, 2015, 10 the pooled return for all companies in our benchmark has been lackluster: gross 5.1% internal rate of return (IRR) and 1.2x gross multiple on invested capital (MOIC).
Many investors with exposure to clean tech investments have scar tissue that they will likely not forget. As a result of the sector’s broad challenges, many clean tech managers have been unsuccessful at raising subsequent funds, and even more have moved out of the sector completely, terminated their clean tech practices and investment professionals, or revised their strategies significantly.
Closer observation, however, shows that sub-sectors within clean tech have performed quite differently, and reasonable returns have been generated in several pockets of the universe, as shown below.
CA Clean Tech Company Performance Benchmark Sub-Sectors by Gross IRR
As of March 31, 2015
Source: Cambridge Associates LLC Private Investments Database.
Notes: All returns included in the clean tech performance statistics are gross company-level returns and are not net of any fund management or incentive fees that may be incurred by limited partners. Clean tech investments were identified from various venture capital and private equity partnerships and do not represent entire investment portfolios, therefore a direct gross-to-net IRR comparison is not available. However, to approximate the difference between net-to-limited partner fund–level IRRs and gross company-level IRRs, Cambridge Associates compared the gross and net returns of 258 US venture capital funds with a gross company-level return range of 0 to 10% and found the median return spread for these funds to be approximately 4.4% (440 bps).
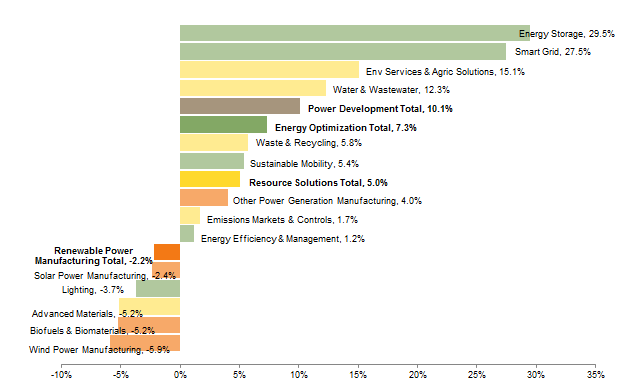
Sub-sectors like smart grid, energy storage, power development, environmental services and agricultural solutions, and water-related companies have generated reasonable to strong rates of returns in aggregate.
Most of the negative performing sub-sectors have been in upstream renewable manufacturing—areas like biofuels and solar panels. The upstream segment of the industry experienced rapid inflows of capital, leading to overinvestment and overcapacity, especially driven by a ramp-up in Chinese production in the case of solar panels. Incremental improvements to existing technologies quickly commoditized a race to the bottom of the cost curve. Some technologies could not scale with commercialized production and in the process burned excessive amounts of capital. In our benchmark, a total of $7.8 billion of invested capital went to this renewable manufacturing sub-sector group (shown below), making it the second largest group by invested capital and a meaningful drag on overall benchmark returns.
We note that venture capital and private equity represents only a portion of total investment in the clean tech sector, as seen in Appendix Figure B-1. Additionally, Appendix Figure B-3 provides a selection of marketable indexes relating to resource efficiency against traditional indexes.
CA Clean Tech Company Performance Benchmark Sub-Sectors by Invested Capital
As of March 31, 2015 • US$ millions
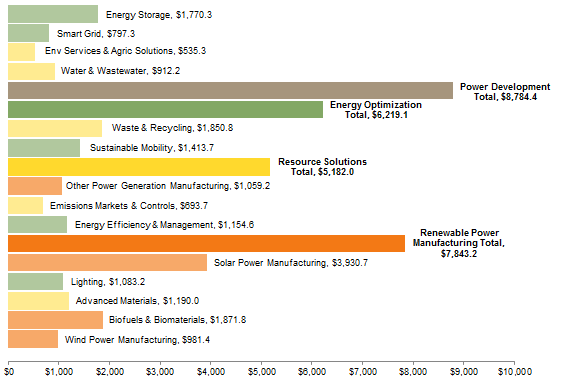
Source: Cambridge Associates LLC Private Investments Database.
Opportunity Theme #1
Renewable Infrastructure
Drivers of opportunity. Renewable infrastructure is one theme for investors who want to hedge the risk of aggressive policy and regulatory response against climate change. If policies and regulations continue to evolve and favor investment in lower-carbon energy sources, then renewables should gain competitiveness and market share over time against traditional high-carbon sources. In many ways, this trend is already occurring. Through 2014, the cost to install solar photovoltaic arrays had declined by 73% since 2006, 11 due primarily to manufacturing scale-up and technological advancements. Booming Chinese production has been a significant contributor to cost reductions. As an example, Figure 4 shows how solar deployment has increased as module costs have declined.
Figure 4. US Deployment and Cost for Solar Photovoltaic Modules
1998–2014
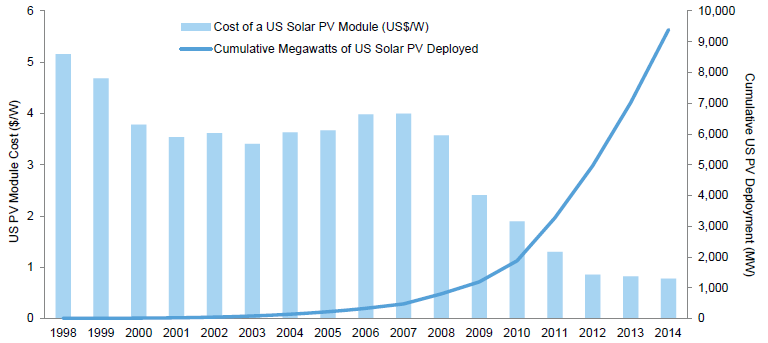
Source: Lawrence Berkeley National Laboratory.
Note: All deployment-related numbers are direct current-standard test conditions, and dollar values are real 2014 US$ terms.
The decline in prices and costs upstream typically leads to greater adoption and opportunities downstream in the value chain. Some companies have taken advantage of cheaper capital costs driven by rapidly declining solar module prices. This has been a tailwind for renewable project developers, financing companies, and other downstream service providers. With increased adoption, standardization of processes such as power purchase agreements (PPAs), net metering, and financing mechanisms have led to greater efficiency and scale. As seen in Figure 5, solar’s share of new investments in clean energy has grown significantly over recent years.
Figure 5. New Investment in Clean Energy by Sector
First Quarter 2004 – Second Quarter 2015 • US Dollar (billions)
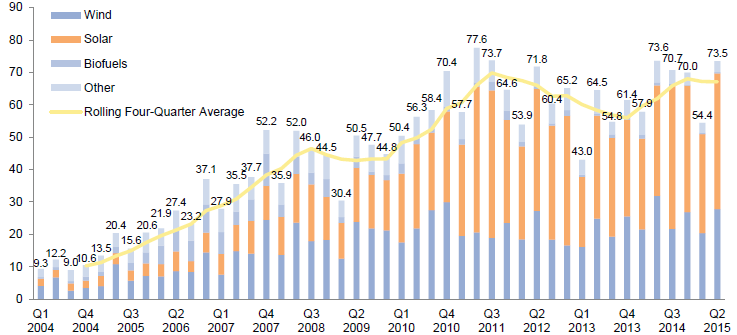
Source: Bloomberg New Energy Finance.
Notes: Total values include estimates for undisclosed deals. Excludes corporate and government R&D and spending for digital energy and energy storage projects (reported in annual statistics).
The combination of policy and regulatory pressure toward cleaner power generation, net metering incentives, and consumer behavioral changes is further driving demand growth. A few other datapoints to highlight:
- Worldwide installed capacity of distributed generation (including small-scale wind and solar) is expected to grow from 87,300 megawatts annually in 2014 to more than 165,000 megawatts in 2023, according to Navigant Research. 12
- China has made a commitment to deriving 20% of its primary energy consumption sourced by non-fossil fuels by 2030. This additional renewable generation capacity (composed of 800–1,000 gigawatts of nuclear, wind, solar, etc.) equates to more than all the coal power plants in China today and is similar to the current electricity generation capacity in the United States. 13
- In Texas, a state that does not offer state-level incentives to utilities to buy or build solar power generation, demand for solar is increasing rapidly as prices decline. The Electric Reliability Council of Texas (ERCOT) expects between 10,000 and 12,500 MW of solar generation capacity to be installed by 2029, up from the 193 MW currently. ERCOT’s director of system planning recently noted that “solar is going to become one of the most cost-effective sources of electricity on the grid.” 14
Available strategies. Investors with interest in accessing this theme can take many potential approaches depending on their risk and illiquidity tolerance. Some strategies focus on developed markets (primarily North America and Western Europe) while others pursue opportunities in emerging markets. Some target utility-scale projects while others focus on distributed generation assets. And finally, some strategies target mature, cash flow generating assets, while others seek earlier-stage development opportunities.
- Marketable equity strategies in resource efficiency that have exposure to downstream renewable infrastructure development, financing, and service businesses.
- Marketable yieldco (a dividend-paying public company that owns operating cash flow power generation assets, analogous to master limited partnerships [MLPs] and real estate investment trusts [REITs]) strategies that have exposure to renewable infrastructure projects. Note that these vehicles can be volatile and sensitive to interest rate movements and investor flows.
- In fixed income, green bonds, whose proceeds are specifically tied to renewable energy infrastructure projects.
- Private infrastructure managers focused on renewable development, construction, and/or asset management. The search for yield in a low-rate environment has led to investor interest in private infrastructure funds more broadly. Some generalist infrastructure teams invest in renewables as part of a diversified mandate. Meanwhile, we have seen an increasing number of specialist managers exclusively pursuing renewable infrastructure opportunities.
- Venture capital or private equity managers that invest in companies providing services or technologies to downstream renewable developers.
- For larger investors, direct or co-investments in renewable infrastructure assets.
Manager characteristics and skillsets
- Strong relationships and/or differentiated access to strong asset developers and operators.
- Strong credit underwriting capabilities to evaluate counterparties for power purchase agreements (typically regulated utilities, independent power producers).
- Access to regulatory and policy expertise at the regional/state level.
- Ability to stage capital appropriately upon asset performance milestones.
- Modest use of leverage at the asset and/or portfolio level.
- Thoughtfulness about monetization/exit strategy. Smaller-sized strategies that can scale-up assets and sell to larger strategic buyers should be well positioned.
Signposts
- Further signs of grid parity, where renewables are cost-competitive with traditional fuels, without subsidies. This may be particularly the case in regions that have relatively high energy costs, and/or regions with abundant renewable resources (e.g., sun, wind).
- Developments in technology or costs of energy storage, which would further increase competitiveness of renewables and increase adoption.
Opportunity Theme #2
Clean Transportation
Drivers of opportunity. Similar to power generation, the transportation industry is subject to policy, regulatory, and technological factors that can create opportunities for investors while also serving as a hedge against risks from policy and regulatory response. In the longer term, the clean transportation theme can also be an avenue to reduce sensitivity to geopolitical risks in oil-producing regions, many of which are also sensitive to climate factors.
Cost and adoption trends seen in solar and wind (and in other industries, as discussed in the sidebar) are also occurring in the transportation industry, albeit still in earlier stages. The cost of lithium battery storage technology continues to decline as the electric vehicle industry scales, with one research study estimating that the cost has declined from $1,000 per kWh in 2007 to about $450 per kWh or lower in 2014. 15 Meanwhile, stricter vehicle emission and fuel efficiency standards will continue to drive increased scale and further cost declines. The United States has set its sights on a nationwide auto fleet average of nearly 55 miles per gallon by 2025 (Figure 6). Brazil, Canada, China, the European Union, India, Japan, Mexico, and South Korea have also established or proposed fuel economy or greenhouse-gas emissions standards. These markets combined cover 80% of global passenger car sales in 2013. 16
Figure 6. Selected Global Passenger Vehicle Greenhouse Gas Emission Standards
2000–25

Source: The International Council on Clean Transportation (ICCT).
Notes: Data are as of August 2015. Supporting data can be found at the ICCT Global PV Standards Chart Library.
* Gallons and liters are normalized to corporate average fuel economy (CAFE) test cycle.
To achieve these fuel economy goals, the clean transportation industry will need to make up a larger share of vehicle sales. Of the 16.5 million total vehicles sold in the United States in 2014, only ~120,000 were electric. But that represents a 23% growth rate from 2013 and over 120% growth from 2012. 17 Although charging stations and refueling infrastructure will be a bottleneck for industry growth, the number of plug-in electric vehicle charging ports has grown meaningfully in recent years (Figure 7).
Figure 7. US Alternative Fuel Vehicle Sales and Charging Locations
1999–2014 • Thousands
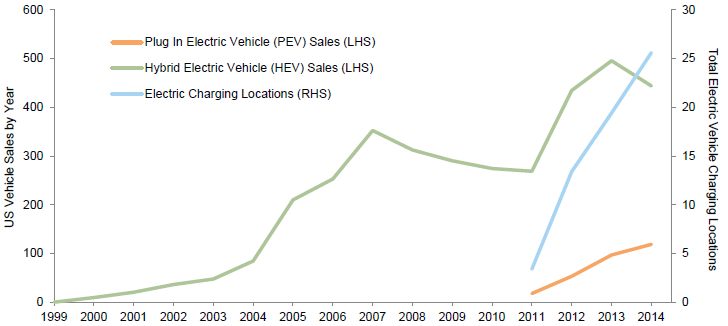
Source: US Department of Energy – Alternative Fuels Data Center (AFDC).
Notes: Total electric vehicle charging locations reflect electric charge equipment by the plug rather than by the geographic location, beginning in 2011. Data for PEV sales also begin in 2011.
Available strategies. Unlike the renewable infrastructure theme, clean transportation has few dedicated managers exclusively focused on it. Investors seeking exposure to this area generally do so through growth-oriented generalists or multi-thematic resource efficiency managers (both marketable and private) that are actively tracking or investing in clean transportation companies as part of their strategy. Some green bond issuances may also link proceeds to clean transportation investments such as low-emission vehicle fleets and electric vehicle infrastructure. Given the long-term transition toward cleaner transportation, more opportunities are likely to be found in the private markets, where managers are looking for emerging technology and service solutions catering to the evolving transportation industry.
Manager characteristics and skill sets
- Transportation industry expertise, including relevant areas such as manufacturing operations, supply chain, and distribution channels.
- Access to strategic players such as large auto manufacturers and/or large technology companies such as Google, Apple, and Uber for partnership, follow-on financing, and exits.
- Access to expertise on regulatory and policy developments for the transportation industry.
- Ability to recruit and attract best-in-class engineering and management talent.
Signposts
- Continued storage technology advancement and cost declines (monitor effects of manufacturers’ scale up of battery production, for example).
- Further build-out of vehicle charging infrastructure networks.
- Unabated push by regulators for higher fuel economy standards.
- Rise in prices of traditional transportation fuels from market forces or policy action.
Parallels With Other Industries
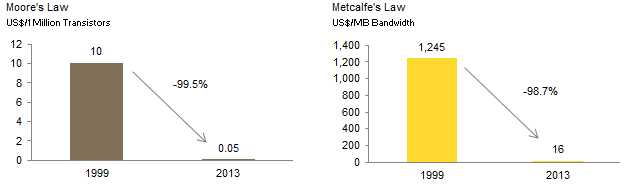
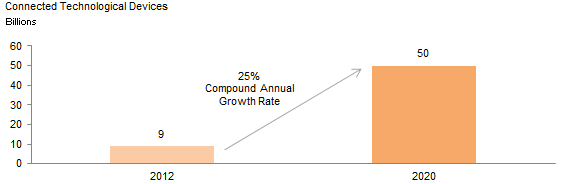
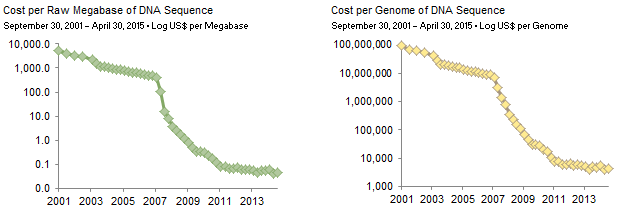
The rapid cost declines in renewables and battery storage invoke memories of powerful trends in other industries. In information technology, cheaper processing, storage, bandwidth, and hardware have led to rapid adoption of personal computers and mobile devices. That has in turn spawned innovation and value creation in applications. In life sciences, exponential declines in human genome sequencing, the rise of virtual labs and computational biology, and more variable cost structures in the use of outsourced clinical research organizations have led to a boom in biotechnology companies addressing cancer, genetic diseases, and other human health challenges.
Cost Declines in Information Technology . . .
Sources: Deloitte, KPCB, and Silver Lake Partners.
. . . Enable More Connected Technological Devices (Globally)
Sources: Cisco, Deloitte, Mooreland, and Silver Lake Partners.
Areas of Biotechology Also Seeing Cost Declines
Source: National Human Genome Research Institute.
Opportunity Theme #3
“Smart Energy”
As policy, technology, and market forces push consumers and companies toward more efficient usage and management of energy resources, two key areas for investors to consider under the “smart energy” theme are the smart grid and the so-called Internet of Things. Both of these areas are where software, hardware, and energy management can intersect to form opportunities for investment.
Drivers of opportunity: smart grid. As the power grid becomes more connected, advanced software and hardware tools that facilitate improved control, integration, and interoperability across a more diverse mix of power generation inputs (storage, renewables, demand reduction assets, microgrids, etc.) will likely see growth and opportunity. Navigant Research forecasts that the global smart grid technology market will grow from $44 billion in revenues in 2014 to over $70 billion in 2023. 18 An example includes a venture-backed startup company that provides grid infrastructure solutions, combining both hardware and software to help utilities solve for distributed energy challenges.
Drivers of opportunity: Internet of Things. Energy-saving and return-generating opportunities will be found in the “Internet of Things” as more devices and appliances become connected to the internet. Recent examples include smart home products such as energy-saving thermostats and controllers for these smart home devices.
Available strategies. Both marketable and private managers are pursuing smart grid and “Internet of Things” opportunities. Marketable managers generally pursue larger or more diversified companies, while private managers tend to focus more on emerging technologies and solutions. Given the software component of this theme, managers with a focus on information technology are well suited to pursue these areas. It is no surprise that many venture capital managers have focused more on this area.
Manager characteristics and skillsets
- Expertise and experience in software, hardware, and energy. All three are important for managers and their company management teams to navigate a complex regulatory and technical sub-sector.
- Nuanced understanding of local and regional power utility markets and regulations (particularly relevant for smart grid investments).
- Access to key industry players (power utilities, power equipment manufacturers like General Electric, and large technology companies like Samsung, Cisco, and Google) for partnerships, follow-on financing, and exits.
Signposts
- Increased visibility on interoperability standards (i.e., smart devices from different manufacturers need to be able to “talk to each other”).
- Continued adoption of distributed generation, which will cause utilities to have to manage a more complex grid, thereby increasing demand for smart grid technologies and services.
Opportunity Theme #4
Energy Efficiency in Buildings
Drivers of opportunity. Businesses and technologies that contribute to energy efficiency measures in residential, commercial, and industrial buildings make up an emerging and growing opportunity for investors. According to the International Energy Agency, the global energy efficiency market is worth at least $310 billion a year and growing. 19
An important driver of opportunity in this market is the rising cost of electricity transmission, which is one of the largest components of electricity bills. For example, in the United States, the cost of transmission has already increased five-fold between 1997 and 2012 to improve reliability and accommodate the growing fleet of renewables. 20 As the adoption of distributed generation rises further, utilities’ fixed costs (transmission and distribution costs) will be split among fewer customers, putting further upward pressure on prices. Moreover, regulatory measures to curtail power plant CO2 emissions, including the recently proposed Clean Power Plan of 2014, may add more upward pressure to electricity prices in the United States. With electricity prices rising irrespective of fuel prices, demand for energy efficiency improvements should remain strong.
Commercial and industrial building owners have taken to common energy efficiency measures such as lighting and HVAC (heat, ventilation, and air conditioning) upgrades in light of rising electricity prices, and an increasing number of third-party financing options have emerged to alleviate up-front project costs for customers. Today these trends are picking up in the United States, and we are beginning to see them internationally as well via entities such as the European Commission and the International Finance Corporation. 21 22
Keep in mind that some of the next-generation energy efficiency opportunities will overlap with those in the “smart energy” theme we discussed earlier. For example, we have seen companies that provide both intelligent lighting technology solutions and professional services to deploy the solutions in residential, commercial, and industrial settings.
Available strategies. Marketable energy managers can pursue the energy efficiency theme by investing in energy service companies (ESCOs) or in listed value chain companies selling into the energy efficiency market. In fixed income, municipalities and corporations can issue green bonds tied to energy efficiency projects.
Private managers can invest in energy efficiency technologies, project contractors, and other value chain businesses. On the asset-oriented side, we have also recently seen the formation of private strategies directly targeting diversified portfolios of energy efficiency projects via equity or debt financing.
Manager characteristics and skill sets
For resource-efficiency managers pursuing value chain opportunities:
- Nuanced understanding of technological trends, competitive dynamics, and end customer pain points in each major energy efficiency market (residential, commercial, industrial).
- Knowledge of local and regional regulatory context and third-party financing availability.
For project-oriented managers:
- In-house engineering and contracting capabilities, or access to high-quality contractors that can execute energy efficiency projects on time and on budget.
- Strong sourcing and marketing capabilities; energy efficiency projects can have a long sales cycle if the manager cannot properly communicate value proposition.
- Adoption of institutionalized processes for documentation, financing, and measurement and verification of energy savings to maximize scale.
- Disciplined harvesting and recycling of project cash flows.
Signposts
- Institutionalization of scalable processes in project documentation, and measurement and verification.
- Accelerated sales cycles and scalability of energy efficiency projects through business model innovation.
- Continued innovation and evolution in energy efficiency financing models in addition to existing programs such as PACE (Property Assessed Clean Energy) in the United States.
Opportunity Theme #5
Water and Agricultural Efficiency
Drivers of opportunity. As discussed earlier in Part I, supply chain disruptions are a risk from a changing climate, particularly related to negative impacts on water and food supply. Companies that provide technologies or services that increase data visibility on resource utilization, and/or provide the solutions to actually increase water efficiency and crop productivity should benefit. Agricultural and water assets that are operated in a resource-efficient manner should also benefit from long-term competitive advantages.
In water, as an example, some companies are providing water-management solutions to US water utilities, decreasing water demand and saving on costs in the meantime. Other examples of opportunities for better technologies and services are in wastewater treatment and recycling.
In agriculture, California farmers affected by the drought are increasingly investing in data-driven technologies that save water and increase crop productivity. 23 Venture-backed companies are already providing data-driven tools for farmers to monitor and manage their farm businesses. Other thematic areas such as seeds, labor automation, controlled-environment agri/aquaculture, specialty fertilizers and nutrient enhancements, and precision agriculture (e.g., drip irrigation) are additional examples of value chain opportunities in the agricultural sector.
Drones make up yet another opportunity set in the context of precision agriculture. In fact, agriculture drones are expected to make up 80% of the future global commercial market, according to the Association for Unmanned Vehicles Systems International. 24 Drones benefit from declining costs partially as a result of leveraging ever-cheaper smartphone components such as gyroscopes, altimeters, and compasses. High-resolution imaging technology via drones enables farmers to precisely and efficiently deploy fertilizer, water, and labor, thereby increasing crop yields and saving on often costly inputs.
Available strategies. An increasing number of marketable and private managers are focusing on water and agriculture value chain companies. Some are specialists on this theme while others are generalists who have some exposure within a broader portfolio. In fixed income, green bond issuances focused on clean water and sustainable agriculture are options to consider. Within private markets, investors can also choose among venture, growth equity, and buyout managers depending on their risk tolerance for stage of underlying companies’ development. Furthermore, there are private strategies that focus on sustainable water and agricultural assets with an operational value-add component.
Manager characteristics and skill sets
- Sector specialists that bring industry experience, networks, and expertise in water and agriculture should be favored. Access to relevant operationally oriented resources provides further differentiation.
- For generalist firms with some exposure to this theme, those with investment professionals who have built specific domain expertise over time are preferable.
- Access to potential customers and acquirers.
- Nuanced understanding of regulatory dynamics at the local and regional level.
Signposts
- Increasing number and quality of technologically savvy entrepreneurs and management teams that also understand water, food & agriculture sectors. Also look for signs that current and next-generation executives in water and agribusiness companies are focusing on developing capabilities and talent that position their companies to be on the technological cutting edge.
- Continued appetite by larger industry strategic players (e.g., Veolia, GE, Ecolab, Danaher in water; Monsanto and Syngenta in agriculture) to acquire smaller firms backed by venture or private equity.
Other Emerging Themes
The themes just discussed make up only a selection of available opportunity areas. Resource efficiency managers are also pursuing many other themes including biomass, waste-to-value, water rights, sustainable community development, and wetland mitigation banking strategies, just to name a few. In the future, more investment products may become available in the insurance space as more businesses and asset owners desire to transfer components of climate risk. Climate resilience and adaptation themes (such as sea wall and elevated real estate, flood control and pumping solutions, and geo-engineering) could also emerge. Because we expect climate-related opportunities to continue to evolve and emerge, we are watching markets and managers carefully to identify and evaluate these opportunities.
Other Strategies for Offense
Foundations with a mission-related mandate to combat environmental or climate issues also have their grant-making strategy in their arsenal to support projects. They can also make program-related investments (PRIs), which come out of the program budget rather than the endowment. Through PRIs in particular, these investors may be able to support and access early-stage projects with a high degree of technology risk and that venture capital managers may not be pursuing. While these strategies are outside the scope of this paper, we note them for these relevant institutions to consider as part of their comprehensive menu of options for offense.Investors that desire a more precise and concentrated way to access resource efficiency opportunities can also do so through direct investments in companies or projects, or through co-investments with fund managers. Some investors have the domain knowledge, networks, and governance structure to properly source, diligence, execute, and monitor direct investments themselves. But most do not and will have to primarily rely on resource efficiency managers to do most of the heavy lifting on co-investment opportunities. As we discussed in our recent paper on co-investments, “Making Waves: The Cresting Co-investment Opportunity,” investors should focus on opportunities that are within a sponsor’s “strike zone” in terms of the investment’s size, sector, and geography. Investors considering direct or co-investments should view these within the context of a diversified private portfolio and should size these investments appropriately relative to fund commitments.
The Playbook for Offense: Summary
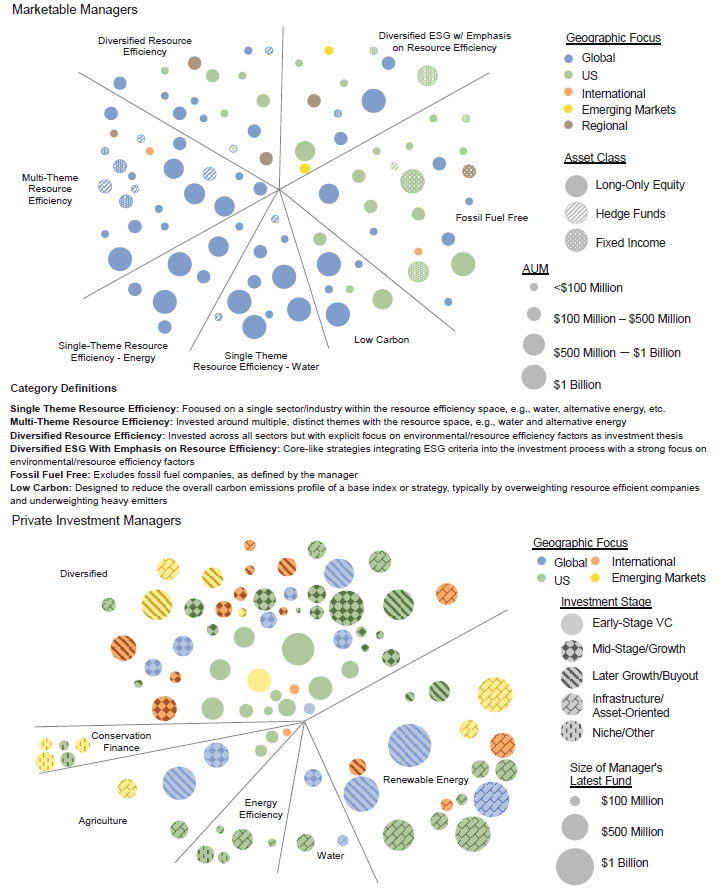
The select opportunity themes discussed and the various approaches to access those themes are neither all-inclusive nor static, as new themes can emerge and existing themes can evolve over time. Various vehicles are available to access underlying resource efficiency themes, with some opportunities lending themselves more to certain structures than others. The mandate of the strategies can differ, with the scope of some more narrowly focused on a single theme (e.g., renewables, water, or agriculture), while others focus on multiple themes, and generalists deploy capital not only to resource efficiency themes but a broader range of sectors. Direct and co-investments, grants, and PRIs are other offense options that some investors can pursue as part of a broader playbook of offense strategies. Figure 8 summarizes the themes that make up the resource efficiency opportunity, and Appendix Figure B-2 provides a pictorial representation of managers pursuing resource efficiency themes in both marketable and private formats.
Figure 8. The Playbook for Offense: Investment Themes and Strategies
Integrating Defense and Offense
Both strong defense and offense are important to manage risks and capitalize on opportunities associated with climate change. Long-term investors would benefit from not only developing playbooks for effective defense and offense within their portfolios, but also properly integrating them into a cohesive investment strategy that is aligned with their own views and motivations. Every investor should think about when to dial up and down defense and offense measures appropriately as circumstances evolve. Deciding when to use certain plays is just as important as executing well on those plays. And finally, setting an appropriate time horizon and benchmark (on an absolute basis, on a relative basis versus a relevant index, and relative to the sources of funds and opportunity costs) for any defense or offense measures taken, are important considerations. Aside from the clean tech company performance benchmark mentioned in the sidebar, we include in Appendix Figure B-3 a select sample of public market indexes that investors could consider in benchmarking both defense and offense strategies, with the caveat that these indexes are end-point sensitive and many are still quite young.
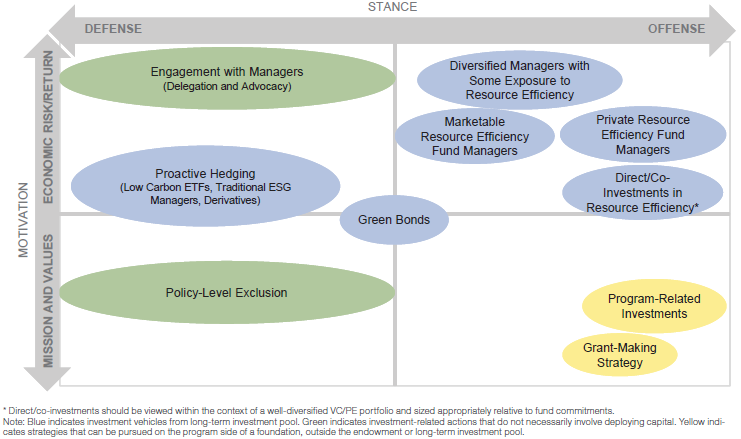
Figure 9 provides a high-level schematic of the full array of strategies for defense and offense, solving for both stance and motivation. We acknowledge that investors may hold different views on the positioning of each of these strategies. Our intention is not to stamp these labels into permanence, but rather to lay out an initial framework for investors to evaluate and contextualize their options.
Figure 9. Framework for Integrating Climate Defense and Offense
Stay Tuned …
Rather than ending with a summary conclusion, we prefer to pause here and say “stay tuned for more.” As we strive to be truly long-term investors ourselves, we recognize that there will be continued evolution in both risk factors and opportunity sets involving climate change. Given the many uncertainties around this long-term issue, we will be committed to collaborating with our clients and the broader industry to constructively iterate on both theoretical framework and practical implementation. In the meantime, we continue to seek and refine effective approaches to 1) understand and manage risks amplified by climate change, and 2) search for positive returns that capture the value created by businesses and assets that play a role in the world’s gradual transition to a lower-carbon and more resource-efficient economy. These opportunities are and will continue to be driven by a combination of technological and business model innovations, policy and regulatory shifts, and, perhaps more fundamentally, the human entrepreneurial spirit that is drawn to creating real solutions to large problems.
Appendix A. Examples of Policy, Regulatory, and Legal Action on Climate Change
- The European Union enacted a cap-and-trade system in 2005 known as the EU Emission Trading Scheme (ETS) to place a limit on greenhouse gas emissions. In addition, the EU has committed to reducing its overall emissions at least 40% below 1990 levels by 2030. Several European countries, including Denmark, Finland, Ireland, the Netherlands, Norway, Slovenia, Sweden, Switzerland, and the United Kingdom, have enacted a carbon tax.
- In 2014, Chile enacted the first climate pollution tax in South America, targeting large factories and the electricity sector.
- Brazil pledged in 2010 to reduce its emissions by 36.1%–38.9% in 2020 compared to business-as-usual emissions.
- South Africa is considering a carbon tax in 2016.
- New Zealand set up an emission trading scheme in 2008, covering forestry initially, but then expanded in 2010 to cover energy, transport, liquid fossil fuels, and industrial processes.
- South Korea’s emissions trading scheme, legislated in 2012, officially entered into force on January 1, 2015, and is now the second largest carbon market worldwide after the EU’s ETS.
- Japan introduced a carbon tax in 2012 to reduce emissions; it also recently announced its Intended Nationally Determined Contribution (INDC) of targeting an emission reduction of 26% below 2013 emission levels by 2030.
- China, the world’s largest emitter, committed to target peak emissions by 2030 and lower the carbon intensity of GDP by 60%–65% below 2005 levels by 2030. The country currently has seven city and provincial level pilot carbon emissions trading schemes. In September 2015, China announced that it will launch a national “cap and trade” system in 2017. Once initiated, it will become the world’s largest carbon trading market.
- In India, the government in 2010 introduced a nationwide carbon tax of 50 rupees per tonne of coal both produced and imported to the country; this tax has since been doubled twice and is now 200 rupees per tonne. Moreover, India has pledged to reduce its GDP emissions intensity by 20%–25% by 2020 compared to 2005 levels.
- In Canada, the province of British Columbia implemented a carbon tax in 2008 and has increased it four times; similarly, in June 2015, Alberta announced that it will increase its existing provincial carbon levy on larger emitters from the current C$15 per tonne to C$20 per tonne in 2016, and $30 per tonne in 2017.
- In the United States, the proposed federal Clean Power Plan would require a 32% cut in power-plant carbon dioxide emissions by 2030 from 2005 levels. It also calls for the United States to generate 28% of its electricity from renewable sources by 2030 (versus 13% as of 2014). At the state and regional levels, there are currently two cap-and-trade markets: (1) Regional Greenhouse Gas Initiative (RGGI), which covers nine Northeastern and Mid-Atlantic States; and (2) California. The latter, the largest US state and also the world’s eighth largest economy, passed a bill in early September that sets a target of 50% electricity generation coming from renewable sources and a requirement of 50% increase in buildings’ energy efficiency by 2030.
- A recent Hague court ruling concluded that the government in the Netherlands must take action to cut greenhouse gas emissions by 25% by 2020. This ruling is significant in that it can be a precedent-setting case for other jurisdictions, especially in Europe, that make these policies more legally enforceable.
Information contained in this section was compiled from sources including:
- Carbon Tax Center, “Where Carbon Is Taxed,” Accessed November 16, 2015, www.carbontax.org/where-carbon-is-taxed.
- Climate Action Tracker, “Climate Action Tracker: Countries,” Accessed November 16, 2015, www.climateactiontracker.org/countries/.
- International Carbon Action Partnership, “Korea’s Emissions Trading System Started on 1 January 2015,” Accessed November 16, 2015, www.icapcarbonaction.com/news/news-archive/263-korea-s-emissions-trading-system-started-on-1-january-carbon-trading-opens-on-12-january.
- Japan for Stability, “Japan Introduces New Tax on Carbon Emissions,” Accessed November 16, 2015, www.japanfs.org/en/news/archives/news_id032490.html.
- Ryan Koronowski, “Half of California’s Electricity Will Come From Renewables Within 15 Years,” Climate Progress, September 12, 2015.
- Quirin Schiermeier, “Landmark Court Ruling Tells Dutch Government to do More on Climate Change,” Nature, June 24, 2015.
- Special Broadcasting Service Corporation, “Factbox: Carbon Taxes Around the World,” Accessed November 16, 2015, www.sbs.com.au/news/article/2013/10/29/factbox-carbon-taxes-around-world.
- James Wood, “Alberta Boosts Carbon Tax to $20 a Tonne Starting in 2016 as Part of Climate Change Plan,” Financial Post, June 25, 2015.
Appendix B. Additional Exhibits
The figures in this section provide additional information and context for consideration. Figure B-1 displays total investment in renewable energy, showing that the venture capital and private equity strategies discussed in the report’s clean tech sidebar are only a portion of total investment in the sector. Figure B-2 is a pictorial representation of managers pursuing resource efficiency themes in both marketable and private formats. Finally, Figure B-3 compares a selection of marketable indexes relating to resource efficiency with traditional indexes on a risk/return basis over different periods.
Appendix Figure B-1. Global Investment in Renewable Energy
2004–15 • US Dollar (billions)
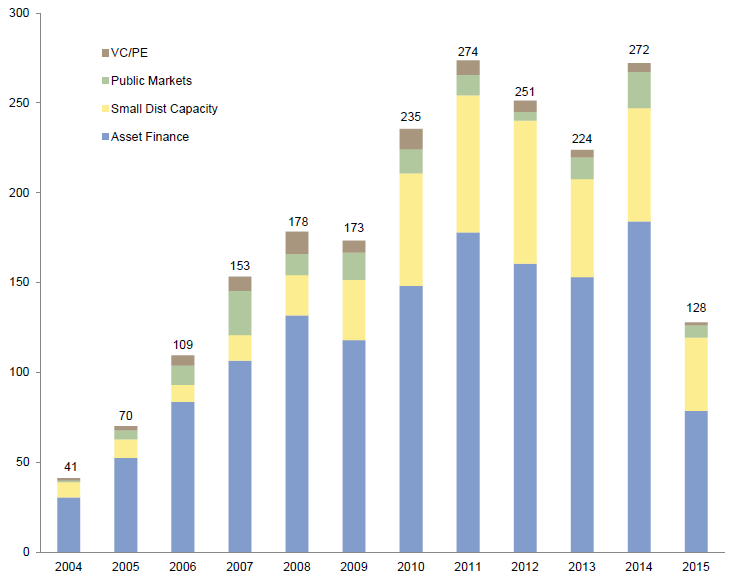
Source: Bloomberg New Energy Finance.
Notes: Data for 2015 are through June 30, 2015. Total values include estimates for undisclosed deals. Excludes corporate and government R&D and spending for digital energy and energy storage projects.
Appendix Figure B-2. Manager Universe Addressing Climate Risk/Opportunity
Appendix Figure B-3. Historical Performance and Risk/Return of Various Public Equity Market Indexes
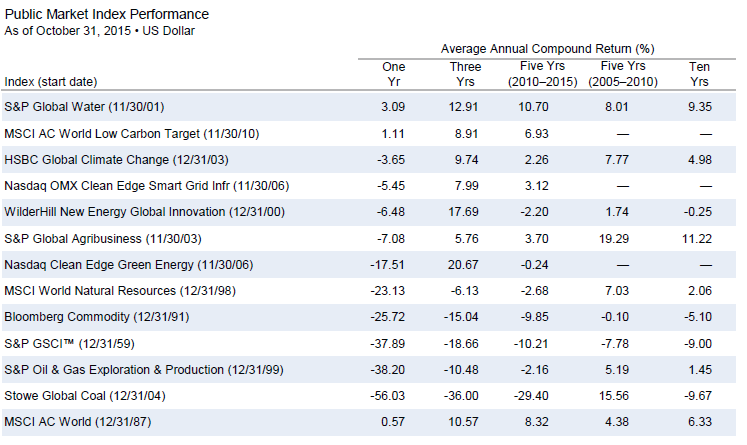
Appendix Figure B-3. Historical Performance and Risk/Return of Various Public Equity Market Indexes
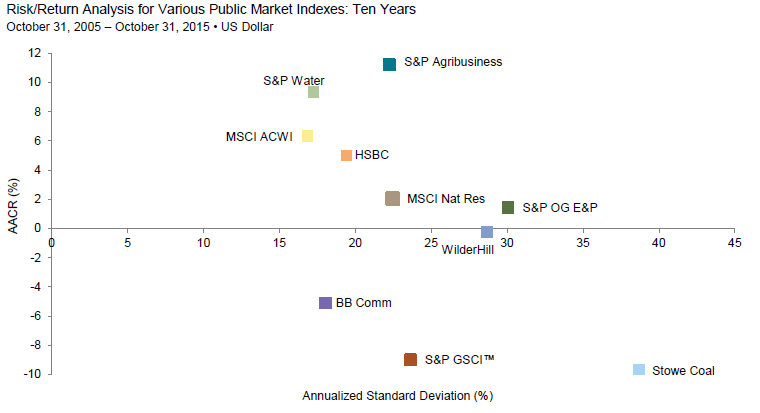
Appendix Figure B-3. Historical Performance and Risk/Return of Various Public Equity Market Indexes
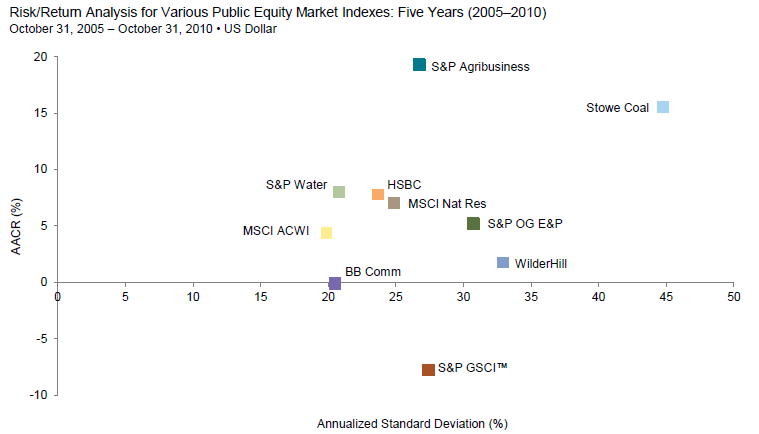
Appendix Figure B-3. Historical Performance and Risk/Return of Various Public Equity Market Indexes
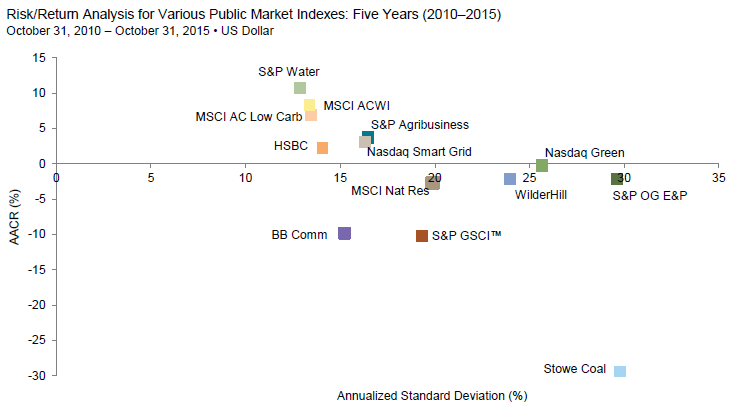
Sources: Bloomberg L.P., HSBC Inc., MSCI Inc., NASDAQ Inc., Standard & Poor’s, Stowe Partners LLC, Thomson Reuters Datastream, and WHNEF LLC. MSCI data provided “as is” without any express or implied warranties.
Notes: Data are monthly. Performance data are total returns gross of dividend taxes except for HSBC, which are price returns.
Appendix C. Select Reading List for Climate Change Risk and Opportunities
Numerous articles and reports discuss the risks and opportunities related to climate change. We have highlighted a few that we believe provide helpful information and context for investors that seek further understanding of this issue. This list is certainly not exhaustive and is not meant to endorse one particular view over another, but rather should serve as further reference for those wishing to explore some of the points made in this report.
Investor Frameworks on Climate-Related Risks
Christopher Weber and Mark Fulton, “Carbon Asset Risk: Discussion Framework,” World Resources Institute, August 2015
- Discusses the non-physical risks (e.g., policy, market, and technology risks) that climate change may pose for investors and lays out a framework for investors to think about carbon asset risk in their portfolios.
“Climate Change Investment Solutions: A Guide for Asset Owners,” Institutional Investors Group on Climate Change, April 24, 2015
- Seeks to provide investors with tools for, and guidance on, integrating climate change into investment processes. The paper notes that corporate and policy engagement is an important complementary strategy to both address risks and identify opportunities.
Studies on Broader Economic Risks of Climate Change
“Unhedgeable Risk: How Climate Change Sentiment Impacts Investment,” Cambridge Institute for Sustainability Leadership, November 2015
- A guide to approaching an “unhedgeable risk”—climate change—for institutions, investors, and regulators. The authors argue that certain asset allocation moves within a portfolio may help minimize exposure to climate sentiment risk.
Marshall Burke, Solomon M. Hsiang, and Edward Miguel, “Global Non-linear Effect of Temperature on Economic Production,” Nature, October 21, 2015
- An empirical analysis of temperature and productivity. The authors of this article analyzed historical temperatures and productivity of 166 countries and observed that climate change may have a more severe impact on the global economy than previously suggested.
“The Cost of Inaction,” The Economist, September 26, 2015
- Analyzes the economic costs of inaction on climate change, on both a global- and investor-level scale. The report posits that climate change, both minor and severe, may lead to weaker economic growth and asset class returns.
“Risky Business: The Economic Risks of Climate Change in the United States,” Risky Business Project, 2014
- Analyzes the potential economic consequences associated with climate change in the United States. Specifically, the report looks at property and infrastructure damage caused by rising sea levels and storms, shifting agricultural patterns and crop yields, and impacts on labor productivity and public health.
Research on Select Opportunity Themes
“Crossing the Chasm,” Deutsche Bank, February 27, 2015
- Analyzes the future of solar electricity. Due to declining prices of solar panels and improving financing and customer acquisition costs, the report asserts that solar electricity is expected to become a more viable option versus traditional retail electricity despite low oil & gas prices. Going forward, the report argues that solar costs may continue to decline due to improved economics in the industry.
Beijia Ma, Barnaby Martin, Sarbjit Nahal, and Emmanuel Owusu-Darkwa, “Fixing the Future: Green Bonds Primer,” Bank of America Merrill Lynch, September 8, 2014
- Explores the financial consequences of climate change and potential investment opportunities, specifically the opportunity to invest in Green Bonds.
“Energy Efficiency: A Compelling Global Resource,” McKinsey & Company, 2010
- A compilation of articles on energy-efficiency opportunities and how to potentially capture them in companies and countries.
Review of Climate Change Policy and Regulation Trends
“State and Trends of Carbon Pricing 2015,” World Bank Group, September 2015
- An overview of existing and emerging carbon pricing instruments around the world, including national and state initiatives, updated annually. This report covers instruments that put an explicit price on greenhouse gas emissions, such as emissions trading systems, carbon taxes, offset mechanisms, and results-based finance, but also internal carbon prices. It also provides a forward-looking assessment of the advantages of international cooperation in reaching global targets.
Perspectives From Asset Managers
“The Price of Climate Change: Global Warming’s Impact on Portfolios,” BlackRock Investment Institute, October 2015
- Examines the potential implications of climate policy and other factors on investors and investment outcomes, outlining potential winners and losers from efforts to mitigate climate change. The paper considers ways for asset owners to promote sustainability, including a focus on environmental, social, and governance (ESG) factors.
Ian Simm, “Climate Change: Now Risk Not Uncertainty,” Impax Asset Management, May 26, 2015
- Outlines ways investors can measure and respond to climate change risk to position their portfolios for long-term outperformance.
Rick Stathers and Alexia Zavos, “Responding to Climate Change Risk in Portfolio Management,” Schroders, February 2015
- Explores the various strategies investors can employ to better understand and manage their exposure to climate change risk.
Cambridge Associates does not provide stock selection recommendations, and any reference to specific companies is not to be interpreted as a recommendation of that company as an investment option.
Index Disclosures
Bloomberg Commodity Index
The Dow Jones-UBS Commodity Index (DJ-UBSCI) is a broadly diversified index that allows investors to track commodity futures through a single, simple measure. The DJ-UBSCI is composed of futures contracts on physical commodities. It is published on Bloomberg and Reuters. The index is designed to minimize concentration in any one commodity or sector. It currently includes 19 commodity futures in five groups. No one commodity can compose less than 2% or more than 15% of the index, and no group can represent more than 33% of the index (as of the annual re-weightings of the components).
CA Clean Tech Company Performance Benchmark
The CA Clean Tech Company Performance Benchmark was launched in 2013. We track more than 1,400 distinct investments made between 2000 and 2013, representing $28.0 billion of invested capital. These investments are in over 800 distinct companies backed by 480 different private investment funds (including 345 venture capital funds, 129 private equity, and 6 infrastructure funds). It is published on a quarterly basis, and new companies are added to the benchmark every quarter as coverage of the relevant universe is expanded.
HSBC Global Climate Change Index
The HSBC Global Climate Change Benchmark Index covers roughly 300 stocks from 34 countries and 19 themes, including solar, wind, energy-efficient solutions, power storage, biofuels, carbon trading, diversified renewable, investment companies, and building insulation. Companies must derive more than 10% of their annual revenues from climate change–related business activities. The minimum market capitalization is currently set at $500 million, and components must have a minimum average daily trading turnover of 0.02% of full market capitalization. Components are weighted based on a combination of full-float market capitalization and their exposure to the relevant fields.
MSCI All Country World Low Carbon Target Index
The MSCI ACWI Low Carbon Target is based on the MSCI ACWI, its parent index, and includes large- and mid-cap stocks across 23 developed markets and 23 emerging markets countries. The index aims for a tracking error target of 0.3% (30 bps) while minimizing the carbon exposure. By overweighting companies with low carbon emissions (relative to sales) and those with low potential carbon emissions (per dollar of market capitalization), the index reflects a lower carbon exposure than that of the broad market. It uses MSCI ESG CarbonMetrics data from MSCI ESG Research Inc.
MSCI All Country World Index
MSCI ACWI captures large- and mid-cap representation across 23 developed markets and 23 emerging markets countries. With 2,476 constituents, the index covers approximately 85% of the global investable equity opportunity set.
MSCI World Natural Resources Index
The MSCI World Natural Resources is based on the MSCI ACWI, its parent index, and includes energy sector stocks plus metals & mining, paper & forest products sub-industries. The MSCI data are composed of a custom index calculated by MSCI.
NASDAQ Clean Edge Green Energy Index
The NASDAQ® Clean Edge® Green Energy Index (CELS) is a modified market capitalization–weighted index designed to track the performance of companies that are primarily manufacturers, developers, distributors, or installers of clean energy technologies. To be eligible for inclusion in the Index, the security must be listed on NASDAQ, NYSE, or AMEX.
NASDAQ OMX Clean Edge Smart Grid Infrastructure Index
The NASDAQ OMX® Clean Edge® Smart Grid Infrastructure Index (QGRD) includes companies that are primarily engaged and involved in electric grid; electric meters, devices, and networks; energy storage and management; and enabling software used by the smart grid and electric infrastructure sector. The security must be listed on an index-eligible global stock exchange approved by the Index Administrator. The component securities are classified as pure play or diversified. Pure play securities are given a collective weight of 80% and the diversified securities are given a collective weight of 20% in the Index.
S&P Global Agribusiness Index
The S&P Global Agribusiness Index is a modified market cap–weighted index that includes 24 of the largest publicly traded agribusiness companies from around the world. The index is composed of a diversified mix of producers, distributors & processors, and equipment & materials suppliers companies.
S&P Global Water Index
The S&P Global Water Index provides liquid and tradable exposure to 50 companies from around the world that are involved in water-related businesses. To create diversified exposure across the global water market, the 50 constituents are distributed equally between two distinct clusters of water related businesses: water utilities & infrastructure and water equipment & materials.
S&P GSCI™ Index
The S&P GSCI™ is designed as a benchmark for investment in the commodity markets and as a measure of commodity market performance over time. The S&P GSCI™ is calculated primarily on a world production-weighted basis and comprises the principal physical commodities that are the subject of active, liquid futures markets. There is no limit on the number of contracts that may be included in the S&P GSCI™; any contract that satisfies the eligibility criteria and the other conditions specified in this methodology are included.
S&P Oil & Gas Exploration & Production Index
S&P Select Industry indexes are designed to measure the performance of narrow GICS® sub-industries. The index comprises stocks in the S&P Total Market Index that are classified in the GICS oil & gas exploration & production sub-industry.
Stowe Global Coal Index
The Stowe Global Coal Index includes globally traded stocks principally engaged in two segments of the coal industry: (1) coal mining and production, and (2) coal mining equipment, coal transportation, and coal technology. To be included constituents must be principally engaged in the coal industry, listed on recognized exchange, have a minimum capitalization adjusted for free float greater than US$200 million, and a minimum average daily trading volume greater than US$1 million. The index is modified capitalization weighted and adjusted for free float.
WilderHill New Energy Global Innovation Index
The NEX is a global index of 106 companies listed on 31 exchanges in 26 countries (excluding Hong Kong and Taiwan), with a primary focus on companies that advance the generation and use of cleaner energy, conservation, efficiency, and renewables. NEX is a rule-based index and uses equal-weighting methodology modified by sector and market capitalization bands to provide diversification across the clean energy industry. The index is rebalanced quarterly on the last business day of March, June, September, and December. At rebalancing no single component can exceed 5% weight.
Footnotes
- Value at risk measures the size of loss within a given time period at a particular probability.
- According to estimated data by the Financial Stability Board. Total manageable assets account for the total stock of assets held by non-bank financial institutions.
- The Economist Intelligence Unit, “The Cost of Inaction: Recognising the Value at Risk from Climate Change,” July 2015.
- Nicholas Stern, “The Stern Review: Economics of Climate Change,” HM Treasury, October 2006.
- Marshall Burke, Solomon Hsiang, and Edward Miguel, “Global Non-Linear Effect of Temperature on Economic Production,” Nature, Accessed November 16, 2015. doi: 10.1038/nature15725.
- We recognize that “climate risk” is a broad term that relates not only to economic factors but also human communities and ecological habitats. For the purposes of this paper, the scope will be primarily focused on economic and financial impacts.
- David Swenson to Yale External Investment Managers, August 27, 2014.
- World’s Largest Asset Owners Continue to Gamble on Climate Risk, Asset Owner’s Disclosure Project, April 27, 2015.
- World Resources Institute and UNEP Finance Initiative, “Carbon Asset Risk: Discussion Framework,” Washington, DC, and Geneva, Switzerland, August 2015.
- The CA Clean Tech Company Performance Benchmark was launched in 2013. We track more than 1,400 distinct investments made between 2000 and 2013, representing $28.0 billion of invested capital. These investments are in over 800 distinct companies backed by 480 different private investment funds (including 345 venture capital funds, 129 private equity, and 6 infrastructure funds). We publish this benchmark on our public website (www.cambridgeassociates.com) on a quarterly basis, and add new companies to the benchmark every quarter as we expand coverage of the relevant universe. See our quarterly report, “Clean Tech Company Performance Statistics,” for detailed definitions of each sub-sector and group within the benchmark.
- Solar Energy Industries Association®, “Solar Energy Facts: 2014 Year in Review,” December 17, 2014.
- Navigant Consulting, Inc., “Global Distributed Generation Deployment Forecast,” Third Quarter 2015.
- The White House Office of the Press Secretary, “Fact Sheet: US-China Joint Announcement on Climate Change and Clean Energy Cooperation,” The White House, November 16, 2015.
- Russell Gold, “Texas Takes a Shine to Solar Power,” The Wall Street Journal, August 23, 2015.
- Megan Geuss, “Electric Vehicle Batteries Are Getting Cheaper Much Faster Than We Expected,” ARS Technica (Online), July 16, 2015.
- The International Council on Clean Transportation, “Info & Tools: Global Passenger Vehicle Standards,” Accessed November 16, 2015, www.theicct.org/info-tools/global-passenger-vehicle-standards.
- Ben Geier, “Electric Vehicle Sales Charged Up in 2014,” Fortune, January 8, 2015.
- Navigant Consulting, Inc., “Smart Grid Techologies,” Chicago, Third Quarter 2014.
- International Energy Agency, “Global Energy Efficiency Market ‘An Invisible Powerhouse’ Worth at Least USD 310 Billion Per Year,” October 8, 2014.
- Lori Aniti, “Investment in Electricity Transmission Infrastructure Shows Steady Increase,” US Energy Information Administration, August 26, 2014.
- European Commission, “Financing Energy Efficiency,” Accessed November 16, 2015, www.ec.europa.eu/energy/en/topics/energy-efficiency/financing-energy-efficiency.
- The Independent Evaluation Group and The World Bank Group, “Energy Efficiency Finance: Assessing the Impact of IFC’s China Utility-Based Energy Efficiency Finance Program,” The International Bank for Reconstruction and Development/The World Bank, 2010.
- Ilan Brat, “California Drought Plants Seeds for Tech,” The Wall Street Journal, July 17, 2015.
- John Wihbey, “Drones Are Revolutionizing Farming. Is America Being Left in the Dirt?,” Boston Globe, August 23, 2015.
Liqian Ma - Liqian Ma is Head of Sustainable & Impact Investing Research and a Partner at Cambridge Associates.
About Cambridge Associates
Cambridge Associates is a global investment firm with 50+ years of institutional investing experience. The firm aims to help pension plans, endowments & foundations, healthcare systems, and private clients achieve their investment goals and maximize their impact on the world. Cambridge Associates delivers a range of services, including outsourced CIO, non-discretionary portfolio management, staff extension and alternative asset class mandates. Contact us today.