Playing Defense in a Low-Rate Environment


For the past several decades, investors with balanced portfolios have predominately relied on developed markets (DM) sovereign bonds for defense. Over this period, DM sovereign bonds have consistently provided both liquidity and portfolio ballast during periods of equity market stress, while also delivering reasonable, diversified returns relative to equities in the long run. However, with most DM sovereign bond yields near or below zero, their expected returns are at all-time lows and they have limited capacity to appreciate in future equity market sell-offs. Identifying a relatively liquid, low-cost asset that consistently appreciates when equities decline is no longer straightforward. So, how should investors play defense in a low-rate environment?
Unfortunately, there are no simple solutions. No single asset likely will provide the same attractive diversification characteristics as DM sovereign bonds did in the past. Not even DM sovereign bonds themselves! Instead, we found that a diversified basket of “defensive” assets provided comparable diversification characteristics to DM sovereign bonds historically. While this basket may not solve all challenges associated with today’s low-rate environment, we view it as better equipped than DM sovereign bonds to defend balanced portfolios during future periods of equity market stress.
The Problem with DM Sovereign Bonds
DM sovereign bonds have served as the ideal complement to equities in balanced portfolios because of their attractive diversification characteristics. While DM sovereign bonds will likely continue to serve as a reliable liquidity reserve in most market circumstances, low nominal yields have forced us to question both their ability to consistently appreciate during future periods of equity market stress and whether they can continue to provide reasonable, diversified returns relative to equities.
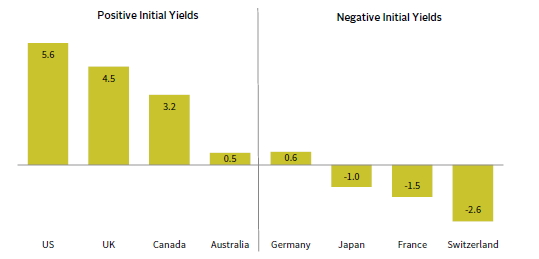
Since 1990, DM sovereign bonds have consistently appreciated during major global equity market sell-offs. Both US Treasuries and global sovereign bonds hedged to US dollars had positive returns in all 14 total global equity market corrections (defined as 10% price declines) over this period. 1 Their median returns in these corrections were 4.4% and 3.1%, 2 respectively. However, with most nominal DM sovereign bond yields near or below zero, DM sovereign bonds likely have limited capacity to appreciate during future global equity market corrections given there is an effective lower bound below which nominal yields cannot fall, capping prospective returns. 3 As witnessed during the pandemic-induced sell-off in spring 2020, DM sovereign bond returns were flat-to-negative in markets where interest rates were already below zero heading into 2020 (Figure 1). US Treasuries held up, but likely have less potential upside going forward, given the Bloomberg Barclays US Treasury Index is yielding just 0.57% (compared to 1.80% heading into 2020).
FIGURE 1 DM SOVEREIGN BONDS WITH NEGATIVE INITIAL YIELDS PROVIDED POOR RETURNS DURING PANDEMIC SELL-OFF
February 12, 2020 – March 23, 2020 • Total Returns (%) • Local Currency
Sources: Bloomberg Index Services Limited, MSCI Inc., and Thomson Reuters Datastream. MSCI data provided “as is” without any express or implied warranties.
Notes: Data are daily. Data are represented by the country subcomponents of the Bloomberg Barclays Global Treasury Bond Index. The pandemic sell-off is represented by the peak-to-trough price decline of the MSCI All Country World Index between February 12, 2020, and March 23, 2020.
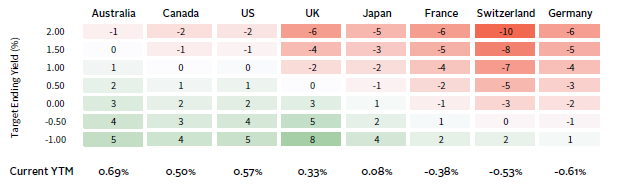
Low yields have also reduced DM sovereign bonds’ expected returns. From 1990 to 2020, US Treasuries returned 6% annualized, versus 7% annualized for global equities. Nominal US Treasury yields would need to fall to -1%, the lowest yield on record, over the next three years to generate comparable returns (Figure 2). If yields remain unchanged, then US Treasuries would return just 1% annualized, versus 6% annualized for global equities under relatively steady market conditions. If yields rose substantially, then the diversification characteristics of DM sovereign bonds would become more compelling, but returns would likely be negative over this period, creating a rather unappealing risk/return trade-off.
FIGURE 2 RETURN PROJECTIONS OF SELECT DM SOVEREIGN BONDS AT DIFFERENT TARGET ENDING YIELDS
As of December 31, 2020 • Three-Year Nominal AACR (%) • Local Currency
Sources: Bloomberg Index Services Limited, ICE BofA Merrill Lynch, and Thomson Reuters Datastream.
Note: DM sovereign bonds are represented by the country subcomponents of the Bloomberg Barclays Global Treasury Index.
Potential DM Sovereign Bond Alternatives
Given that DM sovereign bonds’ diversification characteristics are diminished, we explored whether there are alternatives to DM sovereign bonds that might better complement equities in a balanced portfolio in a low-rate environment. In a perfect world, the ideal alternative to DM sovereign bonds would offer the following three desirable diversification characteristics: (1) liquidity; (2) strong and consistent appreciation during equity sell-offs; and (3) reasonable expected returns. Unfortunately, this asset doesn’t exist today, but there are a range of assets worth considering across the risk spectrum that provide at least one, and in some cases, several of these characteristics to varying degrees. Since we are primarily interested in better protecting balanced portfolios during future periods of equity market stress, we focused on a handful of relatively liquid, “defensive” alternatives to DM sovereign bonds, including: cash, long DM sovereign bonds, inflation-linked bonds, gold, funding currencies, investment-grade (IG) credit, and select IG emerging markets (EM) local currency (LC) sovereign bonds.
Before discarding DM sovereign bonds completely, investors may want to consider replacing their existing sovereign bond allocations with cash or long sovereign bonds. Cash is one of the most reliable liquidity reserves, and unlike DM sovereign bonds, should hold its value across a variety of macro environments, including a sharp rise in interest rates and/or an inflation surprise. However, cash is unlikely to add much ballast during global equity market corrections (Figure 3). Cash also has low expected returns, but like many of the assets we are considering as alternatives to DM sovereign bonds, the opportunity cost of holding cash relative to DM sovereign bonds has improved where yields have fallen and yield curves have flattened (i.e., Europe). Investors may also want to consider extending duration, at least in markets where yield curves still have room to compress. The spread between 30- and five-year US Treasury yields is currently 129 basis points (bps), well above its historical average (82 bps). Long US Treasuries suffer from many of the same problems as US Treasuries but extending duration does at least increase the potential upside of US Treasuries in global equity market corrections. 4 Their median correction return is 11.8% since 1990. While long US Treasuries are more vulnerable to a sharp rise in interest rates, they do have a slightly more favorable return profile than US Treasuries (Figure 4), especially if central banks are determined to keep interest rates lower for longer.
FIGURE 3 DM SOVEREIGN BONDS AREN’T THE ONLY ASSETS WITH
APPEALING DEFENSIVE CHARACTERISTICS
Percent (%) • US Dollar
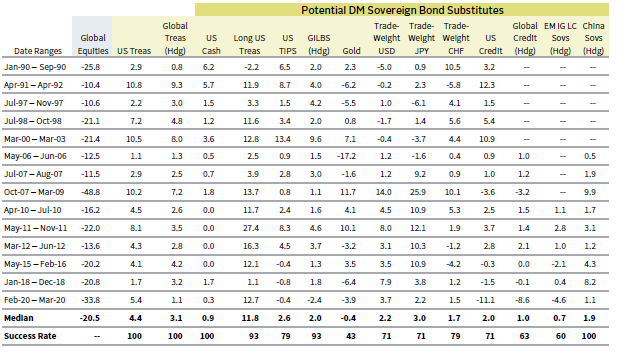
Sources: Bank of International Settlements, Bloomberg Index Services Limited, Bridgewater, Global Financial Data, Inc., ICE BofA Merrill Lynch, Intercontinental Exchange, J.P. Morgan Securities, Inc., MSCI Inc., Ned Davis Research, Inc., and Thomson Reuters Datastream. MSCI data provided “as is” without any express or implied warranties.
Notes: Data are daily if available. Monthly data is used when daily data is not available. Performance data are total returns, except for global equities, gold, trade-weighted USD, trade-weighted JPY, and trade-weighted CHF, which are price returns. Returns are AACRs for periods greater than one year. Global equity market drawdowns are defined as price declines equal to or greater than 10% for the MSCI All Country World Index in USD terms.
FIGURE 4 LONG US TREASURIES STILL HAVE AMPLE ROOM TO APPRECIATE
IN FUTURE EQUITY MARKET SELL-OFFS
As of December 31, 2020 • Three-Year Nominal AACR (%)
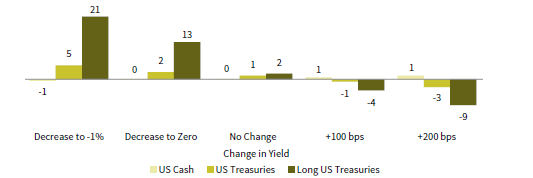
Sources: Bloomberg Index Services Limited, ICE BofA Merrill Lynch, and Thomson Reuters Datastream.
Inflation-linked bonds have also been helpful during prior global equity market corrections. US and global inflation-linked bonds hedged to US dollars had positive returns in most of the 14 global equity market corrections since 1990, and both had median correction returns of roughly 2%. That said, inflation-linked bonds are less liquid and a less reliable deflation hedge than DM sovereign bonds, and they have been prone to sharp, albeit brief, dislocations during periods of acute stress. Most notably, US inflation-linked bonds briefly trailed US Treasuries by as much as 17 percentage points during the 2007–09 global financial crisis (GFC). But, unlike nominal yields, real yields have no effective lower bound, making it easier for them to move deeper into negative territory. As a result, inflation-linked bonds offer more upside and less downside than DM sovereign bonds across a wider range of macro scenarios, excluding a Deflation Bust (Figure 5).
FIGURE 5 INFLATION-LINKED BONDS HAVE BETTER RETURN PROSPECTS IN MOST MACRO SCENARIOS
As of December 31, 2020 • Projected Three-Year Nominal AACR (%)

Source: Cambridge Associates LLC.
Gold has a reputation as the original safe haven. However, while it has outperformed DM sovereign bonds in the most extreme macro environments (i.e., 2007–09), gold has a less consistent track record of appreciating during periods of equity market stress than DM sovereign bonds. Gold has generated positive returns in less than half of global equity market corrections since 1990. Additionally, gold is volatile, and vulnerable to changes in sentiment and a sharp rise in real interest rates. The case for gold is threefold: (1) the opportunity cost relative to DM sovereign bonds has improved as yields have fallen; (2) in contrast to DM sovereign bonds, gold prices still have capacity to significantly appreciate during periods of market stress; and (3) gold prices could remain well-supported in an environment of low rates, accommodative monetary policy, and elevated government debt levels.
Another option is the foreign exchange (FX) market. The FX market is highly liquid and there are some currencies that have a reputation for defensiveness in adverse macro conditions. The US dollar, Japanese yen, and Swiss franc have all tended to appreciate somewhat consistently during global equity market corrections, and they have median correction returns between 1.7% and 3.0%. Yet, defensive currencies have their drawbacks. They are typically negative carry trades (i.e., there is a cost to implement) and they can struggle when equities strengthen (Figure 6). Moreover, any one currency’s performance relative to another currency in a crisis can depend on several factors, including: the source and size of the shock, current valuations and investor positioning, and relative policy responses. The cost of implementing most defensive FX positions and their opportunity cost versus DM sovereign bonds have declined as yields have fallen globally and yield differentials across countries have narrowed. Investors with greater exposure to more cyclical currencies may want to consider selectively adding defensive FX exposure by adjusting currency hedge ratios.
FIGURE 6 DEFENSIVE CURRENCIES HAVE BEEN A DRAG ON PORTFOLIO PERFORMANCE IN UP EQUITY MARKETS
January 31, 1990 – November 30, 2020 • AACR (%)

Sources: Bank for International Settlements, MSCI Inc., and Thomson Reuters Datastream. MSCI data provided as is without any express or implied warranties.
Notes: Data are monthly. Up equity months and down equity months represent months when global equity returns were positive and negative, respectively. Equity data reflect the MSCI All Country World (Gross) Index through December 31, 2000 and the MSCI All Country World (Net) Index thereafter.
IG credit and select IG EM LC sovereign bonds have less favorable diversification characteristics than DM sovereign bonds historically but are worth considering as alternatives given their yield advantage. Currently, global IG credit and US IG credit offer a 75 bp and 110 bp spread over comparable sovereign bonds, respectively. The primary case for the future defensive effectiveness of IG credit rests mostly on the expectation that central banks will continue to backstop the market, as they did in 2020, during future periods of market stress. Like many “temporary” policies introduced during crisis, this could become standard practice in many DM countries, but it is not guaranteed. In our view, low base rates and weak fundamentals make IG credit a less than ideal alternative to DM sovereign bonds, despite their yield advantage. We are more bullish on select IG EM LC sovereign bonds. There are several high-quality EM countries with positive economic fundamentals and positive real yields. Chinese sovereign bonds, for example, are yielding 3.19% in nominal terms, well above local inflation rates. Furthermore, some IG EM LC sovereign bonds have become more defensive following a shift in several of these countries to lower inflation, more credibly independent central banks, and the ability to engage in countercyclical monetary policy. Chinese sovereign bonds (hedged to US dollars) have tracked US Treasuries quite closely since 2004 and have produced positive returns in each of the nine global equity market corrections over this period (Figure 7).
FIGURE 7 CHINESE SOVEREIGN BONDS HAVE TRACKED US TREASURIES
FAIRLY CLOSELY HISTORICALLY
December 31, 2004 – December 31, 2020 • Trailing 12-Month Performance (%) • US Dollar
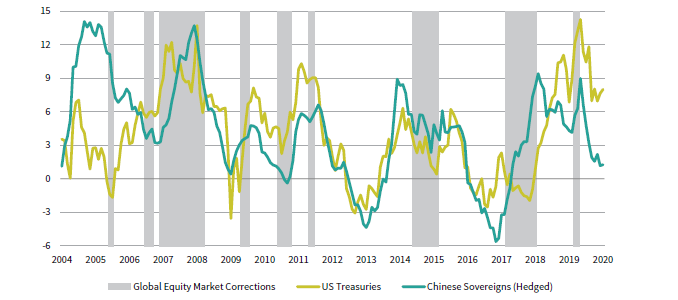
Sources: Bloomberg Index Services Limited, MSCI Inc, and Ned Davis Research, Inc. MSCI data provided “as is” without any express or implied warranties.
Notes: US Treasuries represented by the Bloomberg Barclays US Treasury Bond Index. China Bonds represented by Bloomberg Barclays China Treasury and Policy Bank Bond Index. Global equity bear markets are defined as price declines equal to or greater than 10% for the MSCI All Country World Index.
The Case for a Defensive Basket
The above analysis suggests that there are no perfect substitutes for DM sovereign bonds. Each alternative we reviewed has benefits and drawbacks. However, we found that we could construct a diversified basket of defensive assets that has provided comparable diversification characteristics to DM sovereign bonds historically, while offering comparable-to-better performance prospects under a range of future scenarios. We constructed defensive baskets for both US- and Euro Area—based investors. 5 The baskets are equal-weighted based on their volatility relative to US Treasuries and global sovereign bonds hedged to euros, respectively. 6 Looking at Figures 8 and 9, we can see that both the US defensive basket and the EA defensive basket have tracked DM sovereign bonds remarkably well historically, and had similar return and risk characteristics during both up and down equity markets.
FIGURE 8 A DEFENSIVE BASKET HAS COMPARED FAVORABLY RELATIVE TO
US TREASURIES HISTORICALLY
December 31, 2003 – December 31, 2020 • December 31, 2003 = 100 • US Dollar
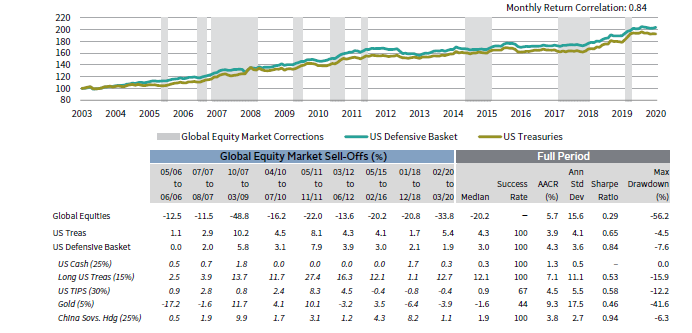
Sources: Bloomberg Index Services Limited, ICE BofA Merrill Lynch, Intercontinental Exchange, MSCI Inc., Ned Davis Research, Inc., and Thomson Reuters Datastream. MSCI data provided “as is” without any express or implied warranties.
Notes: Chart data are monthly. Table data are daily except for China Sovs., which are monthly from September 30, 2006, through November 30, 2016 and daily thereafter. Performance data are total returns, except for global equities and gold, which are price returns. Returns are AACRs for periods greater than one year. Global equity bear markets are defined as price declines equal to or greater than 10% for the MSCI All Country World Index in USD terms.
FIGURE 9 A DEFENSIVE BASKET EXHIBITS SIMILAR CHARACTERISTICS FOR
NON-US INVESTORS
August 31, 2006 – December 31, 2020 • August 31, 2006 = 100 • Euros
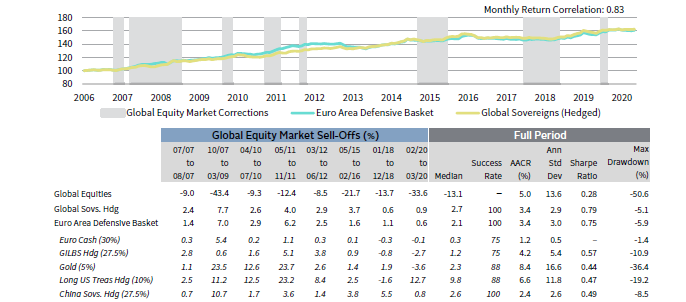
Sources: Bloomberg Index Services Limited, ICE BofA Merrill Lynch, Intercontinental Exchange, MSCI Inc., Ned Davis Research, Inc., and Thomson Reuters Datastream. MSCI data provided “as is” without any express or implied warranties.
Notes: Chart data are monthly. Table data are daily, except for China Sovs. Hedged, which are monthly from September 30, 2006, through November 30, 2016, and daily thereafter. Performance data are total returns, except for global equities and gold, which are price returns. Returns are AACRs for periods greater than one year. Global equity bear markets are defined as price declines equal to or greater than 10% for the MSCI All Country World Index in USD terms.
While it is encouraging to see that both defensive baskets hold up relatively well versus DM sovereign bonds on a historical basis, we must be careful about anchoring too much to history. Given the current low-rate environment, it is likely unreasonable to expect either DM sovereign bonds or the defensive basket to continue to provide the same attractive diversification characteristics as they did in the past. However, in our view, a defensive basket looks more compelling today given the reduction in the opportunity cost of most of the assets included in our basket relative to DM sovereign bonds and extreme DM sovereign bond valuations. Unlike DM sovereign bonds, most of the alternative defensive assets included in our basket are not as constrained by low nominal DM sovereign bond yields. At the margins, this increases the likelihood that a defensive basket outperforms DM sovereign bonds during future periods of equity market stress. There is also a case for a defensive basket given the elevated level of macro uncertainty. According to our scenario-based return projections, the US defensive basket offers comparable-to-better return prospects relative to US Treasuries under a range of future macro scenarios (Figure 10). The only environment US Treasuries are expected to outperform is in a deflationary bust. And even in that tail risk scenario, the US defensive basket holds up relatively well versus US Treasuries.
FIGURE 10 A DEFENSIVE BASKET HAS BETTER RETURN PROSPECTS IN MOST MACRO SCENARIOS
As of December 31, 2020 • Projected Three-Year Nominal AACR (%)
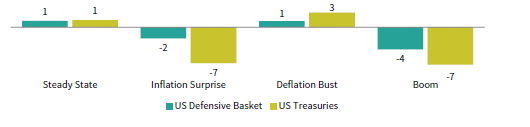
Source: Cambridge Associates LLC.
Notes: US Defensive Basket consists of 30% US TIPS, 25% US Cash, 25% China Sov. Bonds (Hedged), 15% Long US Treasuries, and 5% Gold.
An additional benefit of an equal risk–weighted defensive basket is that it also limits the impact of any one macro scenario. Investors with a strong macro view can also adjust the basket to better reflect these views. If inflation is a concern, investors can tilt toward inflation-linked bonds and/or gold to help protect against this risk but accept that doing so would have a cost in a deflationary environment. In our view, it is better to prepare for a variety of environments given the difficulty associated with correctly predicting macro outcomes. Ultimately, investors need to understand their liquidity requirements and volatility tolerance, and then evaluate the trade-offs of different defensive baskets relative to DM sovereign bonds.
Conclusion
On its own, substituting DM sovereign bonds with a defensive basket does not solve the problems created by low yields. Our analysis suggests that a diverse basket of defensive assets has provided similar diversification characteristics to DM sovereign bond historically, but the main attribute of the defensive basket is that it is better equipped to protect portfolios under a variety of future macro scenarios than low-yielding DM sovereign bonds. However, like DM sovereign bonds alone, poor long-term return prospects remain. In our companion paper, “VantagePoint: Modern Portfolio Diversification,” we discuss strategies that can improve the return prospects of the defensive basket without meaningfully deteriorating its diversification capabilities. We also discuss strategies for improving the return prospects and diversification characteristics of a simple stock/bond portfolio and the average allocation of endowed institutions.
Asset Class Representation
Asset classes are represented by the following indexes: Bloomberg Barclays US Treasury Index, Bloomberg Barclays Global Treasury Index, BofA Merrill Lynch 0-3 Month Treasury Bills Index, Bloomberg Barclays Long-Term US Treasury Bond Index, Gold Bullion London Market closing price, Bloomberg Barclays US TIPS Index, Bloomberg Barclays World Government Inflation-Linked Bond Index, BIS USD Effective Exchange Rate Narrow Index- Nominal, BIS JPY Effective Exchange Rate Narrow Index- Nominal, BIS CHF Effective Exchange Rate Narrow Index- Nominal, Bloomberg Barclays US Credit Index, Bloomberg Barclays Global Credit Index, J.P. Morgan GBI-EM Global Diversified IG Index, and Bloomberg Barclays China Treasury + Policy Bank Index.
Return Scenario Assumptions Methodology
Return projections are based on three-year discounted cash flow models, which are calculated using multiple regression models. The Inflation Surprise scenario assumes inflation increases to an average of 3.5% over three years, nominal rates rise to 5%, and economic growth is flat; the Deflation Bust scenario assumes inflation falls to an average of -1% over three years, economic growth contracts -2%, and nominal yields fall to 0%; and the Boom scenario assumes inflation averages 2%, nominal yields increase to 5%, and the economy grows 2%. The Steady State scenario assumes inflation averages of 2% over three years, nominal rates are 1%, and economic growth is 3%. Our return estimates under steady state conditions assume current valuations and trendline fundamentals, with no assumption of valuation mean reversion.
Chinese Return Projections
For China, no roll return assumptions were made. The deflation bust terminal yield was 0% (standard Deflation Bust assumption) + 95th percentile Bloomberg Barclays China Treasury + Policy Bank Index spread over Treasuries. Cost of hedging is based on interest rate differentials, which are derived using Oxford Economics forecasts and terminal yield assumptions.
Fixed Income Return Projections
Our fixed income return projections estimate the total nominal return an investor would earn from holding a market index over a specific time horizon and reinvesting the coupons, given assumptions about the movements in the risk-free rate and roll return. Each portfolio is assumed to have a constant maturity profile where a portfolio of newly issued bonds is purchased on Day 1, held for one year, and then sold at the end of Year 1.
Gold Return Projections
Gold regression is based on change in CPI rate, percent change in trade-weighted dollar, change in real ten-year yield, and change in GDP growth (R2=50%). The change in CPI rate is transformed using a polynomial trend line equation because gold prices benefit from changes in purchasing power of the dollar in both directions, though gold does especially well in hyperinflationary environments (dollar debasement).
Index Disclosures
BIS Effective Exchange Rate Indexes
The BIS effective exchange rate (EER) indexes cover 60 economies, including individual Euro Area countries and, separately, the Euro Area as an entity. The most recent weights are based on trade in the 2014–16 period, with 2010 as the indexes’ base year. Broad indexes cover 60 economies. Narrow indexes include 26 and 27 economies for the nominal and real indexes, respectively. The BIS uses, whenever possible, the published USD exchange rates and consumer prices as input to the EER estimates.
Bloomberg Barclays China Treasury + Policy Bank Index
The Bloomberg Barclays China Treasury + Policy Bank Index reflects the performance of yuan-denominated fixed-rate treasuries and policy bank bonds with a minimum maturity of one year.
Bloomberg Barclays Global Credit Index
The Index measures the performance of the global investment grade, fixed-rate bond markets. The benchmark includes government, government-related, and corporate bonds, as well as asset-backed, mortgage-backed, and commercial mortgage-backed securities from both developed and emerging markets issuers.
Bloomberg Barclays Global Treasury Index
The Bloomberg Barclays Global Treasury Index tracks fixed-rate, local currency government debt of investment- grade countries, including both developed and emerging markets. The index represents the treasury sector of the Global Aggregate Index and contains issues from 37 countries denominated in 24 currencies.
Bloomberg Barclays US Credit Index
The Bloomberg Barclays US Credit Index measures the investment-grade, USD–denominated, fixed-rate taxable corporate and government-related bond markets. Index history is available back to 1973.
Bloomberg Barclays US TIPS Index
The index includes all publicly issued, US Treasury inflation-protected securities that have at least one year remaining to maturity, are rated investment grade, and have $250 million or more of outstanding face value.
Bloomberg Barclays US Treasury Index
The Bloomberg Barclays US Treasury Index measures USD–denominated, fixed-rate, nominal debt issued by the US Treasury. Treasury bills are excluded by the maturity constraint, but are part of a separate Short Treasury Index. STRIPS are excluded from the index because their inclusion would result in double-counting. The US Treasury Index was launched on January 1, 1973.
Bloomberg Barclays World Government Bond Inflation Index
The Bloomberg Barclays World Government Inflation-linked Bond index reflects the performance of investment-grade inflation-linked bonds issued by governments of developed countries with a minimum time to maturity of 1 year and minimum issuer size of USD 2 billion.
BofA Merrill Lynch 0-3 Month Treasury Bill Index
The index is an unmanaged market index of US Treasury securities maturing in 90 days that assumes reinvestment of all income.
J.P. Morgan Euro Cash Index
The index measures the total return performance of three-month USD–denominated euro deposits.
J.P. Morgan GBI-EM Global Diversified Index
The J.P. Morgan GBI EM Global Diversified Index is a comprehensive global, local, emerging markets index that consists of regularly traded, liquid, fixed-rate, domestic currency government bonds and includes only the countries that give access to their capital market to foreign investors (excludes China and India). The index is market capitalization–weighted, with a cap of 10% to any one country.
London Bullion Market Association Gold Price
The London Bullion Market Association (LBMA) Gold Price was launched on March 20, 2015, to replace the historic London Gold Fix. ICE Benchmark Administration (IBA) provides the auction platform, methodology as well as overall independent administration and governance for the LBMA Gold Price, with the LBMA holding the intellectual property rights. The price continues to be set twice daily (at 10:30 and 15:00 London GMT) in US dollars.
MSCI All Country World Index
The MSCI ACWI is a free float–adjusted, market capitalization–weighted index designed to measure the equity market performance of developed and emerging markets. The MSCI ACWI consists of 23 developed and 26 emerging markets country indexes. The developed markets country indexes included are: Australia, Austria, Belgium, Canada, Denmark, Finland, France, Germany, Hong Kong, Ireland, Israel, Italy, Japan, the Netherlands, New Zealand, Norway, Portugal, Singapore, Spain, Sweden, Switzerland, the United Kingdom, and the United States. The emerging markets country indexes included are: Argentina, Brazil, Chile, China, Colombia, Czech Republic, Egypt, Greece, Hungary, India, Indonesia, Korea, Malaysia, Mexico, Pakistan, Peru, the Philippines, Poland, Qatar, Russia, Saudi Arabia, South Africa, Taiwan, Thailand, Turkey, and the United Arab Emirates.
MSCI World Index
The MSCI World Index represents a free float–adjusted, market capitalization–weighted index that is designed to measure the equity market performance of developed markets. As of December 2017, it includes 23 developed market country indexes: Australia, Austria, Belgium, Canada, Denmark, Finland, France, Germany, Hong Kong, Ireland, Israel, Italy, Japan, Netherlands, New Zealand, Norway, Portugal, Singapore, Spain, Sweden, Switzerland, the United Kingdom, and the United States.
Footnotes
- We included both corrections and bear markets (20% price declines) in our analysis to increase our sample size, but acknowledge the utility of protection is greater during more severe sell-offs.
- Returns are annualized for corrections that lasted longer than one year.
- The effective lower bound refers to the level at which lower interest rates become countercyclical. Recent estimates by Princeton University suggest the effective lower bound is somewhere between -1% and -2%, but there is a high degree of uncertainty around this range and evidence it could vary by region. Please see Marcus K. Brunnermeier and Yann Koby, “The Reversal Interest Rate,” Working Paper, Princeton University, 2019.
- One approach might be to sell Treasuries and buy back a duration-neutral, smaller position in long US Treasuries, using the rest of the proceeds to adjust across the rest of the portfolio (e.g., allocating to higher returning equities).
- We looked at a Euro Area defensive basket to provide a perspective from a region with negative yields.
- The baskets are equal-weighted by active risk relative to sovereign bonds. Active risk combines both tracking error (standard deviation of excess returns over sovereign bonds) and capital allocation weight in the portfolio, to quantify a potential impact on relative returns versus sovereign bonds in basis points.
TJ Scavone - T.J. is a Senior Investment Director in the Capital Markets Research Group at Cambridge Associates.
About Cambridge Associates
Cambridge Associates is a global investment firm with 50+ years of institutional investing experience. The firm aims to help pension plans, endowments & foundations, healthcare systems, and private clients achieve their investment goals and maximize their impact on the world. Cambridge Associates delivers a range of services, including outsourced CIO, non-discretionary portfolio management, staff extension and alternative asset class mandates. Contact us today.