Finding Credit Opportunities Amid the Coronavirus Crisis


The coronavirus plunged the global economy into a deep recession by the end of first quarter 2020, triggering concern over a surge in corporate defaults. Recent monetary and fiscal stimulus has allowed a rebound in credit assets ranging from high-yield (HY) bonds to highly rated asset-backed securities (ABS), but other markets remain dislocated. Attractive opportunities remain in credit, but investors may need a different playbook than the one developed during the last financial crisis. The forceful government response has addressed many liquidity issues, but a prolonged recession and changing consumer habits could eventually bring solvency questions to the forefront.
This paper provides an overview of recent developments in higher-beta US credit markets and highlights investment opportunities. Rather than start with simplicity, we believe investors should lean into complexity and look for private credit funds whose managers have the right skill set to play the unfolding waves of corporate distress and bankruptcies. On the liquid credit side, securities, such as structured credit, that have been overlooked by US Federal Reserve programs will also offer rich opportunities.
Coronavirus Devastates Economy and Markets, But Not Uniformly
As confirmed cases of coronavirus soared globally in March, authorities forced businesses to close and enforced quarantines, bringing economic activity to a sudden stop. Initial estimates indicate US GDP contracted by 4.8% (annualized) in first quarter 2020, and an even steeper decline is expected in the second quarter. Manufacturing data has fallen to levels last seen during the global financial crisis (GFC), and unemployment rates are rising to levels last seen during the Great Depression.
US and global authorities have raced to roll out fiscal and monetary stimulus in response to the crisis. In late March, President Trump signed the Coronavirus Aid, Relief, and Economic Security (CARES) Act, which includes more than $2 trillion of aid for households, businesses, and local governments. The Fed also unveiled unprecedented support for corporate credit markets in late March and early April, adding to large interventions already underway in the Treasury and mortgage–backed securities markets. Since year-end, the Fed’s balance sheet has increased by around 65% to a whopping $7 trillion. Not to be outdone, in recent weeks the European Central Bank has established its own €750 billion bond-buying program, and the Bank of Japan has dispensed with purchase limits entirely.
Investors fled risk assets as the pandemic initially unfolded. Global equities fell more than 30% from peak-to-trough in late March, while assets including HY bonds and leveraged loans also suffered double-digit declines (Figure 1). Since then, government stimulus has helped many assets pare some losses, but the dispersion of recoveries reflects uncertainty about the timelines for the economic rebound, as well as perceived winners and losers from government programs. Large-cap stocks had fallen around 8% through mid-May given exposure to “winners” from social distancing and quarantines (think IT and communications stocks), while small-cap stocks with their higher debt levels and exposure to reduced consumer spending were down around 18%. Similar trends were apparent in credit, with investment-grade (IG) corporate bonds up 2% year-to-date and HY bonds down 6%. Emerging markets debt, despite its ineligibility for Fed purchases and the perception that local policymakers have fewer options to stimulate growth, has held up reasonably well, with hard currency EM corporate debt, for example, down less than 3% by late May.
FIGURE 1 CUMULATIVE WEALTH OF VARIOUS INDEXES
December 31, 2019 – May 25, 2020 • December 31, 2019 = 100 • US Dollar
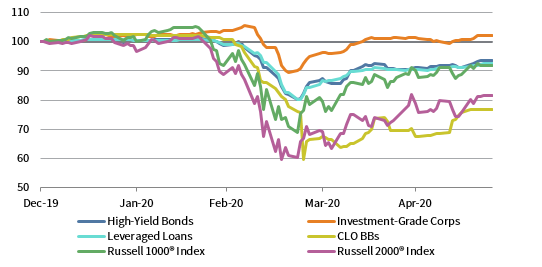
Sources: Bloomberg Index Services Limited, Credit Suisse, FTSE Russell, and J.P. Morgan Securities, Inc.
Notes: Cumulative wealth data are daily total returns net of dividend taxes. High-Yield Bonds are represented by Bloomberg Barclays US Corporate High Yield Index, Investment-Grade Corps by Bloomberg Barclays US Corporate Bond Index, Leveraged Loans by Credit Suisse Leveraged Loan Index, and CLO BBs by J.P. Morgan Collateralized Loan Index.
Credit Spreads Fall After Fed Intervention
The Fed detailed several facilities to help shore up corporate credit markets in late March and early April. Under the Primary Market Corporate Credit Facility (PMCCF) and Secondary Market Corporate Credit Facility (SMCCF) programs, the Fed can leverage Treasury funding to potentially purchase up to $750 billion of IG and HY debt (including downgraded “fallen angels” and junk bond ETFs). The Term Asset Backed Security Loan Facility (TALF) offers investors up to $100 billion of leverage to buy AAA-rated ABS. Small- and mid-sized businesses weren’t forgotten; the $600 billion Main Street Lending program funds loans up to $200 million to companies with up to $5 billion in revenue.
Spreads fell dramatically, especially for eligible assets, once these programs were announced. Spreads on HY bonds declined from around 1,100 basis points (bps) in late March to finish April at 744 bps, while IG spreads also declined around 150 bps. The expanded TALF program helped push spreads on eligible AAA-rated ABS like collateralized loan obligation (CLO) liabilities from more than 500 bps to around 200 bps. Assets left out of various government safety nets continue to have elevated spreads, especially where doubts remain about deteriorating fundamentals. BB-rated CLO liabilities carried a spread of around 1,500 bps at the end of April, and spreads for various types of private label (non-government guaranteed) mortgage-backed bonds were well above recent averages (Figure 2).
FIGURE 2 DEBT MARKETS BY YIELD, PERFORMANCE, AND MARKET VALUE
As of April 30, 2020 • US$ Billions
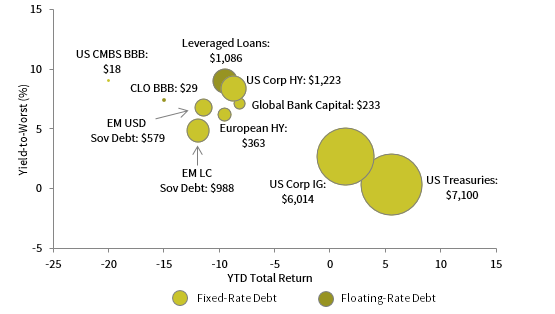
Sources: Bloomberg Index Services Limited, Credit Suisse, and J.P. Morgan Securities, Inc.
Notes: The area of each bubble represents the current market value of each index, shown in USD billions. Global Bank Capital is represented by the Bloomberg Barclays Global Contingent Capital Index, CLO BBB by the J.P. Morgan CLO BBB Index, US CMBS BBB by the Bloomberg Barclays US CMBS Investment Grade Index, US Corp IG by the Bloomberg Barclays US Corporate Bond Index, EM LC Sov Debt by the J.P. Morgan GBI-EM Global Diversified Index, EM USD Sov Debt by the J.P. Morgan EMBI Global Diversified Index, European HY by the Bloomberg Barclays Pan-European High Yield Index, Leveraged Loans by the Credit Suisse Leveraged Loan Index, US Corp HY by the Bloomberg Barclays US Corporate High Yield Index, and US Treasuries by the Bloomberg Barclays US Intermediate Treasury Index. Total return data for EM LC Sovereign Debt are in USD terms. Yield for the Credit Suisse Leveraged Loan Index is calculated as the three-month LIBOR plus three-year discount rate.
The $3 trillion BBB-rated slice of the IG corporate bond market has held up well, despite longstanding fears that an increase in rating downgrades might trigger forced sales, disrupting the $1.2 trillion HY market. A record $170 billion of bonds have lost their investment-grade ratings in 2020, becoming “fallen angels,” and analysts estimate a total of $300 billion could suffer this fate by the end of the year. Yet, thus far these downgrades have not put pressure on the overall HY market, in no small part due to the Fed backstops recently put into place. The 264 bp spread on BBB-rated bonds at the end of April was in the 90th percentile of historical levels, similar to the percentile of the overall IG and HY indexes. Fallen angel performance varies; for example, bonds from hard-hit transportation companies have experienced larger declines than those of less cyclical consumer staple companies.
What’s Priced In?
Current spread levels on HY bonds and loans have historically been associated with high absolute and relative returns (Figure 3). Specifically, the current 744 bp HY option-adjusted spread (OAS) has historically been associated with a subsequent annualized three-year return of around 12%, well above the 8% long-term average return for the asset. The catch is that today’s underlying Treasury yields, which hover near record lows, depress absolute yields and likely mean today’s HY returns will be lower.
FIGURE 3 HIGH-YIELD OPTION-ADJUSTED SPREAD VS SUBSEQUENT 3-YR AACR
January 31, 1987 – April 30, 2020
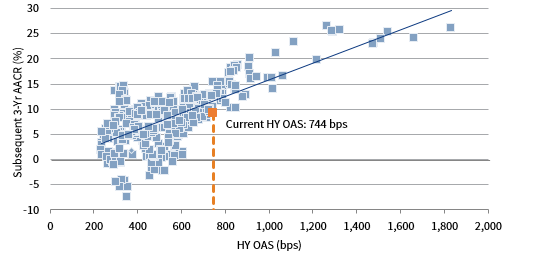
Source: Bloomberg Index Services Limited.
Future HY returns will also be impacted by trends in corporate fundamentals and the corresponding default risks. The consensus now expects US GDP to shrink by almost 6% in 2020 before rebounding next year, a contraction deeper in depth but shorter in duration to that seen during the GFC. HY and loan default rates are expected to rise, with Standard & Poor’s expecting around 10% of US speculative-grade credits to default by the end of first quarter 2021 and Moody’s coming in even higher at 14%. Some sell-side firms are more optimistic given stimulus measures, which may not yet be reflected in rating agency forecasts. These forecasts compare to peaks in loan and HY defaults during the GFC of around 12% and 16%, respectively (Figure 4).
FIGURE 4 US HIGH-YIELD AND LOAN DEFAULT RATES
January 31, 1998 – April 30, 2020 • Percent (%)
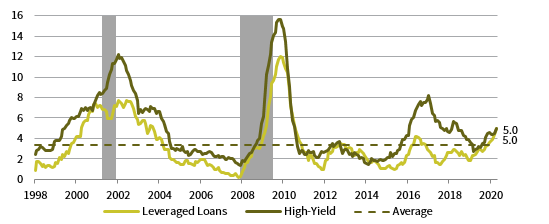
Sources: Moody’s Investor Services and National Bureau of Economic Research.
Notes: All data are based on trailing 12 months. Gray bars represent NBER-defined US recessions.
The increasing share of CCC-rated assets in loan and bond indexes reflects this rising default risk; historically, around 25% of assets rated CCC (or below) by Standard & Poor’s have defaulted within one year. Around 11% of the JPM HY Index carries a CCC rating from at least one rating agency, and the share is similar for loans. This share may rise further in the months ahead as weakening fundamentals lead to increased downgrades. 1 CLO portfolios reflect this stress, with the share of CCC assets held by CLOs (the largest loan buyer) tripling since the start of the year to around 12% and the 25% share rated B- suggesting it will rise further.
Current index statistics mask a wide dispersion of corporate health across sectors; the trailing HY default rate of 5% falls in half if energy defaults are excluded. Still, a growing number of sectors appear vulnerable, including leisure, retail, and transportation. In contrast, sectors like cable, utilities, and food production seem relatively more insulated from coronavirus-related quarantines. For some companies, the coronavirus has simply piled on to pre-existing pressures on fundamentals (e.g., long-suffering retail and telecommunications firms).
Corporate balance sheets were in reasonable shape heading into the current recession, but few companies were prepared for sudden revenue drop-offs. Historically low interest rates and credit spreads flattered debt coverage ratios (EBITDA/interest payments), while leverage (debt/EBITDA) was in line with historical averages. The recession will mean these ratios deteriorate, but the key questions are its length and severity. Until the economy rebounds, companies are relying on cash reserves and revolving lines of credit, but these are finite. Aside from banks and the capital markets, some mid-sized borrowers may benefit from Fed initiatives, including the Main Street Lending program. Many companies are also cutting costs and exploring alternative sources of capital (e.g., debt secured by assets or by future expected cash flows).
The Investor Playbook
When considering existing or new allocations, investors may want to demand an additional margin of safety given the unpredictable nature of the coronavirus outbreak and long-term impacts on economic activity. Given widespread government interventions, this margin is lacking in assets like IG corporate bonds (which now yield sub-3%), AAA-rated ABS (many of which yield sub-2%), and arguably even some highly rated HY bonds (e.g., BB-rated bonds yielding sub-5%). Overall, HY index spreads of 744 bps may generate a small positive return if default forecasts prove prescient and recoveries are close to historical averages, but better opportunities exist in assets that are ineligible for Fed purchases. Leveraged loans (which yield more than 9%), lower-rated structured credit (e.g., BB-rated CLO mezzanine with spreads around 1,500 bps), and some emerging markets sovereigns all offer better value. An active approach is warranted to navigate deteriorating fundamentals. 2
Trading-oriented strategies attempting to make quick profits from forced selling may be less successful this time around. Leveraged players, such as banks, hedge funds, and special investment vehicles, play a smaller role in credit markets than before, and with less leverage. While some mutual funds and hedge funds saw significant redemptions in March, much of this initial dislocation has already eased and inflows have returned across credit strategies. Rating downgrades also do not seem to have generated the “baby thrown out with the bathwater” situations as some tactical investors had hoped, though newly issued debt from highly cyclical companies like airlines, transportation, and leisure firms has often carried double-digit yields.
The structured credit market (both the vehicles themselves and underlying investors including hedge funds) are one exception to this rule. Some highly levered REITs have been forced to sell assets, and in some cases, the reductions in balance sheet have been dramatic (30% or more). Where asset sales have depleted capital, rescue finance opportunities have arisen. However, the overall scale of the opportunity has been limited for various reasons, including the relaunch of TALF, as well as the fact that CLOs are not mark-to-market vehicles and thus are not forced sellers of the underlying loans. That said, the inability or unwillingness of CLOs, which have breached “overcollateralization tests” (due to growing holdings of CCC-rated loans), to invest in lower-rated assets reduces competition and may create an opportunity for some credit hedge and lock-up funds.
As we move from dislocation to the distressed opportunity set, investors may also need a new approach. Massive government intervention means the amount of debt trading at distressed prices has fallen by around 50% in recent weeks (Figure 5). The ratio seems likely to again spike higher, but a straight 2008–09 replay seems less likely, given massive fiscal and monetary stimulus, as well as less forced selling. Still, even if history does not repeat itself, it may rhyme, and corporate fundamentals have deteriorated faster and more severely than during the GFC. In some cases, revenues have declined 90%+. Distressed debt funds are thus still finding plenty of opportunities, but managers able to navigate restructurings are likely to outperform those with shorter time horizons. Further, for some funds, the need to provide quarterly liquidity to investors may reduce their ability to wait for fundamentals to improve or ride out market volatility, limiting their potential returns.
FIGURE 5 US HIGH-YIELD INDEX DISTRESSED RATIO
January 31, 2005 – April 30, 2020 • Percent (%)
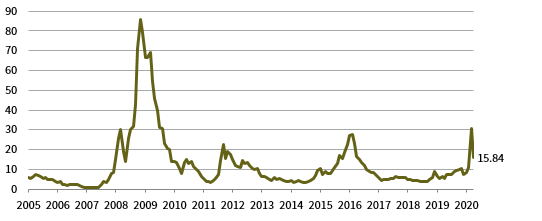
Source: ICE BofA Merrill Lynch.
Note: Distressed ratio chart shows percentage of high-yield bonds trading 1,000 or more basis points over the risk-free rate.
Investors able to commit capital for longer timeframes should consider lock-up funds that better align their liquidity with the current opportunity set in providing rescue finance. Many companies have solid, long-term business models, though their balance sheets are damaged by the recession. Credit opportunity and distressed funds can provide loans to shore up these balance sheets while obtaining covenants and seniority to help reduce downside risk. Experienced private credit managers can originate their own deals, and often leverage industry expertise and expert networks to help improve company performance, a larger toolbox than possessed by some short-term investors. If conditions worsen, experienced distressed funds can provide debtor-in-possession finance or supervise a restructuring process and have the flexibility/time horizon to convert debt into equity participation. As the cycle matures and conditions stabilize, some of these funds will shift focus and help borrowers replace short-term fixes (revolvers, government loans, secured debt, etc.) with longer-term solutions.
Given considerable uncertainty about the duration of the current downturn and the opportunities it will present, multi-strategy private credit funds that have the skillsets to rotate and underwrite many kinds of risk are an attractive investment option. Some of these funds will participate in rescue finance and engage in traditional distressed opportunities, but also have the technical ability to underwrite structured credit. Others have recently examined the mortgage REITs that have unwound positions, and further opportunity could arise as rent collection declines across a wide swath of property types. Funds currently eyeing the distressed opportunity are also interested in third-party CLO debt, given their familiarity with the underlying borrowers and in some cases their management of a separate CLO business. These funds will compare potential risk-adjusted returns across different assets (liquid, distressed, structured credit, etc.) and make the relative value decision for limited partners.
Conclusion
Credit markets have been volatile during the beginning of 2020, and the coronavirus pandemic has the potential to undermine corporate fundamentals for some time. The scale and speed of the government’s response means some liquidity issues have already been addressed, but the downturn in company fundamentals is in its early stages. While spreads have tightened for many bonds, trading-oriented credit funds can still find attractively priced assets, especially in loans and structured credit instruments that are not being directly purchased by the Fed. However, they must be mindful of the liquidity promised to their underlying investors, as selling assets at depressed prices to meet redemption requests will limit their opportunity set and, thus, returns. Lock-up credit funds will see the richest opportunity set, especially those that can move nimbly from playing today’s dislocation to providing rescue finance for companies most impacted by the recession. We are also constructive on multi-strategy credit opportunity funds that can harvest a variety of opportunities, including publicly traded bonds and loans, rescue finance situations, and dislocated structured finance assets.
INDEX DISCLOSURES
Bloomberg Barclays Global Contingent Capital Index
The Barclays Global Contingent Capital Index includes hybrid capital securities with explicit equity conversion or writedown loss absorption mechanisms that are based on an issuer’s regulatory capital ratio or other explicit solvency-based triggers.
Bloomberg Barclays Pan-European High Yield Index
The Bloomberg Barclays Pan-European High Yield Index measures the market of non–investment-grade, fixed-rate corporate bonds denominated in the following currencies: euro, pound sterling, Danish krone, Norwegian krone, Swedish krona, and Swiss franc. Inclusion is based on the currency of issue, and not the domicile of the issuer.
Bloomberg Barclays US Corporate High Yield Index
The Bloomberg Barclays US Corporate High Yield Index measures the US corporate market of non-investment-grade, fixed-rate corporate bonds. Securities are classified as high yield if the middle rating of Moody’s, Fitch, and S&P is Ba1/BB+/BB+ or below.
Bloomberg Barclays US Corporate Bond Index
The Bloomberg Barclays US Corporate Bond Index measures the investment grade, fixed-rate, taxable corporate bond market. It includes USD-denominated securities publicly issued by US and non-US industrial, utility, and financial issuers. The US Corporate Index is a component of the US Credit and US Aggregate Indices, and provided the necessary inclusion rules are met, US Corporate Index securities also contribute to the multi-currency Global Aggregate Index.
Bloomberg Barclays US CMBS Investment Grade Index
The Bloomberg Barclays US CMBS Investment Grade Index measures the market of conduit and fusion CMBS deals with a minimum current deal size of $300 million.
Bloomberg Barclays US Intermediate Treasury Index
The Bloomberg Barclays US Intermediate Treasury Index measures US dollar-denominated, fixed-rate, nominal debt issued by the US Treasury with maturities of 1 to 9.9999 years to maturity.
Credit Suisse Leveraged Loan Index
Credit Suisse Leveraged Loan Index is a market-weighted index that tracks the performance of institutional leveraged loans.
J.P. Morgan Collateralized Loan Obligation Index (CLOIE)
CLOIE offers total returns and analytics based on observable pricings of a representative pool of bonds following a stated methodology, and is published daily. The index holistically captures the USD-denominated CLO market, representing more than 3,000 instruments at a total par value of US $236.1 billion. Market participants can track securitized loan market valuations. CLOIE tracks floating-rate CLO securities in 2004–present vintages. Additional sub-indices are divided by ratings AAA through BB, and further divided between pre- and post-crisis vintages. CLO 2.0, or post-crisis vintages, consists of deals issued in 2010 and later. CLOIE utilizes a market-value weighted methodology.
J.P. Morgan EMBI Global Diversified Index
The J.P. Morgan EMBI Global Diversified Index is an unmanaged index that tracks total returns for dollar-denominated Brady bonds, Eurobonds, traded loans, and local market debt-instrument issues by sovereign and quasi-sovereign entities of emerging markets countries.
J.P. Morgan GBI-EM Global Diversified Index
The J.P. Morgan GBI EM Global Diversified Index is a comprehensive global, local, emerging markets index that consists of regularly traded, liquid, fixed-rate, domestic currency government bonds and includes only the countries that give access to their capital market to foreign investors (excludes China and India). The index is market capitalization–weighted, with a cap of 10% to any one country. The index is not available for direct investment; therefore, its performance does not reflect a reduction for fees or expenses incurred in managing a portfolio. The securities in the index may be substantially different from those in the fund.
Russell 1000® Index
The Russell 1000® Index measures the performance of the large-cap segment of the US equity universe. It is a subset of the Russell 3000® Index and includes approximately 1,000 of the largest securities based on a combination of their market cap and current index membership. The Russell 1000® represents approximately 92% of the Russell 3000® Index.
Russell 2000® Index
The Russell 2000® Index is a capitalization-weighted index designed to measure the performance of the 2,000 smallest publicly traded US companies based on in market capitalization. The Index is a subset of the larger Russell 3000® Index.
Footnotes
Wade O’Brien - Wade O’Brien is a Managing Director for the Capital Markets Research team at Cambridge Associates.
About Cambridge Associates
Cambridge Associates is a global investment firm with 50+ years of institutional investing experience. The firm aims to help pension plans, endowments & foundations, healthcare systems, and private clients achieve their investment goals and maximize their impact on the world. Cambridge Associates delivers a range of services, including outsourced CIO, non-discretionary portfolio management, staff extension and alternative asset class mandates. Contact us today.