Catch My Drift? Active Managers’ Style Tends to Change Over Time

The style bias of actively managed growth and value equity portfolios is not typically static. That is not to say that growth managers tend to become value managers nor that value managers tend to become growth managers, but the strength of managers’ style signatures tend to ebb and flow. Many growth manager portfolios sometimes take on a bit more of a value stock flavor, and many value portfolios sometimes lean a bit more toward growth stocks. This is an organic outcome of active management. We analyzed performance of a large sample of active growth and value managers around the world over the last 20 years to see how much their style signatures moved between growth and value stocks. Our expectation was that it moves a lot—or at least more than most investors appreciate—and that is what we found.
That is not to say that the style profile of all managers moves a lot, but style drift appears to be more the norm than the exception for average growth and value managers. Since many investors implement their global equity portfolios with at least some degree of active management, that creates a need to appreciate this movement and the impact on portfolios. In this paper, we highlight how the strength of active managers’ style signatures have moved between value and growth and propose a simple fundamental rationale for why this happens. Ultimately, our analysis reinforces the idea that investors should regularly monitor portfolios, as too much focus on past style profiles can lead to unintended outcomes.
Growth and Value Stocks Versus Growth and Value Managers
The terms “growth stocks” and “value stocks” are common investment terms that imply a clear dichotomy between two different investment opportunities. Generally, growth stocks refer to those in a market offering the highest growth rates of revenue or earnings, and many times these stocks trade among the market’s highest valuations. Value stocks are typically the lowest valuation and many times the lower growth opportunities. In the mental model of many investment allocators, growth stocks map to growth managers and value stocks map to value managers. However, in the world of active growth and value managers the dichotomy is less clear.
Sometimes growth stocks look appealing to value managers, and sometimes value stocks look appealing to growth managers. In our experience, most managers do not use those labels as a qualifying investment parameter for any given stock. Earnings (or cash flow) growth and company value are unavoidably linked, meaning the scale and path of growth expectations is a necessary component of valuation calculus. We might say that active growth and value managers have different scales for weighing growth and valuation considerations, but they are weighing the same variables and sometimes come to conclusions that are not that different. All else equal, any manager would prefer to pay as little as possible for as much risk-adjusted expected growth as possible. We should expect to see signs of value stocks in the performance signature of the average growth manager and signs of growth stocks in the performance signature of the average value manager, and we do. In this discussion, the terms growth manager or value manager refer to the portfolio or performance of the average actively managed growth or value manager.
The Style Signature of Growth and Value Managers
We used historical performance data to assess the strength of the style signature of growth and value managers around the world relative to their relevant style indexes over the last two decades. Some of the structure of the analysis may seem complicated, but the conceptual framework is not. Our aim was to create a large-scale statistical way to illustrate the strength of the growth or value stock bias in the average active growth and value manager performance profile over time. We refer to this as the strength of the style signature and measure it on a scale from 0.0 to 1.0, with 0.0 being a style signature that is 100% representative of growth stocks and 1.0 being 100% representative of value stocks.
Analysis Structure
We built our study around a framework of growth and value investment styles and managers associated with those two styles in the Cambridge Associates’ manager database. The historical dataset in our study includes the monthly performance data on 1,638 growth and value equity managers around the world since January 2000. We used each manager’s performance over rolling 24-month periods to assess the strength of their style signature over time.
The “Style Signature Loading” is calculated with a constrained regression using strategy specific value and growth indexes as predictors for each active manager’s style over rolling 24-month periods. 1 In addition to style, each manager’s performance was mapped to the index most appropriate for their geographic mandate. For example, growth and value managers focused on the US equity market were analyzed using Russell 1000® and Russell 2000® Growth and Value indexes, managers focused on equity markets outside the United States were analyzed using MSCI EAFE Growth and Value indexes, and managers with global mandates were analyzed using MSCI World Growth and Value indexes. In other words, each manager’s performance was regressed against its geographically representative growth and value style index to calculate the degree to which the performance of an index of growth stocks or value stocks is reflected in each rolling period’s outcome. This process provided a rolling measure for each manager’s style signature loading over time. We then calculated the average result across all growth and value managers as a representative measure of the worldwide style signature movement within each of the two style groups.
Findings
Figure 1 highlights the results of our 20+ year study. The style signature loading on the vertical axis should be interpreted as the degree of fit to either growth or value indexes. As previously noted, a signature loading closer to 0.0 means that the return signature for the average manager was a closer fit to growth stocks. A loading closer to 1.0 indicates a closer fit to value stocks. As an example, when the value manager line is at 0.75 the return style signature of the average value portfolio was 75% associated to value stocks and 25% associated to growth stocks; when the growth manager line is at 0.25 the return style signature of the average growth portfolio was 75% correlated to growth stocks and 25% correlated to value stocks.
FIGURE 1 ACTIVE MANAGERS’ STYLE SIGNATURES HAVE MOVED SIGNIFICANTLY
January 31, 2002 – March 31, 2021
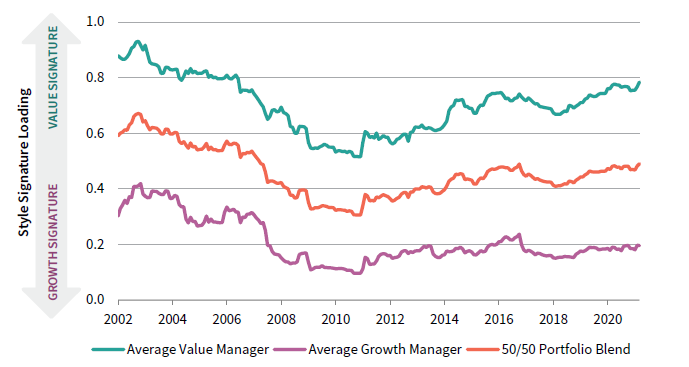
Sources: Cambridge Associates LLC, Frank Russell Company, and MSCI Inc. MSCI data provided “as is” without any express or implied warranties.
We can also put the two lines together to approximate where an average portfolio with equal allocations to active growth and value managers would have been at any point in time relative to its exposure to growth and value stocks. For example, an equally weighted portfolio with the average growth and value manager at the end of 2010 would have had a style signature tilted to growth by a factor of around 69% to 31%. 2 That likely would have resulted in an attractive outcome over the following decade given growth stocks’ outperformance over value stocks, if styles didn’t change over time! But for an investor that believed they had balanced allocations to growth and value managers, it would have been a lucky accident, which could have gone the other way under different circumstances.
These exhibits may be eye-opening for some investors. The style signatures of active growth and value managers have moved significantly over market cycles. 3 Growth managers have not gone all-in on growth stocks all the time. The average growth manager’s return profile has been 79% reflective of a growth stock style signature over the last 20 years, with a range from around 60% to 90%. Value managers have been even less all-in on value stocks, with a value stock average style signature of 70% over the full period and an even wider range than their growth peers, with a value signature range of roughly 50% to 90%. Clearly, growth managers are not wedded to growth stocks and value managers are not wedded to value stocks, at least as defined by our growth and value benchmarks.
Style Drift Is the Norm
The term style drift typically has a negative connotation for investors because it implies that a manager is straying from its strategy or objective, but it appears to be quite normal. To be clear, we do not believe that most managers intentionally set out to buy more growth stocks or more value stocks; rather, in our experience, the movement in Figure 1 reflects changes in the opportunity set rather than an intentional style tilting strategy. The data show that growth and value managers tend to stay on their side of the style divide, and the style signature of both groups appears to drift together. The correlation between the two lines in Figure 1 is 86%, implying that there is some commonality in what growth and value managers look for that results in a natural co-movement. Since expected earnings growth and valuation are common investment variables to both styles of managers, a ratio comparing growth stocks’ and value stocks’ price-to-earnings relative to long-term expected growth (PEG) can provide a useful lens for evaluating managers’ movement.
Since our manager sample has a worldwide footprint, we can look at the PEG ratio for the MSCI World Growth and Value indexes as a directional guide for managers’ relative style opportunity. 4 Figure 2 shows the comparative PEG ratio of the MSCI World Growth Index relative to the MSCI World Value Index since 2002 for insight into the relative appeal of growth stocks versus value stocks based on the price paid per unit of growth—a growth bang for your buck measure. The decline in the ratio from 2002 through 2012 indicates a period where growth stocks increasingly cost less per unit of earnings growth than value stocks. In other words, growth stocks became more appealing as the style signature of the average active growth and value manager was decreasing. Both styles of manager moved toward more tactically appealing growth stocks at the same time. As we see the relative PEG line move up, both manager groups’ bias to growth stocks recedes. That is a sensible outcome that can also be seen in managers’ sector exposures around the world over the last ten years. Globally, for the last ten years, the average active manager has been overweight the technology and healthcare sectors, which are key growth stock areas, and underweight the financials sector, a key exposure for value stocks. In the last couple years, those sector biases have been declining. 5
FIGURE 2 PEG RATIOS PROVIDE A GUIDE FOR MANAGERS’ RELATIVE STYLE OPPORTUNITY
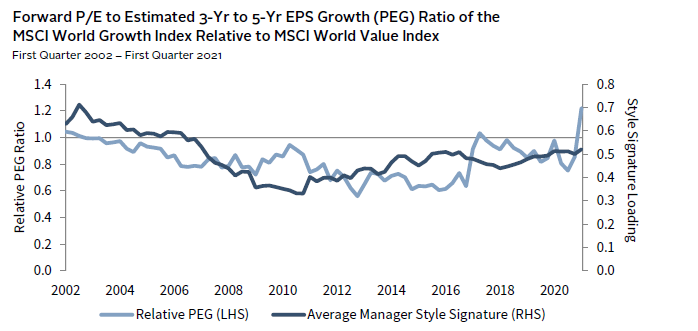
Sources: Cambridge Associates LLC, FactSet Research Systems, Frank Russell Company, and MSCI Inc. MSCI data provided “as is” without any express or implied warranties.
Note: The price-earnings to growth (PEG) ratio is calculated by dividing the relevant index’s next 12-month’s price-earnings ratio by its estimated three-year to five-year forward earnings per share growth rate.
Focusing on the component pieces of the PEG ratio of the MSCI World Growth Index relative to the PEG ratio of the MSCI World Value Index, we can see what drove the increasing appeal of growth stocks. As shown in Figure 3, a gap opened between the comparative trend in earnings growth expectations and valuation around 2003 that remained for quite some time. Growth expectations for growth stocks went up relative to value stocks, but the comparative valuation stayed the same, making growth stocks more appealing per unit of value for everyone. By 2017, the gap closed and the value signature for value managers had increased back toward the historical average. Yes, value managers can find appeal in growth stocks when the prices seem right, and growth managers can also sometimes find appeal in value stocks. They are all assessing relative growth and relative value in their own tactical way.
FIGURE 3 GROWTH STOCKS OFFERED MORE BANG FOR YOUR BUCK
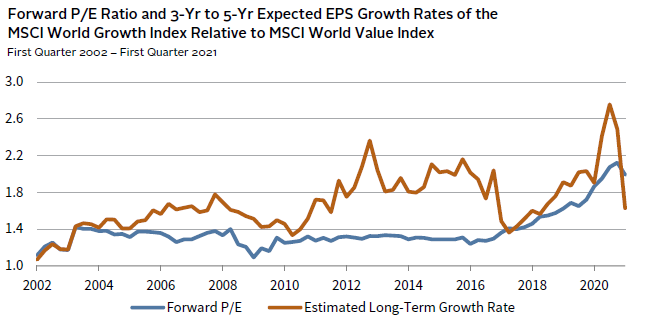
Sources: FactSet Research Systems and MSCI Inc. MSCI data provided “as is” without any express or implied warranties.
Notes: The next 12-month’s price-earnings ratio and estimated three-year to five-year earnings per share growth rate is shown. FactSet’s methodology collects broker estimates for every security in the index with available forecasts and aggregates this data into index-level metrics.
The Nature of What You Own Can Change
Our analysis shows the growth and value style signatures of the average active manager moves meaningfully over full-market cycles and this movement appears to be driven by tactical considerations of the mix of growth expectations and valuations at any point in time. This is an intuitive outcome given active managers’ mandate to actively seek opportunity, but the scale of movement may be surprising to some. The observation is consistent across both growth and value managers and, at the most basic level, important to understand when evaluating managers and managing portfolios over time. For investors that use active managers, it is important to know what you own and understand if or how that is changing over time. Sometimes a style signature change might help your portfolio’s performance and sometimes it might hurt it. Either way, it is better to approach this reality with your eyes wide open. If not, you may set yourself up for surprises if you catch my drift.
Index Disclosures
MSCI EAFE Growth Index
The MSCI EAFE Growth Index captures large- and mid-cap securities exhibiting overall growth style characteristics across developed markets countries around the world, excluding the United States and Canada. The growth investment style characteristics for index construction are defined using five variables: long-term forward EPS growth rate, short-term forward EPS growth rate, current internal growth rate, long-term historical EPS growth trend, and long-term historical sales per share growth trend.
MSCI EAFE Value Index
The MSCI EAFE Value Index captures large- and mid-cap securities exhibiting overall value style characteristics across developed markets countries* around the world, excluding the US and Canada. The value investment style characteristics for index construction are defined using three variables: book value to price, 12-month forward earnings to price, and dividend yield.
MSCI World Growth Index
The MSCI World Growth Index captures large- and mid-cap securities exhibiting overall growth style characteristics across 23 developed markets countries: Australia, Austria, Belgium, Canada, Denmark, Finland, France, Germany, Hong Kong, Ireland, Israel, Italy, Japan, the Netherlands, New Zealand, Norway, Portugal, Singapore, Spain, Sweden, Switzerland, the United Kingdom, and the United States. The growth investment style characteristics for index construction are defined using five variables: long-term forward EPS growth rate, short-term forward EPS growth rate, current internal growth rate, long-term historical EPS growth trend, and long-term historical sales per share growth trend.
MSCI World Value Index
The MSCI World Value Index captures large- and mid-cap securities exhibiting overall growth style characteristics across 23 developed markets countries. The value investment style characteristics for index construction are defined using three variables: book value to price, 12-month forward earnings to price, and dividend yield.
Russell 1000® Growth Index
Russell 1000® Growth Index contains those Russell 1000® securities with a greater-than-average growth orientation. Securities in this index tend to exhibit higher price-to-book and price-earnings ratios, lower dividend yields, and higher forecasted growth values than the value universe.
Russell 1000® Value Index
The Russell 1000® Value Index contains those Russell 1000® securities with a less-than-average growth orientation. It represents the universe of stocks from which value managers typically select. Securities in this index tend to exhibit low price-to-book and price-earnings ratios, higher dividend yields, and lower forecasted growth values than the growth universe.
Russell 2000® Growth Index
Russell 2000® Growth Index contains those Russell 2000® securities with a greater-than-average growth orientation. Securities in this index tend to exhibit higher price-to-book and price-earnings ratios, lower dividend yields, and higher forecasted growth values than the value universe.
Russell 2000® Value Index
The Russell 2000® Value Index contains those Russell 2000® securities with a less-than-average growth orientation. Securities in this index tend to exhibit lower price-to-book and price-earnings ratios, higher dividend yields, and lower forecasted growth values than the growth universe.
Footnotes
- The constraints require that the signature betas be strictly positive and sum to 1.
- The historical 50/50 blend portfolio is indicated by the orange line in Figure 1. The math for this example is 0.5 x (52% Value + 48% Growth) + 0.5 x (10% Value + 90% Growth) = 31% Value + 69% Growth.
- On a manager-by-manager basis, the range in style signature across both growth and value manager groups was significant and, in many cases, quite volatile from one period to the next. In fact, the variation around these averages can be so significant that if we showed lines of plus or minus 2 standard deviations around these averages the distribution of each manager style would fill the entire exhibit. This suggests that the style signature of a portfolio of active growth and value managers can also experience wide and frequent movement.
- Relative PEG ratios are an example of a directional guide to managers’ positioning on the style spectrum. Its predictive capacity for style signature on a point in time basis is limited by the fact that the PEG ratios are a coincident indicator and the manager style signature calculation is a lagging indicator that uses historical data. Its use as a predictive variable for tactical considerations would be quite challenging.
- Based on portfolio holdings analysis of US large-cap growth and value equity and non-US diversified growth and value equity manager data from eVestment.
About Cambridge Associates
Cambridge Associates is a global investment firm with 50+ years of institutional investing experience. The firm aims to help pension plans, endowments & foundations, healthcare systems, and private clients achieve their investment goals and maximize their impact on the world. Cambridge Associates delivers a range of services, including outsourced CIO, non-discretionary portfolio management, staff extension and alternative asset class mandates. Contact us today.