VantagePoint: Third Quarter 2018

Advice in Brief
Climbing the wall of worries is getting tougher. There is room for markets to progress, but caution is required at this stage in the cycle. Markets must overcome four main forces: monetary policy tightening, US dollar strength, a China growth slowdown, and trade friction.
- Liquidity is beginning to decline even as financial conditions remain neutral to accommodative. The transition to tighter conditions may take some time.
- USD strength has caused pain for some emerging markets. However, the vast majority have adequate current account surpluses and/or FX reserves to withstand USD appreciation.
- The Chinese economy will continue to weaken in response to previous tightening designed to rein in leverage. For now, modest monetary easing and RMB weakness are about all investors can expect. Policymakers will not take aggressive action unless conditions get much worse.
- The risk of escalating trade actions is rising, but severe outcomes remain a tail risk. Asia ex Japan and emerging markets would likely suffer disproportionately, but investors should not underestimate the potential for US corporate earnings to be damaged.
On balance, neutral risk positioning remains sensible. However, the potential for forces to shorten the cycle must be monitored. Maintaining appropriate levels of diversification and liquidity to meet cash requirements during periods of stress is becoming increasingly important. We would not climb the wall without adequate safety gear.
Will investors climb the wall of worries? As the market and economic cycle advances and geopolitical risks escalate, the climb becomes a bit more treacherous. Still, strong corporate fundamentals and supportive economic growth conditions typically provide enough support for a successful summit. These supports must be balanced against the prospects for a reversal as liquidity tightens—particularly should the US dollar continue to strengthen, Chinese growth slow, and trade conditions deteriorate, thereby denting economic growth, earnings, and profit margins. In this edition of VantagePoint, we discuss the four forces investors must reckon with to scale this wall: monetary policy tightening, USD strength, another slowdown in China, and trade friction. Given the balance of risk and opportunity, neutral risk positioning remains sensible. At the same time, diversification and adequate liquidity are essential to manage through potential stress.
Getting Tighter
With central banks pulling back on asset purchases, the US Federal Reserve Bank shrinking its balance sheet and raising policy rates, the European Central Bank (ECB) tapering asset purchases, China cracking down on leverage, and some EM central banks hitting the pause button on easing or moving to outright tightening as they struggle to defend their currencies, investors are getting concerned that central banks are pulling away the liquidity punch bowl.
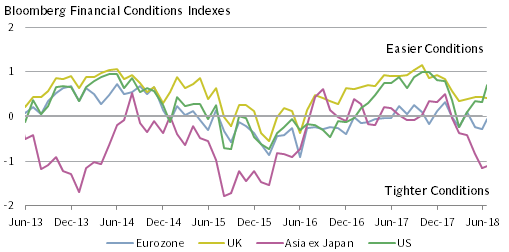
Tighter monetary policy ultimately brings about bear markets, as higher interest rates constrain credit expansion and send the economy into recession. Indeed, the US yield curve is flattening and supply/demand conditions for sovereign bonds are worsening on the margin. The combination of increased US federal borrowing and a reduction in Fed and ECB asset purchases has moved the net issuance of G4 sovereign bonds into positive territory for the first time since 2014. However, even as financial conditions have tightened by some measures, financial conditions remain neutral to loose outside of Asia ex Japan.
FINANCIAL CONDITIONS ARE EASY TO NEUTRAL OUTSIDE OF ASIA
June 30, 2013 – July 17, 2018 • Index Level
Source: Bloomberg L.P.
Notes: The Bloomberg financial conditions indexes track the overall level of financial stress in the money, bond, and equity markets. Positive values indicate accommodative financial conditions, while negative values indicate tighter financial conditions relative to normal.
In the United States, tightening has been offset by fiscal stimulus from the sizeable corporate tax cut and increased fiscal spending as part of the 2018 budget. As the effects of the stimulus wear off, tighter monetary policy could begin to bite. Whether the Fed, ECB, Bank of England (BOE), or other central banks move faster or slower than the market currently anticipates will have implications for markets, but here, views are mixed. Far more consequential for investors is the broader question of what happens when the punch bowl disappears.
There are two key considerations in addressing this question: 1) implications of a reversal of quantitative easing policies and 2) the degree to which excesses build up in capital markets and the real economy when liquidity tightens meaningfully. We cannot know with certainty what will happen as central bank balance sheets shrink, but we can consider what happened when they grew and the degree to which the effects will be symmetric—will the water flow out the same way it flowed in? The combined Fed, Bank of Japan (BOJ), and ECB balance sheets expanded at an annualized rate of 12.4% from 2010 to 2017, more than doubling in just seven years. Yet over the same period, the combined nominal GDP of these regions increased by an annual rate of 1.5% and equities returned 12% annualized in local currency terms. In the United States, where the equity market was the prime beneficiary of quantitative easing, over the same period, the Fed’s balance sheet compounded at an annual rate of 9.9%, compared to 13% returns for US equities and just 3.8% annualized growth of US nominal GDP. In other words, quantitative easing’s biggest impact seems to have been in lifting asset values as investors moved out the risk spectrum and risk premiums compressed.
Therefore, it seems likely that an unwinding of quantitative easing will impact capital markets more than the real economy, as investors gravitate back toward the newly increased yields of safer assets, abandoning bond substitutes and equities that had benefited from ultra-low bond yields. This transition may take some time, as low inflation and still-negative yields continue to attract overseas investors to markets such as the United States that have positive-yielding sovereign bonds. The ECB has indicated that it doesn’t intend to increase interest rates until at least September 2019.
Further, the longer the cycle lasts, the worse the eventual economic pain might be. Yields in many markets remain low and access to credit is still plentiful, raising the risk that excessive and/or mal-investment cause a threat to the real economy. The longer low yields persist, the more such risks increase. However, the potential degree of excess is constrained relative to the last cycle, given financial sector regulations on leverage and capital requirements. For now, it appears that the removal of liquidity will be more damaging to capital markets than to the real economy.
US Dollar Dynamics
The US dollar has resumed its ascent, strengthening nearly 3% year-to-date through the end of June. Many investors are understandably concerned that a strong US dollar will wreak havoc on emerging markets. Emerging markets currencies and assets have fallen—some sharply—but in the aggregate are reasonably valued rather than downright cheap and remain vulnerable to a rising dollar. Emerging markets are quite heterogeneous, with the larger markets facing less risk of a classic balance-of-payments crisis (like the ones occurring today in smaller markets such as Turkey and Argentina). 1 We remain neutral on most EM assets given reasonable valuations and still-sound earnings and economic conditions, and we retain our emerging markets equity overweight as part of a global ex US equity overweight relative to US equities. However, we worry about a bumpy ride in the near term, even in the best of circumstances. Long-term prospects remain attractive, but such assets are vulnerable to considerable downside in the interim.
Emerging markets assets have struggled during earlier periods of sustained USD strength, both in local currency and USD terms. Periods of USD strength pressure emerging markets in several ways. The most virulent source of stress is a balance-of-payments crisis. Current account deficit countries with high levels of USD debt and low FX reserves are most vulnerable, as they rely on USD inflows, and these inflows rapidly turn to outflows during periods of stress. A stronger dollar makes it difficult for EM borrowers to pay back their USD loans, leading to capital outflows from emerging markets and an even stronger US dollar. Access to US dollars is further eroded if exports to the United States fall, a distinct possibility in the face of escalating trade tariffs. To the degree that emerging markets currencies weaken, inflation pressures would increase through higher import costs. EM central banks could help prevent their currencies from plunging by raising rates, but at the price of slowing the economy and deteriorating the credit quality of borrowers. In other words, it puts such countries between a rock and a hard place.
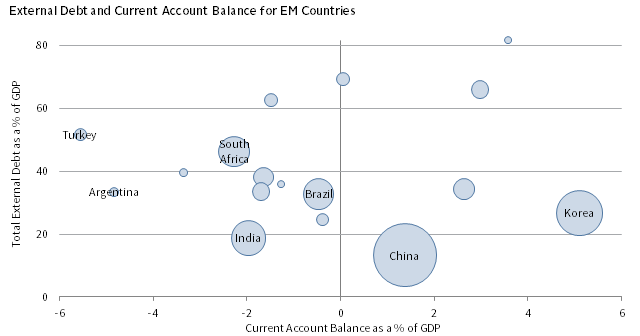
LARGE EM COUNTRIES ARE LESS VULNERABLE TO USD STRENGTH
As of December 31, 2017 • Bubble Size = Size of Equity Market (US Dollars)
Sources: International Monetary Fund – World Economic Outlook Database April 2018, MSCI Inc., Oxford Economics, and Thomson Reuters Datastream. MSCI data provided “as is” without any express or implied warranties.
Notes: Total external debt is debt owed to nonresidents repayable in currency, goods, or services. Total external debt is the sum of public, publicly guaranteed, and private nonguaranteed long-term debt as well as IMF credit. Total external debt for the Philippines is as of 2016. Size of equity markets is based on MSCI indexes. Taiwan, Thailand, and Czech Republic are not shown due to scaling. Current account balance and total external debt as a % of GDP are 13.8% and 30.7% for Taiwan, 10.8% and 31.5% for Thailand, and 1.1% and 90.4% for Czech Republic, respectively.
According to the Institute for International Finance, non-financial EM debt (i.e., household, government, and non-financial corporate) totaled $53.1 trillion by the end of first quarter 2018. China has been a key driver, with its non-financial debt to GDP ratio increasing by 119 percentage points (ppts) since 2008, compared to an increase of 28 ppts for EM ex China. Of total EM non-financial debt, 7.6% ($5.5 trillion) is in foreign currency, 76.7% of which is denominated in US dollars. The stock of EM dollar debt is now approaching late-1990s levels in the aggregate and is back to these peak levels excluding China, both as a share of GDP and exports. However, there have been some important changes in emerging markets since the 1990s that reduce their vulnerability to USD strength.
First, as globalization has increased, EM corporations that receive increasing USD revenues have increasingly tapped into USD credit markets, as USD revenues provide a natural hedge for those liabilities. However, if those USD revenues are curtailed, as could happen in a trade war, these “natural hedges” would be put at risk.
Second, EM countries have shored up their finances. In particular, FX reserves have grown in relation to GDP as EM countries built up defenses after the Asian financial crisis of the late 1990s. Average reserve levels are now approaching 25% of GDP.
Third, the countries most vulnerable to a rising US dollar—those with high levels of external debt, high current account deficits, and low FX reserves—represent a small percentage of emerging markets. Most large countries that have high external debt relative to GDP have adequate FX reserves to at least cover government and financial sector external debt. South Africa is a notable exception.
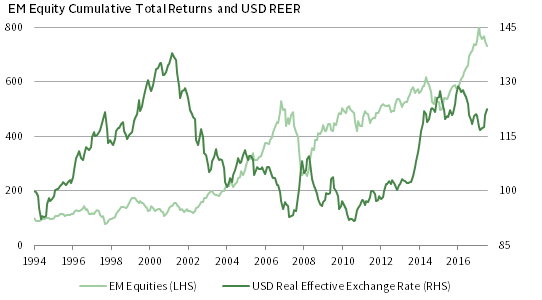
EMERGING MARKETS EQUITIES STRUGGLE AMID USD STRENGTH
December 31, 1994 – June 30, 2018 • December 31, 1994 = 100
Sources: Federal Reserve, MSCI Inc., and Thomson Reuters Datastream. MSCI data provided “as is” without any express or implied warranties.
Notes: The “USD Real Effective Exchange Rate” is the Federal Reserve “Major Currencies” series. “EM Equities” are represented by MSCI EM Index total returns in local currency terms. Total return data prior to January 1, 2001, are gross of dividend taxes. From January 1, 2001, to present total return data are net of dividend taxes. EM equities peaked at 803 on January 31, 2018.
Although it is clear that some countries, particularly smaller emerging and frontier markets, are vulnerable to USD strength, prospects for the US dollar are mixed. Thus far, USD strength has largely reflected relatively strong US economic data and the outlook for global monetary policy. Expectations for increases in US policy rates have been rising this year while expectations for the ECB and other central banks have been rolled back. Even as the US dollar is now overvalued by our estimation, history suggests that the US dollar may continue to strengthen, particularly amid market stress, including a full-blown trade war.
In the face of such stress, especially if economic growth decelerates and/or inflation is weaker than expected, the Fed may decide to pause tightening. This would be unlikely to happen absent convincing changes in hard economic data, which we doubt would show up in time for September’s meeting. However, if the Fed turns dovish by signaling fewer rate hikes, USD strength would likely fade, and EM assets and currencies could then rally (provided EM economic growth is not also skidding in that instance). And, as discussed below, should the United States reach trade agreements with its major trading partners ahead of the US mid-term elections in November (to boost prospects for the Republican Party), global equities including emerging markets would rally.
With EM assets fairly valued, risks and opportunities are roughly balanced over the long term. However, plenty of hazards lie ahead on the way to the long term. Within equities, long-term prospects for non-US equities (including emerging markets) are more appealing than pricey US equities. US equities may remain in favor for some time and the US dollar can get more stretched before the gravitational pull of relative valuations eventually reasserts itself.
The China Challenge
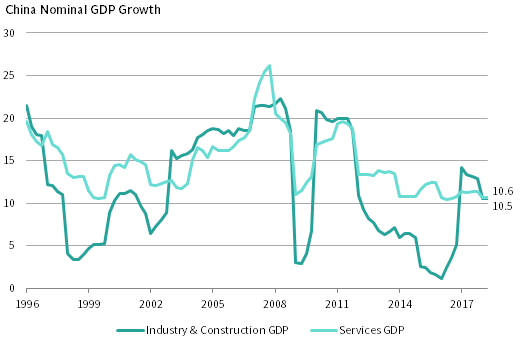
Chinese equities and the renminbi have hit a rough patch. Chinese A-share equities fell 7.6% in June (even as MSCI announced their inclusion in global indexes), with their decline from January levels breaking through the down-20% threshold that defines a bear market. At the same time, the renminbi fell 3.4% against the US dollar in June, erasing its gains for the year. It is easy to blame trade wars for the underperformance, but that is only part of the story. Economic growth has slowed in China amid tightening financial conditions as the government continues to engineer a deleveraging in the economy. Indeed, around this time last year, we indicated that China’s engine was slowing again. Since that time, year-over-year nominal industrial and construction growth has decelerated from its peak of 14.2% to 10.5%, with further weakening expected. Trade disputes with the United States are fanning the flames. Weakness in China raises two key questions for investors: 1) Should investors expect an aggressive devaluation in the renminbi to offset tariff pressures? and 2) Should investors expect a large shift in policy toward re-stimulating the economy? The answer to these questions are “no” and “not yet.”
Between the middle of 2017 and its peak earlier this year, the renminbi strengthened 11% against the US dollar and more than 7% versus a trade-weighted basket. RMB strength transpired as the US dollar was weakening more broadly, and despite the recent decline, the renminbi remains up on a trailing 12-month basis against both the US dollar and in trade-weighted terms. The recent weakening may in part be a response to tariffs, but no major change in China’s currency policy is evident. In fact, fundamentals for the renminbi have been pointing down since May and recent weakness appears to have been a delayed response. As China has cracked down on leverage and economic growth has slowed, the People’s Bank of China (PBOC) has kept policy rates steady even as the Fed has raised rates. Chinese bond yields have also fallen as the PBOC has injected liquidity into the system by cutting the reserve requirement ratio for banks. RMB depreciation would be expected given slowing growth, easing monetary conditions, and falling rates in an environment where other economies have seen steady or increasing rates. The RMB/USD exchange rate tends to track the spread between Chinese and US two-year yields. This spread has been falling since May, but the renminbi continued to appreciate. The recent decline reflects a reversion to fundamentals.
It is unlikely that China is engineering RMB devaluation as a means of self-defense against US tariffs. After all, such action would prompt more retaliation from the United States, would hurt Chinese companies with debt at a time when officials are trying to achieve an orderly deleveraging of the economy, and would destabilize the Chinese economy by prompting capital outflows, potentially leading to a financial crisis. China has many means of retaliation at its disposal, some of which officials have used in past situations (e.g., delay import inspections for US goods or initiate boycotts against US goods). RMB devaluation is a “nuclear” option.
Even as economic growth has slowed and domestic equity shares have entered bear territory, PBOC easing has been modest thus far. As soon as the economy started to accelerate in early 2016, policymakers restarted deleveraging efforts, as they have every time the economy resumed growth since 2010. The pull-back on fiscal stimulus and the PBOC’s monetary-policy tightening have resulted in slowing credit growth since late 2017. Although the subsequent economic slackening has resulted in a modest amount of monetary easing in the form of liquidity injections and a lower reserve requirement ratio, these efforts are inadequate to offset the impact of tightening credit conditions elsewhere in the economy. When will growth slow enough in China for policy makers to respond? The experience in 2015 may serve as a useful guide. This suggests much more pain in the real economy before we could expect any easing. While there has been a rise in corporate bond defaults this year, manufacturing and composite PMI data remain in expansionary territory and nominal GDP growth for industrials remains over 10% today. The industrial sector experienced a hard landing in 2015, with nominal year-over-year growth sinking to just 1% before policymakers eased aggressively in early 2016.
CHINESE SLOWDOWN INSUFFICIENT TO SPUR SIGNIFICANT STIMULUS
First Quarter 1996 – Second Quarter 2018 • Year-Over-Year • Percent (%)
Sources: National Bureau of Statistics of China and Thomson Reuters Datastream.
Please see “Will the Addition of Chinese A-Shares to MSCI’s Global Indexes Trigger an A-Share Rally?”, CA Answers, June 5, 2018.
Even absent a full-blown trade war, Chinese economic data will weaken in response to previous tightening that was designed to rein in leverage. For now, modest monetary easing and RMB weakness are about all that investors can expect. Conditions need to get much worse before policymakers take the sort of aggressive actions that we saw in early 2016. Much of this distress has been priced into the Chinese A-share market, which has fallen 23% from its January peak. While this is only half the decline experienced in the late-2015/early-2016 market rout, valuations were tamer at the start of this year’s sell-off and are now undervalued and cheaper than they were at the bottom of the last cycle. As a result, there may be less downside than in 2015, although it may be too soon to call the bottom yet. Of course, A-shares are barely represented in most global investors’ portfolios. In contrast, the MSCI China Index (which largely excludes A-shares) has not declined as sharply as the onshore market and is subject to more downside risk, particularly as returns have been concentrated in a narrow handful of technology stocks. Should market leadership rotate away from technology, investors would benefit from China exposure that overweights value oriented sectors.
Trade Tensions
Prospects for a trade war have escalated in recent weeks. The consensus view has been that trade posturing was likely to produce cooperation with a settlement reached after either minimally invasive tariffs were implemented or in a best-case scenario, tariffs and trade barriers reduced in aggregate. However, following the increased tit-for-tat threats and actions between the United States and China, the consensus has increased expectations for a more severe outcome. The implications of a trade war are clearly negative, yet impossible to gauge with a high degree of confidence. While model-based estimates of the economic effects of tariffs are tiny, real world implications will be larger. Profit margins will compress due to higher input costs where substitute suppliers or products cannot be found and tariff costs cannot be passed on to consumers. Consumer inflation and currency volatility will increase and, if significant and prolonged, supply chains will ultimately shift (rendering some manufacturing and distribution infrastructure obsolete). The key variable, of course, is the degree to which tariffs and other constraints on trade escalate.
Most economic models peg the direct effect of tariffs, even including the 10% US tariff proposed on $200 billion of Chinese imports, at no more than a 50 basis point drag in GDP growth in both the United States and China. These models are limited to direct effects and underestimate potential implications due to supply chain disruptions, potential tightening of financial conditions, and worsening of consumer and business sentiment. Further, economic models usually assume all trade is in final products rather than consider the complexity of supply chains.
Supply chain effects are meaningful. For example, analysis from the Peterson Institute and Empirical Research Partners reveals that the vast majority of Chinese exports to the United States originates from foreign-invested enterprises 2 operating in China, including foreign subsidiaries of US multinational corporations. Indeed, their work suggests that to date, the toll to US corporations from new US tariffs on Chinese exports to the United States (via their supply chain) is greater than that from Chinese tariffs that US companies will pay on their exports to China! Further, corporate financial statements do not provide adequate information to calculate the potential direct effects of tariffs, even if we ignore indirect effects like consumer and business sentiment. Foreign sales data reveal little about exposure to tariffs. What matters are exports and imports, which are typically not reported. For example, German foreign subsidiaries manufacturing and selling automobiles in the US market would not be subject to US tariffs on EU automobiles should they be instituted.
GLOBAL SUPPLY CHAINS COMPLICATE ASSESSMENT OF TARIFF IMPACT
As of May 31, 2018 • Percent (%)
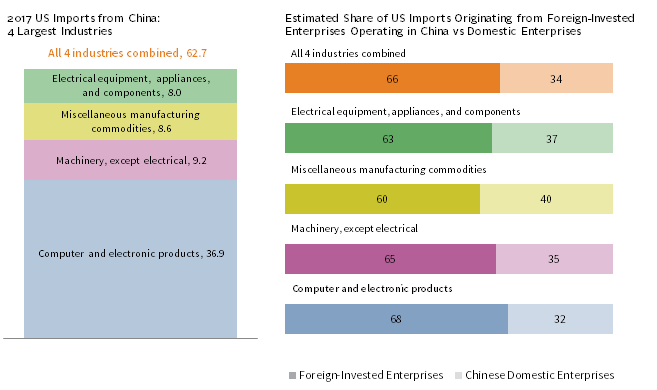
Sources: Peterson Institute for International Economics and US International Trade Commission.
Notes: Imports from Foreign-Invested Enterprises (FIEs) refer to imports shipped to the United States by FIEs operating in China, including those registered in Hong Kong, Macau, and Taiwan. An FIE is a legal structure under which a foreign company can participate in the Chinese economy.
Still, analysts are using a number of methods to estimate potential implications for equity fundamentals. Whether using complex methods of applying available global supply chain data to individual corporations 3 or estimating the sensitivity of asset prices and currencies to changes in global trade growth, these analyses suggest that widespread tariffs would have a greater impact on economies that are most open and integrated into supply chains. Asia ex Japan and emerging markets would likely suffer disproportionately should tariffs increase, as would developed markets reliant on trade, such as Germany and Japan. Recent market action clearly reflects such expectations. From a sector perspective, the materials and technology sectors are most exposed.
Investors should not underestimate the potential damage to US corporate earnings in a trade war. The US equity market is dominated by multinational firms that generate roughly a third of earnings from overseas. Further, these multinationals have enjoyed profit margins nearly twice that of the broad market. If margins start to get squeezed by higher costs of goods and services before final sales, markets could re-rate these expensive companies quite significantly. According to analysis by Barclays Capital, under an extreme scenario in which all US exports and imports are subject to a 10% tariff, S&P 500 companies would see 2018 earnings estimates reduced by 12%, essentially offsetting the estimated benefits of the US corporate tax cuts. Counter-intuitively, small-cap companies that have less foreign sales than US large caps may be even more affected by tariffs. This is because virtually all of small caps’ foreign sales reflect exports rather than activities of foreign subsidiaries, their margins are thinner, and pricing power is lower, which would result in more of the tariff cost falling to their bottom line.
In addition, implications of China’s retaliation could also be quite meaningful for US equities. China does not import enough US goods and services to match the United States dollar for dollar in tariffs, but it does have other “qualitative” means of leverage including being home to US subsidiaries with sales of $223 billion in China in 2017. China could pressure consumers and corporations to boycott and reduce shipments of goods manufactured by local subsidiaries of US companies, and could even target products that have alternative suppliers to limit domestic damage.
There is still a viable scenario in which global tariffs actually fall as countries make concessions with the United States such that the United States pulls back on increased tariffs. After all, the objective of the Trump administration is not to raise tariffs, but alternatively (depending on who you ask), to lower the US trade deficits and reduce unfair trade, to roll back China’s industrial policies, and to change China’s practices around forcing technology transfer as a condition of market access. As markets have started pricing in more extreme conditions, this scenario would benefit those markets hit the hardest, especially emerging markets. However, prospects for a “grand bargain” are unlikely given long-standing disagreements between the United States and China. A short-term settlement that allows President Trump to record a win on trade could transpire ahead of the US mid-term elections this November.
For more discussion on this topic, please see “Should Investors Reposition their Portfolios in Response to Recent Tariffs and the Rising Threat of Trade Wars?,” CA Answers, April 10, 2018.
At the other extreme, it is possible that the trade war escalates considerably—including potential for the United States to pull out of NAFTA or even to reject the World Trade Organization—and more countries introduce countermeasures to retaliate against US tariffs. It is likely that the Trump administration and his sparring opponents will ultimately realize that higher tariffs hurt everyone involved (or that markets and Republican legislators facing mid-term battles will hold their feet to the fire), and they will negotiate agreements that limit the damage, but that outcome cannot be assured.
Potential outcomes of rising tariffs are all negative. The uncertainty is certainly cause to continue monitoring the situation and to remain diversified with adequate liquidity. Our broad advice for dealing with geopolitical risks has been and continues to be that outcomes and market implications are difficult to predict, making broad portfolio diversification and liquidity provisioning the main means of defense. At the same time, we have been neutral on risky assets, while monitoring portfolios to make sure they have adequate—but not too much—liquidity in the event of a market downturn.
About that Wall
Climbing a wall gets tougher at higher altitudes, and the economic and capital markets cycles are becoming more advanced. Still, there is room for markets to progress, if history serves as a reasonable guide. A recession does not appear imminent as long as global earnings and economic conditions remain strong. However, caution is required at this stage in the cycle as liquidity is beginning to decline and policy makers across the globe may need to see more pain before intervening to support markets, given tight labor markets and nascent signs of inflation in the United States, as well as the focus on reining in leverage in China. In addition, tail risks associated with a trade war are growing. It remains worthwhile to be fully invested in risky assets today given the balance of risk and reward. However, investors must monitor the forces that could shorten the cycle. Maintaining appropriate levels of diversification and liquidity to meet spending needs, capital calls, and other liquidity requirements is becoming increasingly important. We would not climb the wall without adequate safety equipment at hand.
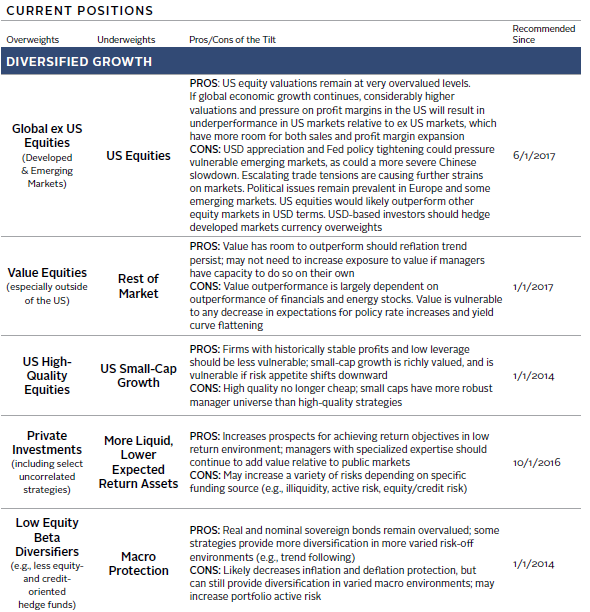
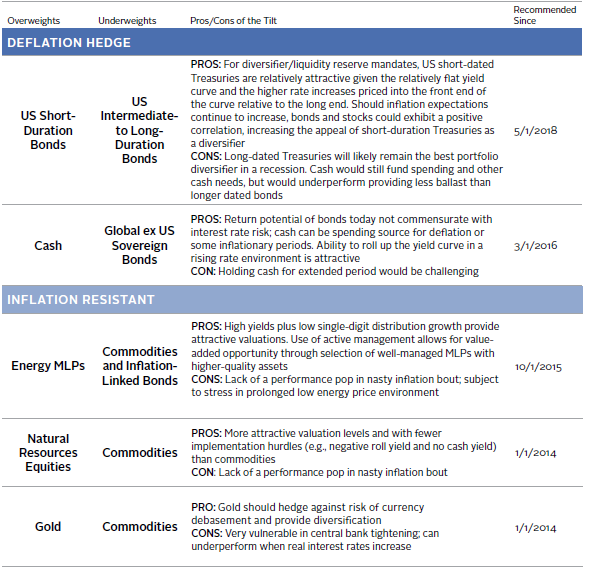
Portfolio Tilts from CA’s Chief Investment Strategist
Index Disclosures
Bloomberg Financial Conditions Index
The Bloomberg Financial Conditions Index tracks the overall level of financial stress in the money, bond, and equity markets to help assess the availability and cost of credit. A positive value indicates accommodative financial conditions, while a negative value indicates tighter financial conditions relative to pre-crisis norms.
Intercontinental Exchange US Dollar (DXY) Index
The ICE US Dollar Index measures the value of the US dollar against a basket of currencies of the top six trading partners of the United States, as measured in 1973: the Eurozone, Japan, the United Kingdom, Canada, Sweden, and Switzerland.
MSCI China A Onshore Index
The MSCI China A Onshore Index captures large- and mid-cap representation across China securities listed on the Shanghai and Shenzhen exchanges.
MSCI Emerging Markets Index
The MSCI Emerging Markets Index represents a free float–adjusted market
capitalization–index that is designed to measure equity market performance of emerging markets. As of October 2016, the MSCI Emerging Markets Index includes 24 emerging markets country indexes: Brazil, Chile, China, Colombia, Czech Republic, Egypt, Greece, Hungary, India, Indonesia, Korea, Malaysia, Mexico, Pakistan, Peru, the Philippines, Poland, Qatar, Russia, South Africa, Taiwan, Thailand, Turkey, and United Arab Emirates.
MSCI EMU Index
The MSCI EMU Index is a free float–adjusted, market capitalization–weighted index designed to measure the equity market performance of the European Economic and Monetary Union. It includes Austria, Belgium, Finland, France, Germany, Greece, Ireland, Italy, the Netherlands, Portugal, and Spain.
MSCI Japan Index
The MSCI Japan Index is a free float–adjusted, market capitalization–weighted index that is designed to measure the equity market performance of Japan.
MSCI US Index
The MSCI US Index is designed to measure the performance of the large- and mid-cap segments of the US market. With 617 constituents, the index covers approximately 85% of the free float–adjusted market capitalization in the United States.
Footnotes
- Argentina is currently classified as a frontier market by MSCI, but is scheduled to move up to their emerging markets index beginning in June 2019.
- A foreign-invested enterprise is a legal structure under which a company can participate in a foreign economy. In China, this includes wholly owned foreign enterprises and joint ventures.
- Some analysts use industry-level “input-output tables” developed by a number of providers. These tables allow dissection of global value chains across industries and countries.
Celia Dallas - Celia Dallas is the Chief Investment Strategist and a Partner at Cambridge Associates.
About Cambridge Associates
Cambridge Associates is a global investment firm with 50+ years of institutional investing experience. The firm aims to help pension plans, endowments & foundations, healthcare systems, and private clients achieve their investment goals and maximize their impact on the world. Cambridge Associates delivers a range of services, including outsourced CIO, non-discretionary portfolio management, staff extension and alternative asset class mandates. Contact us today.