VantagePoint: Is It Time to Overweight Equities?


True knowledge exists in knowing that you know nothing. – Socrates
It could be anywhere from four to six weeks to up to three months, but I don’t have great confidence in that range. – White House Coronavirus Task Force member Dr. Anthony Fauci regarding gaining control over the spread of the pandemic.
In periods of market stress, it can be difficult to rebalance, much less overweight risky assets like equities. But underweighting risky assets relative to strategic policy targets may result in failure to meet institutional, charitable, or wealth objectives if that positioning persists too long. History demonstrates that the worst returns are often followed by the best, as markets, like a compressed coil, will spring back once released from the weight holding them down.
We have no doubt that the economy and markets will recover, and we will find a way to coexist with COVID-19 (should it stick around as appears likely) through improved therapeutics, an effective vaccine, and changes in social behavior. Indeed, progress on these fronts has been encouraging, together with positive early indications from social distancing measures in Italy and Spain. However, these remedies will take time. Investors must be cautious in provisioning for potential cash needs in an extended period of stress. Such conditions may place extraordinary demands on long-term investment pools to bridge the gap between operating needs and revenues. Only after investors carefully evaluate and provision for such unusual needs and consider portfolio liquidity requirements (e.g., capital calls, overlays) should they rebalance toward policy targets and begin considering tactical overweights to equities.
Humans tend to be more sensitive to losses than to gains, and students of behavioral finance recognize that this loss aversion is heightened during bear markets. Further, investors often seek to try to time the market, both for rebalancing and opportunistic overweights. We believe rebalancing is best done routinely, by following a rebalancing policy that minimizes behavioral risks, enabling investors to stick with their strategy developed to meet long-term objectives. By contrast, assessing when to overweight equities and other risky assets versus policy is not an exact science. In this paper, we review our approach using multiple lenses: magnitude and duration of drawdowns relative to history, cheapness of valuations, and presence of pre-conditions for markets to begin their ascent. Such an approach can help investors tune out the emotion and dial in on the hard data and most probable outcomes even in the face of great uncertainty. While opportunities are developing across many markets, investors should hold off on broad overweights to risky assets at this time.
A Look Through Our Lenses
Investors must make decisions with incomplete information, weighing current circumstances against market pricing to determine what risks are worth taking. Guide posts to inform this decision making can help mitigate behavioral risks that are a major concern during bear markets.
Historical Drawdowns and Recoveries
As we discussed in VantagePoint: The Bear Awakens, peak-to-trough equity market price declines have been typical of average recessionary declines; high-yield bond spreads are pricing in distress typical of recessions; and sovereign bond yields have fallen about as low as can be expected given the effective lower bound. The next consideration is the degree to which these declines provide an adequate buffer for uncertainty in the current environment. In addition to price declines, history also informs our view of the future path for fundamentals.
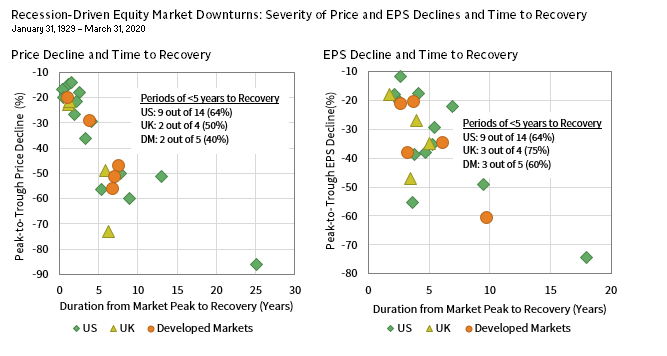
During recessions, earnings tend to decline about 30%, and for at least 12 months. Earnings have just begun their descent, and if past is precedent they may fully recover their previous nominal high-water mark within five years or sooner. However, markets typically price in recovery well before economies or earnings fully rebound.
Armed with an understanding of historical earnings patterns we can make a more informed estimate of the degree of stress equity markets are pricing in.
EARNINGS AND PRICES TEND TO RECOVER IN FIVE YEARS, BUT THERE ARE EXCEPTIONS
Sources: FTSE International Limited, Global Financial Data, MSCI Inc., Standard & Poor’s, and Thomson Reuters Datastream. MSCI data provided “as is” without any express or implied warranties.
Notes: US price data are based on the S&P 500 Index from 1929–71 and the MSCI US Index thereafter; all US price data are daily. US EPS data are based on the S&P 500 from 1929–68 and the MSCI US thereafter; all US EPS data are monthly. All UK data are based on the FTSE® All-Share Index; All UK price data are daily and UK EPS data are quarterly from 1974–91 and are monthly thereafter. Developed Markets data are based on the MSCI World Index; all Developed Markets price data are daily and all EPS data are monthly. All data are in local currency terms.
In Search of a Margin of Safety
Do valuations provide a margin of safety? Broadly speaking, no. Despite price declines of more than 20%, global equity valuations are only 4% below historical medians based on the cyclically adjusted price-earnings ratio (CAPE, sometimes referred to as the Shiller P/E). 1 And since the end of March, this discount has all but evaporated as the market has rallied sharply. For us to overweight equities in a period of heightened uncertainty, we would like to see markets trade at a discount that provides a margin of safety; preferably a discount of at least 20%.
One benefit of using a cyclically adjusted valuation metric is that it provides a long-term perspective as fundamentals are averaged over a long period (ten years in our case). If earnings were to fall 50% tomorrow, would this mean that market becomes half as valuable as it is today? The practice of using simple price-earnings ratios based on 12-month forward earnings estimates inherently assumes this is the case. Such treatment would only be warranted if the earnings capacity of the market were permanently impaired. In contrast, a cyclically adjusted valuation metric incorporates earnings smoothing so that most of the change in valuations derives from price changes rather than from transient earnings impacts. 2
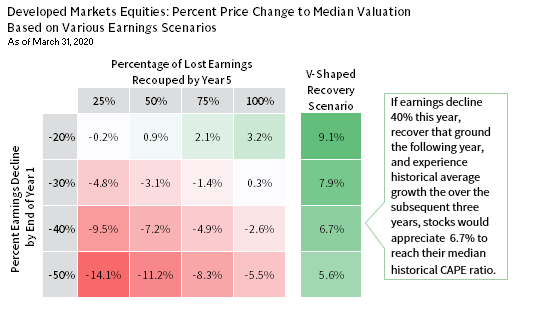
Using CAPE ratios, we model various potential earnings scenarios over the next five years to measure the degree prices would need to move to get to the historical median CAPE ratio. The scenarios in the matrix marked in red reflect earnings paths that require a decrease in current market prices to reach historical median valuations. If earnings fall 30% in 2020 and then recover 75% of their value by the end of first quarter 2025, prices would need to fall 1.4% to reach median values. Not extreme, but certainly not a margin of safety. As shown in the previous chart, in roughly 35% of recessions, earnings do not recover within five years.
It is certainly possible that we experience a V-shaped recovery given that market declines triggered by exogenous shocks (e.g., events such as September 11 or the Cuban Missile Crisis) tend to be short-lived and followed by a rapid recovery. Should such a quick recovery transpire, global equities offer a small margin of safety, as the last column of the chart below indicates. For example, if earnings decline 40% this year, recover that ground the following year, and experience historical average growth over the subsequent three years, stocks would appreciate 6.7% to reach their median historical CAPE ratio. In short, the broad equity market is not expensive, but it does not currently provide the margin of safety that would encourage an overweight. We recognize that a quick recovery would deny us the opportunity to get more aggressive in overweighting equities; we are comfortable with that prospect and believe it more probable that the market will test new lows.
DO EQUITY PRICES PROVIDE AN ADEQUATE BUFFER?
Sources: MSCI Inc. and Thomson Reuters Datastream. MSCI data provided “as is” without any express or implied warranties.
Notes: Data based on the MSCI World Index; all data are monthly and are in local currency terms. The “V-Shaped recovery” scenario assumes that earnings fully recover by the end of year two and that earnings grow at a 4.5% annualized rate thereafter. Returns are based on various hypothetical earnings scenarios and the assumption that the cyclically adjusted price-earnings ratio (CAPE) reverts to its median value based on data since January 31, 1969. The CAPE is calculated by dividing the inflation-adjusted index price by trailing ten-year average inflation-adjusted earnings per share. Other normalized valuation metrics like the cyclically adjusted price-to–cash earnings ratio (CAPCE) lead to similar conclusions about the earnings pain that is priced in to the market.
Preconditions For Normalization
Markets require two main conditions to enter a sustainable recovery. Investors must have faith that:
1. monetary and fiscal policymakers have the will and capacity to keep markets functioning and support the economy; and
2. countries will contain the spread of COVID-19 enough to relieve the strain on hospital systems and allow the economy to recover.
These tasks are not simple and represent important risks, given elevated levels of non-financial corporate and sovereign debt across much of the global economy and limited capacity for central banks to cut rates, as well as a novel coronavirus we know little about.
Loading the Bazooka
Policymakers have their work cut out for them. Early economic datapoints in the United States and Europe make clear that economic growth has fallen off a cliff, similar to the declines seen in China in January and February when industrial production plummeted 13.5% and retail sales 20.5%. However, policymakers have demonstrated a willingness to use all available tools to keep financial markets functioning, replace lost consumer income, facilitate debt forbearance, and make capital available to small- and mid-sized enterprises, as well as large players in select industries. During the week ended March 27 alone, global governments and central banks announced 264 official policy actions, accounting for 40% of the total tally to date since January 30.
The longer the economy remains shut down, the harder it will be for governments to plug the holes. The prospects are costly. If the $20 trillion US economy operates at half capacity during the shutdown, just one quarter of lost activity would shrink output by $2.5 trillion, roughly the amount of fiscal stimulus the United States has passed. A prolonged lockdown will make hard choices even more difficult. Without an adequate slowdown in infection rates the healthcare rationing forced by limited medical resources is intolerable, particularly in wealthy democracies. Policymakers would find themselves increasingly caught between a rock and a hard place.
The Eurozone is more constrained, given limitations on debt prescribed by EMU guidelines and a starting point of negative policy yields. Yet, the region is acting boldly to fill the void, suspending all fiscal rules in the Stability and Growth Pact to enable member states to spend what they need to fight COVID-19. At the same time, the European Central Bank has expanded asset purchases to include bonds issued by all member states without condition, as well as non-financial commercial paper. Indeed, Europe’s fiscal support thus far is comparable to that provided in the United States as a share of GDP. The common battle against this invisible virus and the resultant lack of concern over moral hazard have the potential to move the EMU toward fiscal union.
Policymakers in China have also been keeping markets, businesses, and consumers afloat. China has started to add more stimulus to support growth now that restrictions have largely lifted; 99% of large industrial companies and 77% of smaller ones had reopened by late March, according to official estimates, and economic activity is starting to recover. This light at the end of the tunnel has helped to soothe markets despite the early stages of a sharp recession in the United States and Europe.
Emerging markets remain a clear concern, especially oil and commodity exporters with large external debt as a percentage of GDP. In contrast, East Asia, like China, has moved swiftly to contain COVID-19 and should see benefits from containing the virus faster. The region should also benefit from falling commodity prices and their tendency to run current account surpluses. Commodity exporters and current account deficit emerging markets countries will remain under pressure. International Monetary Fund and World Bank finances may be required to support those economies. However, longer term, when there is a cyclical recovery, emerging markets may find relief, especially if the US dollar weakens.
In short, policymakers’ ability and willingness to provide adequate stimulus is mixed today, but the largest markets (the United States and China), have shown both for now, while Europe is providing more support than many would have thought possible prior to this pandemic. The longer emergency conditions remain in place, the more costly and challenging this support will become and the greater the risk that the economic damage will remain post-lockdown. The pace and magnitude of announced policy remedies has been heroic, and even though serious implementation challenges remain, policymakers are showing a clear understanding of conditions and a willingness to rapidly adjust. This materially reduces the tail risks of a prolonged recession and long recovery period, but does not guarantee a V-shaped recovery. The longer governments take to contain the virus spread, the higher the risks and the greater the cost.
Flattening the Curve
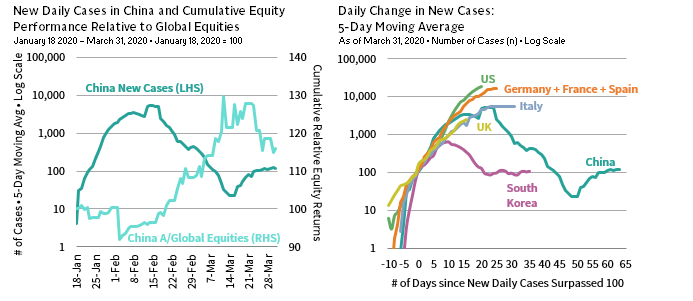
The most important condition for a sustained market recovery is for investors to gain comfort that COVID-19 containment efforts will be successful enough to alleviate fear and remove restrictions on activity. As we saw in China and Korea, equity markets began outperforming peers as the number of new infections began to level off. The timing of each country or region’s curve flattening will differ along with the varied containment approaches.
Development and deployment of a vaccine in quantity is expected to take a minimum of 12 to 18 months, even as early progress on this front has been rapid. Moderna has developed an experimental vaccine in just 63 days from the time of the genetic sequencing of the virus to the first patient’s dosing. Despite this record timing, there is no guarantee this or other vaccines will work, and the unique character of this vaccine would require time to scale manufacturing. Still, this and other vaccine developments offer promise. At the same time, scientists and doctors are investigating antiviral drugs and other therapeutics that offer potential to reduce the severity of infection, reducing mortality rates, as well as strain on hospitals. Success on this front could come faster than a vaccine and provide relief in the interim.
INVESTOR BELIEF THAT COVID-19 WILL BE CONTAINED IS ESSENTIAL
Sources: European Centre for Disease Prevention and Control, MSCI Inc., and Thomson Reuters Datastream. MSCI data provided “as is” without any express or implied warranties.
Notes: According to a Bloomberg report, the US Intelligence Community concluded that China is underreporting confirmed cases; however, it is inconclusive whether or not this would affect the slope of the curve. China A-Share equities and Global equities are represented by the MSCI China A Onshore Index and MSCI All Country World Index, respectively. Equity returns are price returns and in local currency. All regions are aligned to the day that the five-day moving average of new daily cases crossed 100.
Among major economies, the United States, parts of Europe, and the United Kingdom have yet to see a sustained reduction in average daily new identified infections, and these numbers may ramp up quickly before turning down as testing continues to increase. However, the leveling of case increases in Italy and some tentative signs that New York City—the latest epicenter of the pandemic—may be approaching an inflection point offers hope that stay-at-home policies can slow and ultimately reduce the spread. Markets have rallied on these positive developments, but we caution that despite this progress, considerable uncertainty remains with regard to countries’ exit strategies, as a return to normal economic activity is complicated by the diverse nature of containment efforts across the globe and still-inadequate diagnostic testing capabilities in the United States.
Other Indicators?
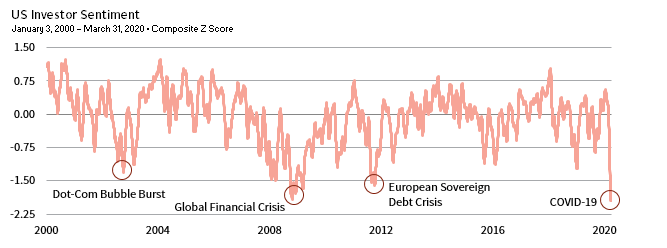
Another item we are monitoring is investor sentiment. Profound levels of either investor optimism or pessimism can push asset prices away from levels that are justified by underlying fundamentals. Because investors tend to be more sensitive to losses than gains, the divergence between prices and fundamentals can be particularly acute in a downturn. Indeed, our data support this idea. Using a composite sentiment metric, which combines data on implied volatility, the amount of put options outstanding relative to calls, and individual investor opinions, we’ve noticed larger-than-normal returns tend to follow pronounced levels of pessimism.
Looking at individual drawdowns, we’ve also noticed that investor pessimism tends to be at its most extreme in the immediate days prior to equities bottoming. In fact, in analyzing the last four market drawdowns (all the drawdowns for which we have quality sentiment data), pessimism peaked in the week prior to each equity market low. In mid-March, sentiment was the worst we’ve seen since our data began. While we do not know if investor pessimism peaked for this drawdown, it is helpful to know that more uncertainty is baked into equity prices at present than during the global financial crisis. Of course, no metric is a silver bullet, but watching for sentiment to moderate may be a helpful guide post.
INVESTOR PESSIMISM REACHES NEW LEVEL IN MARCH
Sources: AAII, CBOE, and Thomson Reuters Datastream.
Note: Data are a composite of the CBOE Volatility Index, CBOE Put/Call index, and AAII Investor Sentiment Survey on a 22-day moving average.
What’s Special About the Current Downturn?
Unfortunately, the current downturn’s uniqueness adds complexity to thinking about when conditions will normalize. One key challenge is the possibility of multiple waves of the virus. While efforts are underway in many nations to quarantine infected persons and limit social interaction, there are noticeable differences in policies and the discussed timelines of those policies. And, recent G7 and G20 meetings did little more than acknowledge the virus’ reality, suggesting that meaningful increases in international cooperation are not in the cards presently. These and other factors raise the possibility that jurisdictions once presumed healed could suffer further outbreaks, prolonging our period of economic inactivity.
Even if countries exit their quarantined states in the next few months, consumer and business behavior will most likely be different than before the crisis. While it is true that spending following a downturn is typically depressed, virus policies—such as those that may restrict crowds in a restaurant, stadium, or office building—could depress already weak spending. Additionally, potential demand for some industries’ goods and services may change materially. An obvious example is air travel demand. Clearly, this will be a huge challenge to airline executives and policymakers going forward, but weak future air travel demand will have second-order effects on cash-strapped hotels, restaurants, and other connected industries.
This downturn may also have a chilling impact on globalization. For starters, businesses may view elaborate, multi-country supply chains as riskier than previously assumed. For similar reasons, some countries may redefine what goods need to be produced domestically (e.g., medical supplies), or they may even use the virus to advance nationalist agendas. Ultimately, in thinking about the potential for multiple waves of the virus, the likely change to consumer and business behavior, and the possible pullback in global integration, we are skeptical that economic activity will snap right back to prior levels, as some have suggested. Instead, we believe cautious economic and corporate earnings growth assumptions are prudent in this unique time.
Perfect Timing Not Required
Looking back at major US drawdowns, equities and high-yield credits have tended to deliver outsized subsequent returns. For instance, US equities returned an average of 23.2% in the first year following the eight drawdowns we reviewed. That performance compares favorably relative to many fixed income asset classes, including US Treasuries, which returned an average of 7.6%. Of course, perfectly timing a market bottom is exceedingly difficult, requiring far more luck than skill. So, would overweighting equities prior to a market bottom or following a market bottom be a poor decision? We reviewed three different scenarios and compared them to investments made with perfect foresight, and thankfully, perfect timing has not been necessary to make an equity overweight additive.
The three additional scenarios we reviewed are: (1) investing after US equities fall 20%; (2) investing three months after US equities bottom; and (3) investing after US equity momentum turns positive. Across all three scenarios, average one-year subsequent returns for developed markets equities were larger than for US Treasuries and cash. And, longer-minded investors, who held an overweight to equities for three years, benefited even more on average. What stood out to us was the effectiveness of momentum. Even though our signal was basic—just the annual change of the S&P 500 price index—it was the only scenario that generated consistently positive equity returns across all drawdown periods. Understanding that timing does not need to be perfect and that momentum may be helpful will be important considerations for us going forward. 3
Conclusion
The time to be aggressive in overweighting risk assets will likely come, but the available evidence does not yet provide ample support. Markets are pricing in average recessionary conditions but are not quite cheap enough to provide an adequate margin of safety to justify an overweight. Investors must also believe fiscal and monetary policy is adequate; it appears to be for now, but this is vulnerable to a more extended lockdown. Clearly the battle against the spread of COVID-19 has been insufficient to moderate pessimism.
The lack of a clear margin of safety in valuations is a key limitation in moving from policy weights to overweights, especially considering the significant uncertainty today. We see opportunities in the current environment and are evaluating them but would not take a broad approach to overweighting equities quite yet. Once more of these guideposts show positive signals, we’d look to overweight, potentially using momentum to guide us.
APPENDIX: PERFECT TIMING NOT REQUIRED
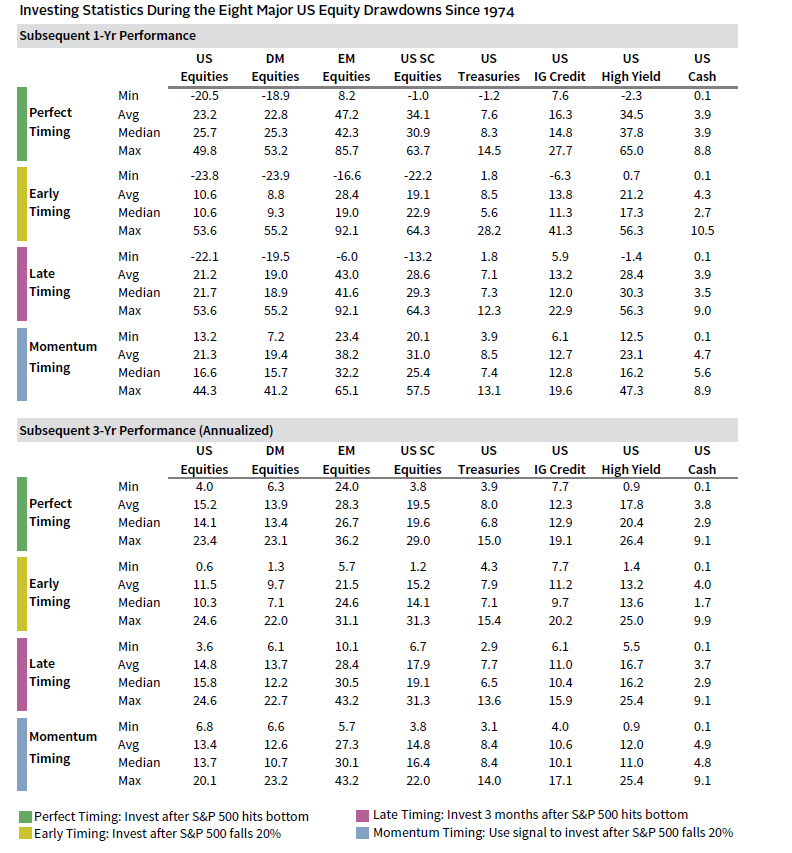
Sources: Bloomberg Index Services Limited, Federal Reserve, MSCI Inc., Standard & Poor’s, and Thomson Reuters Datastream. MSCI data provided “as is” without any express or implied warranties.
Notes: Data are monthly and reflect S&P 500 Index, MSCI World Index, MSCI Emerging Markets Index, S&P SmallCap 600 Index, Bloomberg Barclays US Treasury Index, Bloomberg Barclays US Investment Grade Corporate Bond Index, Bloomberg Barclays US High Yield Index, Federal Reserve Treasury bill secondary market total returns. Scenarios reflect the average performance across the eight major downturns. The US Equity Momentum scenario highlights returns after US equity momentum, which is defined as the annual S&P 500 price change, has turned positive following each downturn.
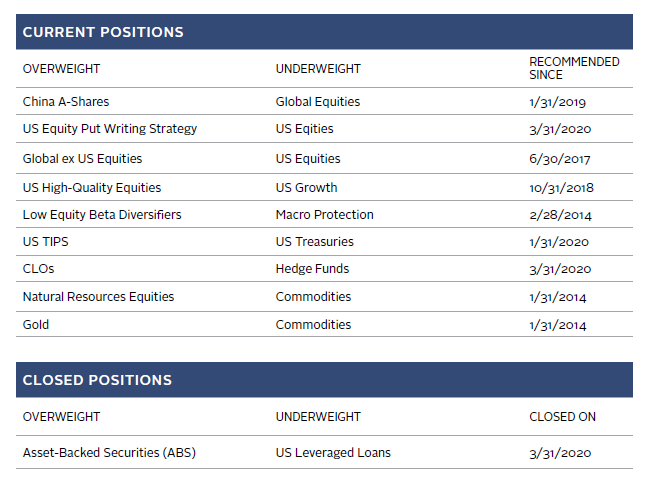
OVERVIEW OF TACTICAL CA HOUSE VIEWS
Index Disclosures
Bloomberg Barclays US High Yield Bond Index
The Bloomberg Barclays US Corporate High Yield Index measures the US corporate market of non-investment grade, fixed-rate corporate bonds. Securities are classified as high yield if the middle rating of Moody’s, Fitch, and S&P is Ba1/BB+/BB+ or below.
Bloomberg Barclays US Investment Grade Corporate Index
The Bloomberg Barclays US Investment Grade Corporate Bond Index measures the investment grade, fixed-rate, taxable corporate bond market. It includes USD-denominated securities publicly issued by US and non-US industrial, utility and financial issuers. The US Corporate Index is a component of the US Credit and US Aggregate indexes, and provided the necessary inclusion rules are met, US Corporate Index securities also contribute to the multi-currency Global Aggregate Index.
Bloomberg Barclays US Treasury Index
The Bloomberg Barclays US Treasury Index includes public obligations of the US Treasury with a remaining maturity of one year or more.
CBOE Volatility Index
The CBOE VIX Index represents one measure of the market’s expectation of stock market volatility over the next 30-day period. The VIX is quoted in percentage points and translates, roughly, to the expected movement in the S&P 500 Index over the next 30-day period, which is then annualized.
FTSE® All-Share Index
The FTSE® All-Share Index represents 98%-99% of UK market capitalisation and is the aggregation of the FTSE® 100, FTSE® 250, and FTSE® Small Cap indexes.
MSCI All Country World Index
The MSCI ACWI Index is a free float–adjusted market capitalization weighted index designed to measure the equity market performance of developed and emerging markets. The MSCI ACWI consists of 46 country indexes comprising 23 developed and 23 emerging market country indexes. The developed market country indexes included are: Australia, Austria, Belgium, Canada, Denmark, Finland, France, Germany, Hong Kong, Ireland, Israel, Italy, Japan, Netherlands, New Zealand, Norway, Portugal, Singapore, Spain, Sweden, Switzerland, the United Kingdom, and the United States. The emerging market country indexes included are: Brazil, Chile, China, Colombia, Czech Republic, Egypt, Greece, Hungary, India, Indonesia, Korea, Malaysia, Mexico, Peru, Philippines, Poland, Qatar, Russia, South Africa, Taiwan, Thailand, Turkey, and United Arab Emirates.
MSCI China A Onshore Index
The MSCI China A Onshore Index captures large- and mid-cap representation across China securities listed on the Shanghai and Shenzhen exchanges.
MSCI Emerging Markets Index
The MSCI Emerging Markets Index represents a free float–adjusted market capitalization index that is designed to measure equity market performance of emerging markets. Emerging markets countries include: Argentina, Brazil, Chile, China, Colombia, Czech Republic, Egypt, Greece, Hungary, India, Indonesia, Korea, Malaysia, Mexico, Pakistan, Peru, the Philippines, Poland, Qatar, Russia, Saudi Arabia, South Africa, Taiwan, Thailand, Turkey and the United Arab Emirates.
MSCI US Index
The MSCI US Index is designed to measure the performance of the large- and mid-cap segments of the US market. With 617 constituents, the index covers approximately 85% of the free float–adjusted market capitalization in the United States.
MSCI World Index
The MSCI World Index represents a free float–adjusted, market capitalization–weighted index that is designed to measure the equity market performance of developed markets. As of December 2017, it includes 23 developed market country indexes: Australia, Austria, Belgium, Canada, Denmark, Finland, France, Germany, Hong Kong, Ireland, Israel, Italy, Japan, Netherlands, New Zealand, Norway, Portugal, Singapore, Spain, Sweden, Switzerland, the United Kingdom, and the United States.
S&P 500 Index
The S&P 500 Index gauges large-cap US equities. The index includes 500 leading companies and captures approximately 80% coverage of available market capitalization.
S&P SmallCap 600 Index
The S&P SmallCap 600 seeks to measure the small-cap segment of the US equity market. The index is designed to track companies that meet specific inclusion criteria to ensure that they are liquid and financially viable.
Footnotes
- An alternate metric that we also use, the cyclically adjusted price-to–cash earnings ratio (CAPCE), indicates comparable valuation levels, with shares trading at a 10% premium to its median CAPCE ratio. Cash earnings are defined as net income from continuing operations plus depreciation and amortization expenses. MSCI does not publish cash earnings for banks and insurance companies and therefore excludes these two industry groups from index-level cash earnings.
- For example, if cash earnings on the MSCI World Index were to halve tomorrow, the CAPCE would barely budge. With normalized earnings reflecting the average of 120 datapoints over the last decade, it takes a very large and sustained decline to make an impact. Keep in mind that with the long market cycle, earnings have increased considerably over the last decade, so cash earnings that get dropped from the average as time marches on are low relative to recent earnings peaks.
- For more on timing and momentum considerations see the Appendix, which highlights one-year and three-year subsequent returns across a variety of asset classes for investments made at a US equity market bottom and the three other investment scenarios described earlier.
Kevin Rosenbaum, CFA, CAIA - Kevin Rosenbaum is Head of Global Capital Markets Research and Investment Communications at Cambridge Associates.
Celia Dallas - Celia Dallas is the Chief Investment Strategist and a Partner at Cambridge Associates.
About Cambridge Associates
Cambridge Associates is a global investment firm with 50+ years of institutional investing experience. The firm aims to help pension plans, endowments & foundations, healthcare systems, and private clients achieve their investment goals and maximize their impact on the world. Cambridge Associates delivers a range of services, including outsourced CIO, non-discretionary portfolio management, staff extension and alternative asset class mandates. Contact us today.