VantagePoint: Can Value Outperformance Endure?


Investors can hardly be blamed for losing their patience with the value style of equity investing. Since 2006, any period of value outperformance has proved to be a false dawn for investors hoping for secular outperformance. Indeed, the last great period of value outperformance was from 2000–06 when developed markets value stocks outperformed the broad market by more than 40 percentage points (ppts) cumulatively based on MSCI indexes. From the mid-1970s through 2006, significant value outperformance was commonplace—there were five stretches of significant outperformance (i.e., 15%+) extending over 74% of the time. After 2006, there have been zero such periods. Could the value outperformance that started in September 2020 be different, or will investors continue to await the elusive return of the value factor?
In this edition of VantagePoint, we explore the historical drivers of the value risk premium to determine if there have been any fundamental changes since 2007, the start of the global financial crisis (GFC), and to understand conditions that must be present for a sustained period of value outperformance. There are two main theories believed to explain the value stock return premium: 1) high returns for value stocks are necessary to compensate investors for higher risk associated with greater sensitivity to economic growth; and 2) investors’ tendency to anchor to recent performance and extrapolate current conditions into the future result in overpaying for growth and underpaying for value stocks. The first theory highlights value stocks’ reliance on economic outcomes, while the second implies that mean reversion of fundamentals is essential for value stock outperformance.
In the post-GFC era, sustained high levels of economic growth have been rare and short lived, while corporate profitability has been more persistent, reflecting less mean reversion than has historically been the case. We expect the current rally in value equities will likely hold through at least this year, as global economic activity helps value-leaning cyclicals outperform. Beyond this year, the outlook is unclear and dependent on sustained higher levels of economic growth that would be supported by improvement in productivity, which would drive wages and demand higher. Such conditions could also help improve profitability among a broader range of companies than the dominant US large growth companies, encouraging mean reversion.
Lackluster Economic Growth Is a Drag
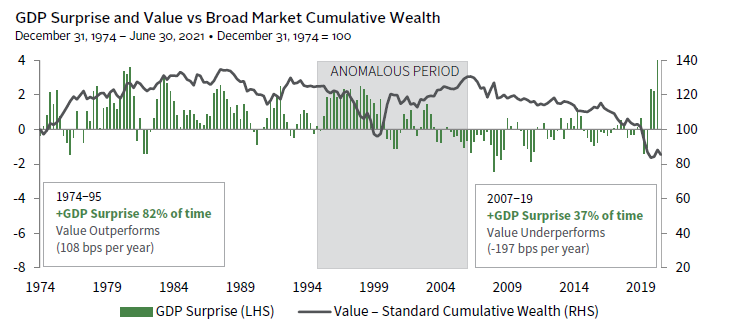
The recent period of value outperformance has been fueled by a strong economic recovery as major economies re-open following pandemic-related restrictions. What has been particularly remarkable about this period of economic growth is the resultant upward revisions in economic forecasts. As shown below, US economic growth surprises were more prevalent prior to the 2000s, a period when value dominated the broad market most of the time. Following the GFC, economic growth tended to disappoint expectations and value stocks have suffered disproportionately raising questions about the ability of investors to benefit from the value risk premium. This has been the case across most countries and globally.
Drivers of market performance are always multifaceted. In the below figure, the period shaded in grey reflects a breakdown in the relationship between economic surprise and value stock performance. The building of the tech and telecom bubble in the second half of the 1990s drove outperformance of growth stocks and set up an environment for value to outperform in the early 2000s as the popping of the TMT bubble weighed on growth stocks and the heavyweight financials sector outperformed amid growing imbalances that ultimately culminated in the GFC.
VALUE OUTPERFORMANCE IS HEAVILY DEPENDENT ON ECONOMIC MOMENTUM
Sources: Federal Reserve Bank of Philadelphia, MSCI Inc., Thomson Reuters Datastream, and US Bureau of Economic Analysis. MSCI data provided “as is” without any express or implied warranties.
Notes: GDP Surprise represents the difference between the Philadelphia Fed forecast one quarter out and actual US GDP. GDP data are through first quarter 2021. Shaded area represents the “Anomalous Period” including the TMT boom and bust followed by the financials boom. Value is represented by the MSCI US Value Index and Broad Market is represented by the MSCI US Index.
There are many theories behind the disappointing growth of the post-GFC era. Key among them is the use of fiscal austerity and easy monetary policy. Easy monetary policy arguably led to asset price inflation and aggravated income inequality, while the benefits to the real economy are believed to have been limited. Further, technological disruption and movement of supply chains to China and other low-cost centers have limited job opportunities for the middle class.
Today’s strong economic momentum is rooted in the reopening of the global economy. To the extent that governments and the medical community can continue to advance vaccination progress and contain the spread of COVID-19 variants, economic strength can be expected to continue and spread beyond the United States and Europe.
Beyond the reopening boost as we recover from the pandemic, policymakers appear to be taking in the lessons of the last decade by seeking to avoid austerity and invest in infrastructure, education, and technology. If done well, such investments can boost long-term growth and expand productive capacity. Corporations operating in COVID-19–affected environments have also sharply increased investment in information processing equipment and software, total private fixed investment has increased and now exceeds 2019 levels, and the number of patent filings in the United States has increased over the last several years. As the economy transforms digitally, widespread access to broadband and affordable education will be essential to retrain workers to continue to support demand. Inflation risk is certainly a possibility, but if productivity increases alongside wages, this risk is mitigated and policymakers (with private sector cooperation) could augur well in a higher growth period. There are many risks to this outcome and such transitions can take many years to transpire, suggesting that a longer-term secular rise in value may need to wait.
The End of Mean Reversion?
The behavioral argument for the existence of a value premium hinges on mean reversion of fundamentals and stock returns. Investors tend to anchor perspectives based on recent performance. As a result, investors will pay too much for growth stocks because they presume strong growth will persist into the indefinite future, while paying too little for value stocks with less robust earnings growth expectations. As growth stocks subsequently disappoint and value stocks’ prospects improve, investors recognize their error and valuations converge. So, what happens if fundamentals stay relatively constant as the most profitable companies hold on to their lead and the least profitable remain at the bottom of the lot? Under such circumstances, value stocks would struggle to keep up with the broad market. Lack of mean reversion appears to have been a factor in constraining value performance relative to the rest of the market given the concentration of earnings and margins in US large-cap growth stocks, and diminished turnover in the group of companies with the highest profitability.
Concentrating on Earnings
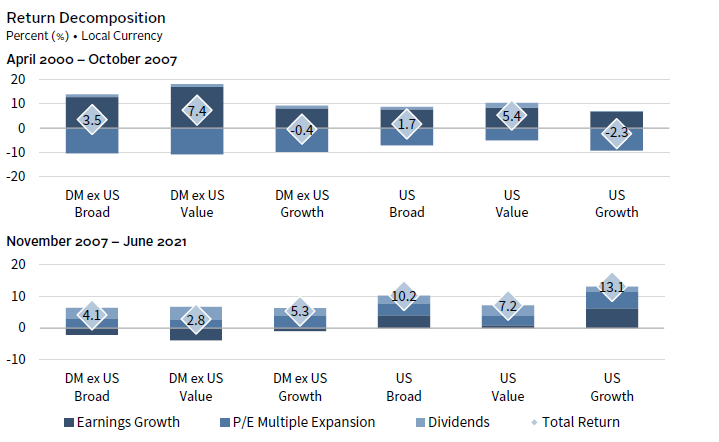
The three main drivers of equity returns over time are earnings growth, dividends/buybacks, and valuation multiples. Looking at the last two market cycles from market peak to subsequent peak, we see very different dynamics. In the 2000–07 cycle, earnings growth for growth and value indexes were relatively comparable, although value outpaced growth, and valuations contracted across the board. In contrast, since 2007 the outperformance of growth stock earnings has been pronounced and particularly concentrated in US growth stocks. US value stocks were able to grow earnings by 0.8% compared to 6.2% for growth stocks. For developed markets outside the United States, earnings growth was negative across the board, although still considerably less negative for growth companies than their value peers.
POST-GFC, US GROWTH STOCK OUTPERFORMANCE HAS BEEN DRIVEN BY SUPERIOR EARNINGS GROWTH
Sources: FactSet Research Systems and MSCI Inc. MSCI data provided “as is” without any express or implied warranties.
Notes: Earnings Growth and P/E Multiple Expansion represent the annualized average percent change in EPS and P/E ratio, respectively,
and Dividends represents the total return less the price return annualized. Total returns are gross of dividend withholding taxes.
Impenetrable Moats
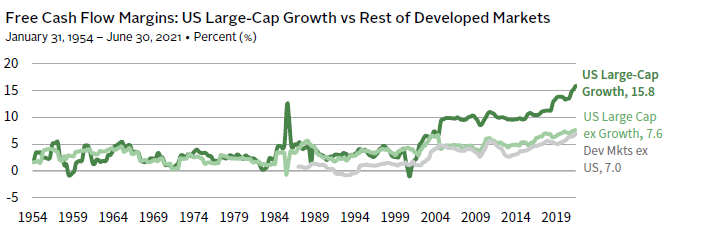
The decoupling of earnings growth between US growth stocks and the rest of the developed markets raises questions about the ability of value companies to outperform in a winner-take-all environment. Stronger earnings growth has translated into high free cash flows lifting free cash flow margins to more than two times that of rest of the US market and developed markets stocks outside of the United States.
US FREE CASH FLOW MARGINS HAVE BROKEN AWAY FROM THE PACK
Source: Empirical Research Partners.
Notes: Measured in aggregate terms; data smoothed on a trailing three-month basis. Developed Markets ex US data begin in January 1987.
Analysis by Wellington Management finds that there has been increased persistence in profitability dominance among the most profitable firms since the GFC. Turnover in the top 10% of most profitable US companies based on cash flow return on investment (CFROI) averaged 21% annually from 1991 through 2008. However, after the GFC, leading companies more frequently held their lead as new entrants into the top decile roughly halved. More broadly, the persistence of profitability across the US market has increased. Wellington evaluated the cross-sectional correlation of the prior year’s profitability with that of the subsequent year. They found that the correlations, and thus the stickiness of profitability, has been higher in the post-GFC period than before. In other words, mean reversion of profitability has been constrained across the board, reflecting a limited ability for value companies to improve, and be rewarded by the markets. To some degree, this relates to the challenges associated with the lack of a sustained period of higher economic growth discussed above.
However, there are a few forces that may serve to reduce growth companies’ grip on the top of the profitability leader board, namely the potential for higher global taxes and stricter regulations that would disproportionately pressure prospects for large growth stocks. Regarding taxes, the Biden administration’s American Jobs Plan (designed to address infrastructure needs) includes a proposal to increase the tax rate imposed on a US shareholder’s global intangible low-taxed income (GILTI tax) from 10.5% to 21.0%. Such an increase would fall disproportionately on multinational tech giants that are heavy weights in US growth and broad market indexes. Furthermore, any commitment by Organisation for Economic Co-Operation and Development (OECD) members to a global minimum corporate tax rate, currently proposed to be 15%, would also depress these firms’ margins. At the same time, about half of all European OECD members have either announced, proposed, or implemented a digital service tax aimed at large tech companies.
In addition, regulatory pressure is building against these large players posing a longer-term threat to their dominance and ability to sustain their high moats. In recent months, anti-trust investigators at the US Justice Department and the EU have stepped up scrutiny of Google’s digital ad market practices. Facebook is also under pressure for anti-competitive practices. Such changes can be slow moving, but these pressures are real and could have an impact on increasing competition and reducing the dominance of such firms. This may not directly benefit value firms but would weigh on market valuations and returns of growth stock portfolios dominated by mega-cap tech companies.
Overall, mean reversion has slowed down considerably in the post-GFC era. However, we would not count it out for good. The pendulum has swung too far on the ability of large global firms to control markets and engage in global tax arbitrage. Public opinion has turned the tide and politicians and regulators are working to restore some balance, which should ultimately benefit value firms and allow for some mean reversion.
Additional Considerations
We also address two other secular forces that have implications for prospects of value investing. First, investors are increasingly aware of the bias against value stocks in most environmental, social, and governance (ESG) strategies as currently implemented. As such, we explore the degree to which the growing importance of ESG in investor portfolios could serve as a headwind to value. Second, the steady increase in intangibles as a share of corporate market value has made traditional valuation metrics less useful as a shortcut for defining value across companies. We address the nature of these distortions and implications for value strategies.
Role of ESG
The growing popularity of ESG investing has been negative for value thus far but should turn more positive longer term as investors take a more holistic approach to the strategy. The simplest consideration is that value indexes are overweight the heaviest carbon emitters, energy, materials, and utilities. Relatedly, managers and indexes with ESG mandates tend to skew toward growth and away from value. Many ESG indexes, such as the MSCI ESG and MSCI Low Carbon indexes, are constrained to control sector and country biases, limiting the skew away from value stocks. However, when looking at a universe of the most heavily owned and overweighted developed markets stocks in actively managed portfolios with ESG mandates compiled by research firm Empirical Research Partners, we found that approximately 40% of the market capitalization was in companies that MSCI classifies as value, while 60% were growth stocks. Continued capital flows into ESG managers relative to other strategies, could weigh on value stock relative performance. Global flows into ESG funds exceeded $178 billion in first quarter 2021 up from $38 billion in the same quarter last year, according to Morningstar.
However, the growth tilt to ESG strategies may fade as implementation evolves. Increasingly, and encouragingly, investors are thinking more holistically about aligning portfolios with global objectives to reach net-zero carbon emission targets and for better investment outcomes. Such strategies, when thoughtfully pursued, may result in more balanced exposures to growth and value styles than more narrowly focused ESG mandates. Policymakers globally are focused on achieving net-zero targets by around 2050, which studies show will limit temperature rise 1.5oC relative to pre-industrial levels. As the world moves to reduce carbon usage there will be transition risks to carbon-producing assets and opportunities in cleaner technologies, while physical risks to assets in more climate-vulnerable locations will increase as temperatures will still rise. Net-zero investment strategies recognize that a strategy focused on reducing exposures to companies producing fossil fuels will have limited impact, and instead take a more holistic view by providing capital (and encouragement) to high-emission industries like cement, steel, power, and transportation that are found in value indexes to help them reduce their reliance on carbon. Similarly, the net-zero transition will heighten demand for key metals, such as copper, lithium, and nickel. Mining companies are under pressure to improve ESG practices. If they do make progress, it could unlock meaningful ESG-aware capital that is focused on accelerating the transition.
Most ESG mandates in their current iteration are heavily tilted to growth sectors like technology. Although, a more comprehensive, net-zero and solutions-oriented approach recognizes the need to provide capital to both industrial companies that tend to populate value indexes and climate solutions that are often found in growth portfolios, including venture capital. In short, as more investors focus on a holistic approach to ESG, leaning in to create change, representation of value stocks in ESG portfolios could increase.
Accounting for Differences
US Generally Accepted Accounting Principles (GAAP) and International Financial Reporting Standards (IFRS) requirements create distortions when comparing companies using simple price-earnings (P/E) and price-to-book (P/B) ratios typically included in value screens. Treatment of intangibles has driven a wedge between value as measured by accounting metrics and value as measured by more thoughtful discounted cash flow analysis. These differences have become more important in recent years as intangible assets have grown in importance, especially in most Western economies. As a result, value defined by simple multiples tends to be concentrated in more cyclical and capital-intensive businesses to the exclusion of more asset-light tech and tech-enabled sectors.
These differences have been more meaningful in the United States for a couple of reasons. First, intangible assets are more prevalent in the United States than elsewhere. In the United States, intangible assets have exceeded tangible assets since the late 1990s, and as of year-end 2020 account for 90% of S&P 500 Index market value. In comparison, intangibles account for 75% of the market value of S&P Europe 350® Index, and less than half the market value of the Shanghai Shenzhen CSI 300 and Japan’s Nikkei 225 indexes.
Second, treatment of intangibles is different under US GAAP and IFRS standards. For example, under US GAAP, research & development (R&D) is treated as an operating item and is expensed as incurred, while capex are capitalized on the balance sheet and expensed over time, even as both categories of investments are expected to provide lasting benefits. This is problematic in comparing companies across industries, styles, or markets because companies that tend to invest in R&D more than capital show up as more expensive all else equal since they see lower earnings as R&D is expensed, and lower book values as such investments do not show up on balance sheets. Sectors that tend to spend more on R&D relative to capex (e.g., tech) are disadvantaged in such simple measures of value as P/E and P/B ratios. In contrast, IFRS requirements for R&D are somewhat different in that research spending is expensed under GAAP, but development spending is capitalized. The different treatment has the effect of allowing US companies to show up as more expensive in cases where there is material development spending.
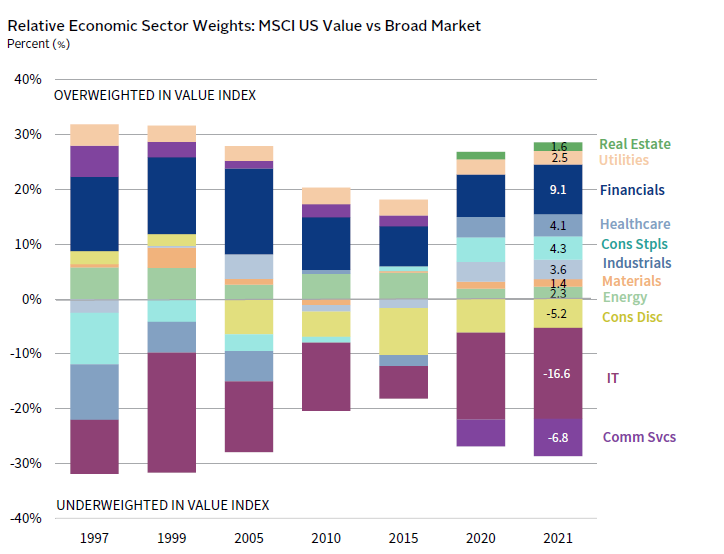
Because of these distortions, index funds that define growth and value by using P/E and P/B metrics exclude many companies with high intangibles from the value indexes, creating sector biases. For example, at the sector level, the MSCI US Value Index has a 23.4 ppt underweight to information technology and communication services and an 9.1 ppt overweight to financials. Outside the United States, the biases are less pronounced with a tech and communication services underweight of 5.4 ppts and financials overweight of 11.6 ppts relative to the MSCI World ex US Index. Incorporating metrics like price-to–cash earnings, which reflect profits based on cash revenues and exclude non-cash expenses (e.g., depreciation, amortization, and P/E ratios that capitalize R&D), can help create a less-biased value portfolio. The use of discounted cash flow valuations allows for finer tuning in adjusting for accounting and industry differences and are a helpful tool in improving the definition of value. Active value managers that have recognized these distortions are able to enhance returns by investing in good values that are excluded from the value indexes.
VALUE IS CURRENTLY HEAVILY SKEWED TOWARD FINANCIALS AND AWAY FROM TECH AND COMMUNICATION SERVICES
Source: MSCI Inc. MSCI data provided “as is” without any express or implied warranties.
Notes: The Real Estate sector was introduced in September 2016. Weights for the Communication Services sector prior to September 2018, reflect the former Telecommunication Services sector. Data for 2021 are as of June 30. All other data are as of December 31 of respective year. 1997 is the earliest year of available data; 1999 is shown to capture the peak IT underweight amid the dot-com bubble; thereafter, data is shown in five-year increments.
Conclusion
Value’s heavy overweights in financials and more cyclically oriented businesses relative to the broad market make the factor sensitive to economic growth momentum. In recent months, the acceleration of the US economy, and the more nascent acceleration of European economies, have fueled outperformance of value stocks relative to growth stock peers and the broad market. While much of the economic acceleration from re-opening in the United States has played out, the economic expansion phase should continue, as there is plenty of support for economic growth through excess savings, increased household wealth, and continued accommodative financial conditions and fiscal and monetary policy. Value stocks, particularly financials, tend to be positively correlated with rising interest rates and a steepening yield curve and that has certainly been the case in this cycle. Furthermore, earnings estimates have been rising for financials since managements over-provisioned for loan losses.
As such, value stocks provide useful diversification to portfolios with heavy tech and growth equity exposure, as tech stocks have been negatively correlated with rate moves this cycle. They also provide a nice hedge against the risks of rising taxes of foreign income and anti-trust action aimed squarely at large tech companies that have been a key driver of US growth stock earnings and margin strength. We maintain modest tilts into strategies more geared to economic growth like value, small caps, and global ex US equities. In addition, quality is a useful diversifier to portfolios, as it tends to have a low correlation to the value factor. It should also prove defensive if COVID-19 variants create economic setbacks and offer greater appeal if the economy moves out of the expansion phase into a more mature economic phase faster than we anticipate. Quality has also underperformed for much of this expansion and has become cheaper as a result. Finally, a premature tightening of interest rates relative to market expectations caused by either earlier-than-expected Fed tightening or its anticipation by investors is a threat to all risk assets, but especially those growth stocks with the longest duration pricing in high expectations for more distant earnings growth.
Value’s day in the sun is likely to continue for now, but a golden age of outperformance may need to wait until high levels of economic growth can be sustained for longer. However, investment in infrastructure, including broadband access and green technology, could serve to eventually boost value stocks by facilitating an increase in productivity through wider distribution of technological advances that could enable a non-inflationary increase in wages and fuel a virtuous cycle of increased consumer demand, leading to increased earnings, investment, and job growth. Such economic transitions take time and there is plenty of downside risk to this scenario, but the conditions it would create would be highly supportive to value outperformance making an extended stay.
OVERVIEW OF TACTICAL CA HOUSE VIEWS
June 30, 2021

Index Disclosures
MSCI US Index
The MSCI US Index is designed to measure the performance of the large- and mid-cap segments of the US market. With 627 constituents, the index covers approximately 85% of the free float–adjusted market capitalization in the United States.
MSCI US Value Index
The MSCI US Value Index captures large- and mid-cap US securities exhibiting overall value style characteristics. The value investment style characteristics for index construction are defined using three variables: book value to price, 12-month forward earnings to price, and dividend yield.
MSCI World ex US Index
The MSCI World ex US Index captures large- and mid-cap representation across 22 of 23 developed markets countries, excluding the United States. With 936 constituents, the index covers approximately 85% of the free float–adjusted market
capitalization in each country.
Nikkei 225 Index
The Nikkei 225 Index is a price-weighted index comprising Japan’s top 225 blue-chip companies on the Tokyo Stock Exchange.
Shanghai Shenzhen CSI 300 Index
The CSI 300 Index is a free-float weighted index that consists of 300 A-share stocks listed on the Shanghai or Shenzhen Stock Exchanges. The index has a base level of 1,000 on December 31, 2004.
S&P 500 Index
The S&P 500 Index measures the stock performance of 500 large companies listed on stock exchanges in the United States. The S&P 500 is a capitalization-weighted index and the performance of the ten largest companies in the index account for 21.8% of the performance of the index. The average annual total return of the index, including dividends, since inception in 1926 has been 9.8%; however, there were several years where the index declined more than 30%.
S&P Europe 350® Index
The S&P Europe 350® consists of 350 leading blue-chip companies drawn from 16 developed European markets: Austria, Belgium, Denmark, Finland, France, Germany, Ireland, Italy, Luxembourg, the Netherlands, Norway, Portugal, Spain, Sweden, Switzerland, and the United Kingdom.
Celia Dallas - Celia Dallas is the Chief Investment Strategist and a Partner at Cambridge Associates.
About Cambridge Associates
Cambridge Associates is a global investment firm with 50+ years of institutional investing experience. The firm aims to help pension plans, endowments & foundations, healthcare systems, and private clients achieve their investment goals and maximize their impact on the world. Cambridge Associates delivers a range of services, including outsourced CIO, non-discretionary portfolio management, staff extension and alternative asset class mandates. Contact us today.