US PE/VC Benchmark Commentary: Calendar Year 2024


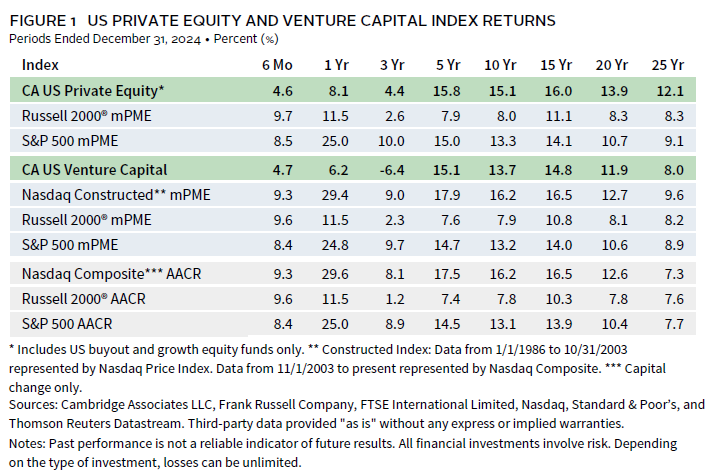
With a backdrop of strong, yet concentrated public markets, US private equity and venture capital posted mid to high single-digit returns in 2024, as venture capital bounced back from its two-year streak (2022–23) of negative returns. For 2024, the Cambridge Associates LLC US Private Equity Index® returned 8.1% and the Cambridge Associates LLC US Venture Capital Index® returned 6.2%. Growth equity managers, one of the constituencies of the private equity benchmark, posted the best return for the year, 8.8% with buyouts trailing a bit at 7.9%. Figure 1 depicts performance for the private asset classes compared to the public markets. 1
Calendar Year 2024 Highlights
- Returns for the US private equity (PE) index exceeded those of the S&P 500 for periods longer than three years as of December 31, 2024, and outpaced the small-cap index, the Russell 2000®, in all but two time periods analyzed (Figure 1). The US venture capital (VC) benchmark’s performance relative to public indexes has been less consistent, particularly against the tech-heavy Nasdaq.
- At the end of 2024, public companies accounted for a higher percentage of the market value of the VC index than of the PE one (roughly 7% and 5%, respectively). Both exposures represented declines from the prior few years. At the same time, non-US companies represented a bit more than 20% of PE and about 15% of VC.
US Private Equity Performance Insights
In many ways, 2024 was a continuation of 2023, with heightened geopolitical tensions, persistent valuation gaps between buyers and sellers, and a concentrated public market that created challenges for PE fundraising, investment activity, and exits. Growth equity performed better in 2024 than it did in 2023, and it outpaced buyouts. Limited partner (LP) cash flows rebounded somewhat in 2024, but the distribution yield remained shy of historical averages. At year end, nearly half of the index’s net asset value (NAV) resided in three vintages (2019–21), reflecting the outsized fundraising in those years.
According to Pitchbook, seven US PE-backed companies went public in 2024 and they were valued at $25 billion; the number of IPOs was the same as in 2023 and the overall value was up about $6 billion. IPO exits for US PE-backed companies have slowly picked up since nearly coming to a stop in 2022. Among the seven, three were IT or healthcare businesses, two were industrials companies, and there was one each in energy and education. The largest PE-backed IPO was StandardAero Aviation. The number of PE-backed merger & acquisition (M&A) transactions (742) trailed the total completed in 2023, the third consecutive drop in M&A exits. A quarter of the deals (184) had publicly disclosed valuations and based on the data available, the average transaction size among those deals was $1 billion, again less than the 2023 average. The second and fourth quarters in 2024 were slower by M&A number than the first and third, but average values were highest in the second and lowest in the fourth.
Vintage Years
As of December 2024, seven vintage years (2016–22) were meaningfully sized—representing at least 5% of the benchmark’s NAV—and, combined, accounted for 81% of the index’s value. Calendar year returns among the key vintages ranged from 3.2% for 2016 to 16.8% for 2022. The two largest vintages (2019 and 2021) returned 7.5% and 9.6%, respectively (Figure 2).
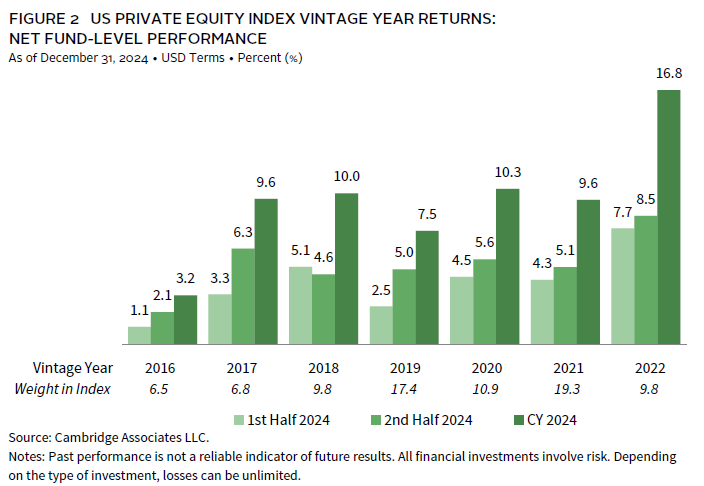
Part of the variability of returns across the vintage years was due to the performance of the individual strategies within the PE universe—buyouts and growth equity. For example, in the lowest-performing key vintage (2016), the bulk of the capital was raised by buyout funds and those managers earned only 1.2% in 2024, while growth equity returned 11.7%. For the best-performing large vintage (2022), the assets are more tilted to growth equity and both strategies earned strong returns.
From a sector perspective, in both the best- and worst-performing vintages, industrials and IT were the dominant sectors by size (accounting for about 60% of the market value at the end of the year) but the two sectors had different results. As in 2023, industrials were the main driver of the strong returns posted by the top-performing vintage (2022), while losses in this sector dampened results overall in the lowest-returning vintage (2016).
LP Cash Flows
In 2024, LP distributions ($174 billion) outpaced contributions ($143 billion), a reversal from the prior two years. Distributions rose 37% from 2023 and represented the second highest annual total ever, while capital calls decreased for the third straight year, reflecting the industry’s slower investment pace since 2021 (Figure 3). Despite the increase in capital distributed to LPs, the distribution yield—calculated by dividing the distributions by the NAV—remained low for the third consecutive year.
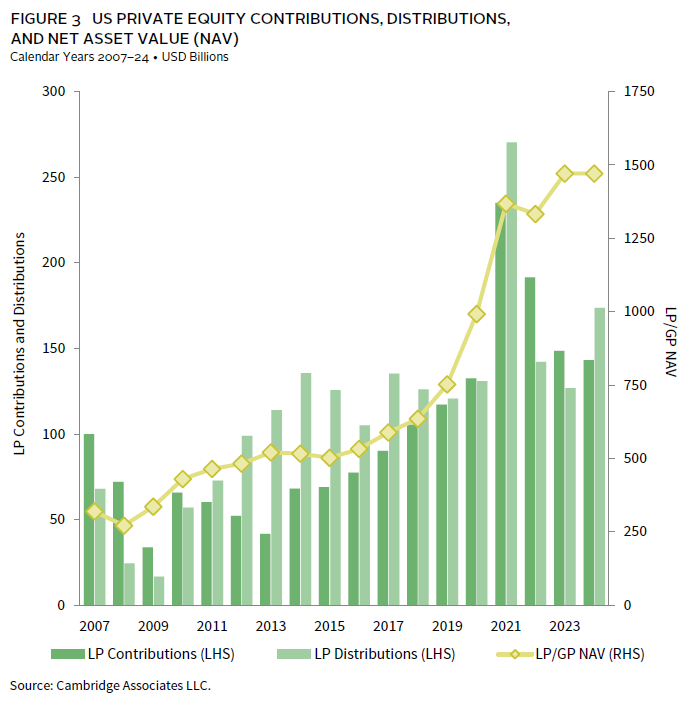
Four vintage years (2021–24) represented 84% ($121 billion) of the capital calls, with each drawing down at least $17 billion during the year; the 2022 vintage called $41 billion, the most of the four. Eight vintages (2014–21) accounted for 83% of the distributions, with amounts ranging from roughly $10 billion (2020 vintage) to nearly $30 billion (2019 vintage).
Sectors
Figure 4 shows the Global Industry Classification Standard (GICS®) sector breakdown by market value of the PE index and a public market counterpart, the Russell 2000® Index. The comparison provides context when comparing the performance of the two indexes. The PE index continued to have a significant overweight to IT and meaningful underweights to financials, energy, and real estate (the latter two are reflected in the “other” category).
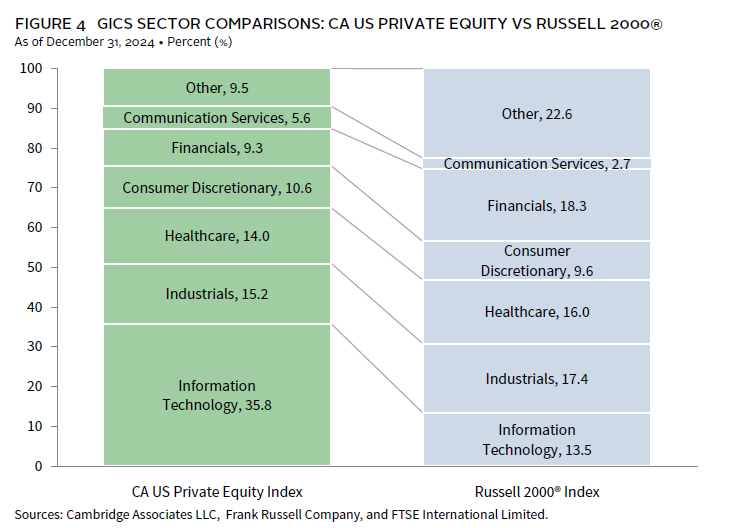
As of December 2024, there were six key sectors by size and combined they represented 90% of the index’s market value; IT was by far the largest (36% of the index’s market value). Two of the six large sectors earned double-digit returns for the year (financials and industrials) and among all six, calendar year returns ranged from 4.9% for healthcare to 12.1% for financials.
Three sectors garnered about two-thirds of the capital invested by US PE managers in 2024—IT (31%), industrials (19%), and healthcare (17%). Over the long term, managers have allocated about 53% of their capital to those sectors. The biggest driver of the difference is the percentage of capital allocated to IT, which historically was about 23% of invested capital. Additionally, since inception of the index, consumer discretionary, communications services, and financials all garnered at least 10% of the capital invested by managers. During 2024, the three combined accounted for only 21% of activity.
US Venture Capital Performance Insights
The Cambridge Associates US VC index rebounded in 2024 following two years of negative returns in 2022 and 2023, but to some extent the industry continued to endure a challenging fundraising, investing, and exit environment. Younger vintages outperformed older ones and performance for the largest sectors (IT and healthcare) trailed that of smaller ones.
According to the National Venture Capital Association and Pitchbook, by number, US VC managers completed slightly fewer deals in 2024 than they did in 2023 (14,612 from 14,851), but when measured by value, 2024’s deals were meaningfully higher ($213 billion compared to $163 billion in 2023). Like investments, exits by number in 2024 were similar to those in 2023 (1,186 versus 1,155), but larger by value ($158 billion from $116 billion). Lost in the similarities by total number are the differences within exit types. For example, the number of public listings fell 26% (65 from 88), while the number of M&A and buyouts increased slightly. Values for M&A and public listings were both meaningfully higher in 2024 (44% higher), while the value of buyout exits was only marginally higher than in the previous year.
Vintage Years
As of December 2024, nine vintage years (2014–22) were meaningfully sized and, combined, accounted for 80% of the index’s NAV. Returns across the nine vintages ranged from 0.7% (2018) to 25.3% (2022), a wide dispersion that in part was related to when funds were raised. Those raised prior to 2020 fared much worse than those raised afterwards (Figure 5). For all but one of the large vintages (2017), performance during the second half of the year was better than that of the first half.
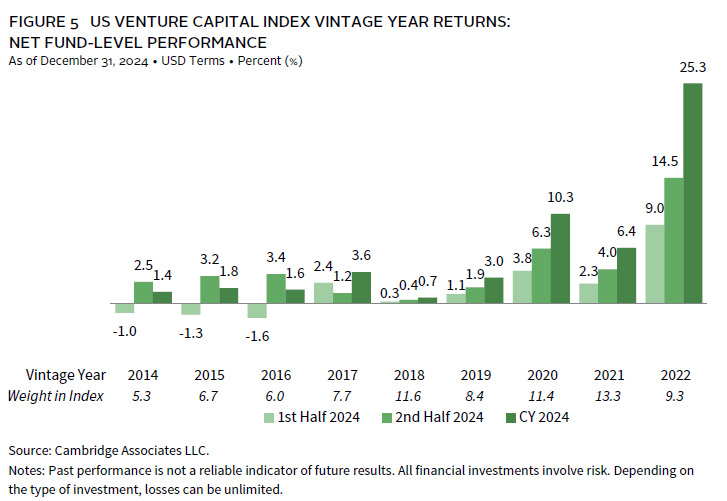
For the best-performing vintage (2022), all key sectors earned double-digit returns, and in the worst-performing vintage (2018), all key sectors posted negative or low single-digit results.
LP Cash Flows
US VC LP cash flows were more robust in 2024 than 2023, with capital call and distribution totals increasing by roughly 40% each. Managers called $46 billion from LPs—the second highest for any year on record—and returned $27 billion (Figure 6). Over the last three years (2022–24), managers have called 1.5x as much capital as they have distributed, reflecting the period’s lower-than-average distribution yield (distributions/NAV) for the asset class.
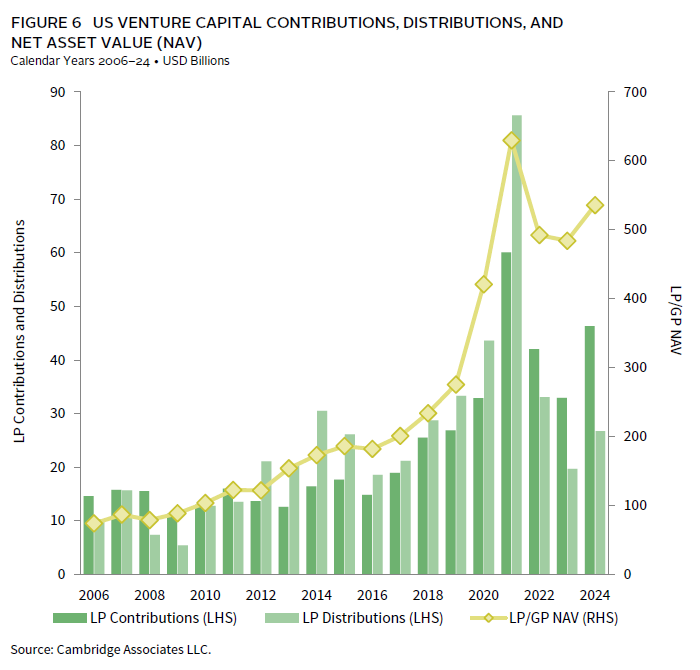
While four vintages (2021–24) accounted for 87% (roughly $40 billion) of the total capital called during the year, 12 vintages (2011–22) made up the same proportion of distributions. Each of the four vintages driving contributions called at least $8 billion. Among the widespread drivers of distributions, each of the 12 vintages returned between $1 billion and $3 billion, with the 2018 cohort at the high end of the range.
Sectors
Figure 7 shows the GICS® sector breakdown of the VC index by market value and a public market counterpart, the Nasdaq Composite Index. The breakdown provides context when comparing the performance of the two indexes. The chart highlights the VC index’s meaningfully higher exposures to healthcare, financials, and industrials. Both indexes are heavily tilted toward IT, and Nasdaq weightings in communication services and consumer discretionary have remained much higher than those of the VC index.
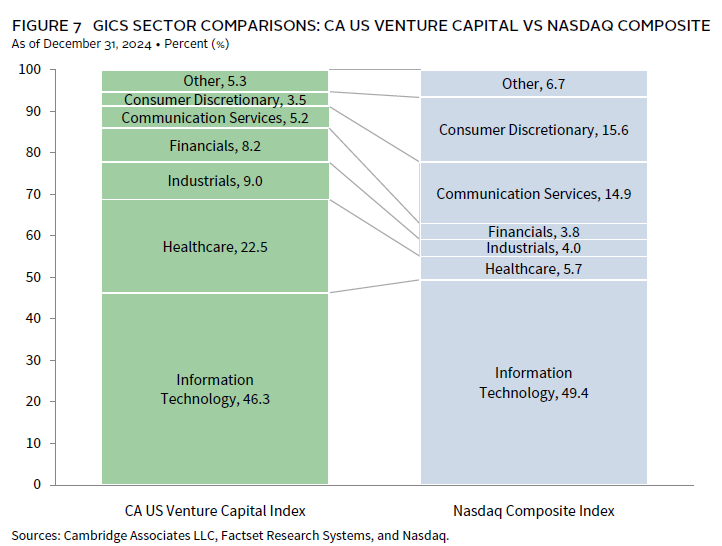
Collectively, the five meaningfully sized sectors made up 91% of the VC index. Performance among the five ranged from 2.1% for communication services to 38.8% for industrials. During the year, VC managers in the index allocated almost 80% of their invested capital to two sectors, IT (47%) and healthcare (32%). Only two other sectors, financials (5%) and industrials (6%), garnered even 5% of capital during the year. Over the long term, two key sectors—IT and healthcare—have attracted more than 70% of managers’ capital, and 2024 totals for financials and industrials were on par with long-term norms.
Figure Notes
US Private Equity and Venture Capital Index Returns
Private indexes are pooled horizon internal rates of return, net of fees, expenses, and carried interest. Returns are annualized, with the exception of returns less than one year, which are cumulative. Because the US private equity and venture capital indexes are capitalization weighted, the largest vintage years mainly drive the indexes’ performance.
Public index returns are shown as both time-weighted returns (average annual compound returns) and dollar-weighted returns (mPME). The CA Modified Public Market Equivalent replicates private investment performance under public market conditions. The public index’s shares are purchased and sold according to the private fund cash flow schedule, with distributions calculated in the same proportion as the private fund, and mPME net asset value is a function of mPME cash flows and public index returns.
Vintage Year Returns
Vintage year fund-level returns are net of fees, expenses, and carried interest.
Sector Returns
Industry-specific gross company-level returns are before fees, expenses, and carried interest.
GICS® Sector Comparisons
The Global Industry Classification Standard (GICS®) was developed by and is the exclusive property and a service mark of MSCI Inc. and S&P Global Market Intelligence LLC and is licensed for use by Cambridge Associates LLC.
About the Cambridge Associates LLC Indexes
Cambridge Associates derives its US private equity benchmark from the financial information contained in its proprietary database of private equity funds. As of December 31, 2024, the database included 1,661 US buyout and growth equity funds formed from 1983 to 2024, with a total value of $1.6 trillion. Ten years earlier, as of December 31, 2014, the index included 958 funds whose total value was $515 billion.
Cambridge Associates derives its US venture capital benchmark from the financial information contained in its proprietary database of venture capital funds. As of December 31, 2024, the database comprised 2,625 US venture capital funds formed from 1981 to 2024, with a value of $536 billion. Ten years prior, as of December 31, 2014, the index included 1,547 funds whose value was $173 billion.
The pooled returns represent the net end-to-end rates of return calculated on the aggregate of all cash flows and market values as reported to Cambridge Associates by the funds’ general partners in their quarterly and annual audited financial reports. These returns are net of management fees, expenses, and performance fees that take the form of a carried interest.
About the Public Indexes
The Nasdaq Composite Index is a broad-based index that measures all securities (more than 3,000) listed on the Nasdaq Stock Market. The Nasdaq Composite is calculated under a market capitalization–weighted methodology. The Russell 2000® Index includes the smallest 2,000 companies of the Russell 3000® Index (which is composed of the largest 3,000 companies by market capitalization). The Standard & Poor’s 500 Composite Stock Price Index is a capitalization-weighted index of 500 stocks intended to be a representative sample of leading companies in leading industries within the US economy. Stocks in the index are chosen for market size, liquidity, and industry group representation.
Footnotes
Caryn Slotsky - Caryn Slotsky is a Managing Director for the Private Investment Strategy Research team at Cambridge Associates.
Wyatt Yasinski - Wyatt Yasinski is an Associate Investment Director for the Private Investment Strategy Research team at Cambridge Associates. FootnotesCambridge Associates’ mPME calculation is a private-to-public comparison that seeks to replicate private investment performance under public market conditions.
Drew Carneal - Drew Carneal is an Associate Investment Director for the Private Investment Strategy Research team at Cambridge Associates. FootnotesCambridge Associates’ mPME calculation is a private-to-public comparison that seeks to replicate private investment performance under public market conditions.
About Cambridge Associates
Cambridge Associates is a global investment firm with 50+ years of institutional investing experience. The firm aims to help pension plans, endowments & foundations, healthcare systems, and private clients achieve their investment goals and maximize their impact on the world. Cambridge Associates delivers a range of services, including outsourced CIO, non-discretionary portfolio management, staff extension and alternative asset class mandates. Contact us today.