Planning for the US Presidential Election

Do investors stand to gain more from a Trump victory or a Biden win in November’s US general election? Equity returns under Democratic presidents have been higher than under Republican presidents during their full time in office on average, but evidence that a president’s party affiliation has a statistically significant impact on equity returns is thin. Presidents often have a mix of market-friendly and market-unfriendly policies. Mitigating factors, such as a divided government, can offset market concerns or enthusiasm relating to one specific candidate’s policies. Investors should not tweak portfolios based on election prognostication.
Prior Election Cycles
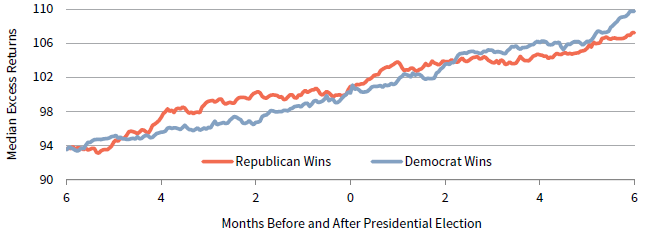
While some investors assume that a particular candidate will reliably be good or bad for markets, based on policy proposals or party affiliation, evidence doesn’t support this theory. Moreover, what presidents do while in office may not be as important as when they get elected, 1 as investor attitudes toward risk, corporate earnings, and valuations are just some of the external environment factors that drive asset performance. An analysis of excess returns in the six months before and after presidential elections since the Great Depression shows that, on average, returns have been similar regardless of party (Figure 1).
FIGURE 1 EXCESS RETURNS NEAR US PRESIDENTIAL ELECTIONS BY PARTY AFFILIATION
1928–2016 • Median Excess Return Performance • Rebased to 100 Each Election Day
Source: Fama and French data library.
Notes: The data reflect the median US market excess return across the last 23 US presidential elections, grouped by party affiliation. Data are daily and start six months prior to the election and end six months after the election.
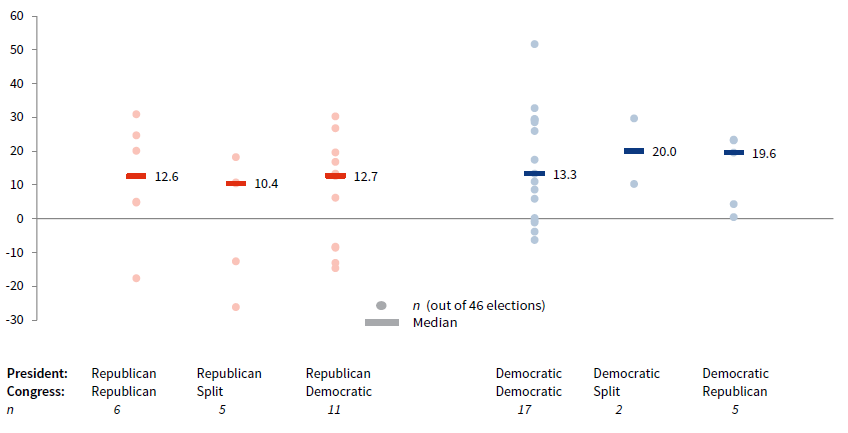
The party composition of Congress is another key variable. Some strategists note that gridlock 2 boosts markets, with a divided government less able to pass legislation that would create unwelcome surprises for investors. Historical data support the theory, but the dearth of observations limits meaningful conclusions. In the subsequent year following every Federal election (including mid-terms) since 1928, the median excess return has been 11.8%—strong in comparison to the average annual excess return of 6.4% over the full period. The median returns were highest when a Democratic president combined with either a split Congress or a Republican Congress (Figure 2). However, the only two observations of a Democratic president with a split Congress are the Obama administration’s 2010 and 2012 elections, which coincided with a sharp market recovery in the aftermath of the Global Financial Crisis. Gridlock is not a necessity for strong returns. In fact, the best subsequent one-year excess return happened in 1932 under a Democratic President and Democratic Congress, after Franklin D. Roosevelt defeated incumbent Herbert Hoover amid the Great Depression. Overall, strong one-year returns have occurred regardless of the partisan composition across the legislative and executive branches.
FIGURE 2 SUBSEQUENT 1-YR EXCESS RETURNS AFTER FEDERAL ELECTIONS
1928–2018 • Percent (%) • Based on Control of White House and Congress
Source: Fama and French data library.
Notes: Data based on the results following 46 elections since 1928, including midterms. Excess return is calculated as the total return minus the one-month T-bill rate.
Election Odds
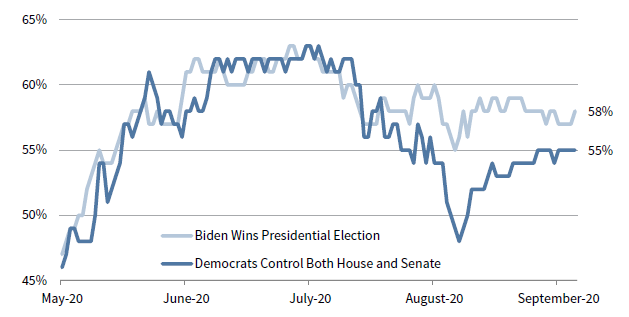
As the 2016 election demonstrated, polls can mislead, and rapid shifts in sentiment close to election day are always possible. Betting markets currently indicate a Biden victory, but the implied probability of a Democratic congressional sweep in November is slightly lower (Figure 3). Presidential election poll aggregators also peg Biden as the favorite. Clinton had also enjoyed polling leads in the runup to the 2016 election, but several key differences between the 2016 and 2020 elections warrant consideration. First, polling data indicate that undecided and third party–candidate voters will be less numerous than in 2016. In September 2020, Trump and Biden collectively had the support of 93% of voters, while in September 2016, 88% of those polled supported Clinton or Trump. The number of undecided voters is highly correlated with polling volatility. In 2016, many late deciders broke to Trump. Third party candidates received 6% of the vote in 2016, the highest share such candidates had received since 1996. The 2004, 2008, and 2012 elections each only saw between 1% and 2% of votes go to third party candidates. Second, Biden has a much lower unfavorability level than Clinton did in 2016. According to an NBC/Wall Street Journal poll, 43% of voters had a “very negative” view of Hillary Clinton in July 2016; just 33% of voters shared that view of Joe Biden in July 2020. Finally, Biden has held a more stable lead throughout 2020 than Clinton did in 2016. Still, these factors alone do not foretell any outcome, and forecasts cannot always account for real world events that could occur over the next month ahead of the election. Presidential debates could play an outsized role in voter sentiment ahead of the election, as could future developments in the COVID-19 crisis and their associated impact on the economy.
FIGURE 3 BETTING MARKETS INDICATE A BIDEN VICTORY
May 26, 2020 – September 27, 2020
Source: PredictIt.org.
Note: Probablities of Biden winning the presidential election and Democrats controlling Congress are based on PredictIt
market odds.
Indeed, the economy is typically the bellwether for presidential elections. The United States is mired in a deep recession, and election year economic downturns typically imperil the reelection prospects of incumbents. But this recession stems from the COVID-19 pandemic rather than the business cycle. This creates a unique situation for President Trump, who enjoys relatively strong approval on his handling of the economy but low approval on handling the pandemic. A Pew Research Center poll in August found that only 37% of Americans gave Trump good or excellent ratings on his handling of the coronavirus, an 11 percentage-point decline from March. More than 60% of voters said that the virus will be a very important factor in their decision for who to support in the election. If COVID-19 concerns wane in the weeks leading up to the election, it would boost Trump’s probability of winning significantly.
Market Implications and Policy Differences
Market participants have grown anxious about a contested election outcome or an unclear election result. Such concerns are being reflected in options markets, which are pricing in increased equity volatility in the fourth quarter—higher than what is typically seen during presidential elections. While we cannot rule out short-term pressure on markets in this situation, ultimately, Americans would still likely have a clear winner by mid-December.
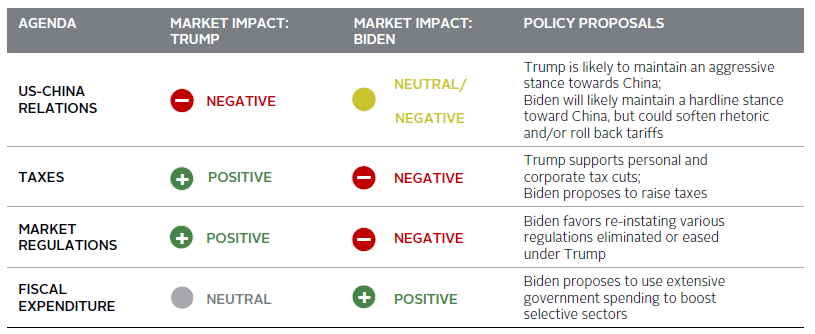
A decisive Trump victory and Republican congressional sweep could send equities sharply higher on prospects of further tax cuts and deregulation. A Trump or Biden victory with a split (or opposition) congress could evoke a more muted equity response with the potential for gridlock. Also, a Biden victory and Democratic congressional sweep could be a negative for equities because of Biden’s plans to increase taxes and increase regulation (Figure 4). But these are simplistic assessments that omit the impact of offsetting policies, and market results don’t often hinge on a president’s campaign promises.
FIGURE 4 CANDIDATES’ POLICIES HAVE MIXED IMPACT ON EQUITY MARKET RETURNS
Source: Cambridge Associates LLC.
Tax policy is always an important issue for investors and businesses. Biden proposes to: raise the corporate tax rate from 21% to 28%, restore the top marginal income tax rate to 39.6%, and tax capital gains as ordinary income (for those earning more than $1 million). Investors subject to US tax should at least consider realizing planned long-term capital gains before the end of 2020, depending on the election result. A Democratic sweep could accelerate Biden’s proposed tax changes to take effect as early as calendar year 2021. Trump’s tax proposals, on the other hand, are lighter in detail, but target lower taxes for businesses and individuals. One such possibility is an extension of the 2017 Tax Cuts and Jobs Act. On the surface, it seems clear that high-bracket taxpayers would benefit under Trump’s tax policy, as would US corporations. On the other hand, Biden’s corporate tax hikes could meaningfully hit corporate earnings per share. Still, fiscal spending associated with Biden’s progressive agenda has been estimated at $6 trillion, and this could boost revenue and offset tax impacts for firms in healthcare, renewable energy, infrastructure, and education.
US-China relations also remain a key issue for investors. Before the COVID-19 pandemic swept across the world, the US-China trade war was one of the most closely watched economic stories. Indeed, the 2018 market sell-off was largely driven by deteriorating relations between the world’s two largest economies. After a brief détente in early 2020, tensions between the United States and China have ramped up again. President Trump is expected to continue his aggressive stance on China if reelected. Biden is also expected to continue a hardline approach toward China, but if he adopts a more diplomatic approach or considers scaling back tariffs, tensions could ease, offering stability to markets.
Summing It Up
The 2020 election is unpredictable and will capture disproportionate investor attention in the weeks ahead. We warn investors against positioning for any one specific outcome or overestimating the lasting impact of market volatility around the election. Presidential agendas are rarely all good or all bad for markets. For instance, Biden’s plans to increase taxes could be offset by increased fiscal spending, while Trump’s plans to continue deregulation could be offset by a continuation of US-China tensions. Moreover, policy proposals are just that—proposals. Congressional control is imperative for swift implementation of policies, and gridlock can stifle or water down the impact of such proposals. While there is some evidence that markets can perform better in gridlock, equities can post positive returns regardless of partisan composition, as various other factors can impact returns. Although a tail event such as a contested election result or a delayed outcome determination would unsettle markets, we would expect associated volatility to persist for weeks rather than months, and much of this volatility risk may already be priced in. This general election will be one of the most unusual in modern history, but investors shouldn’t overestimate the importance of elections on asset prices and should refrain from allowing politics to influence long-term investing decisions.
Footnotes
Sean Duffin - Sean Duffin is a Senior Investment Director for the Capital Markets Research Team at Cambridge Associates.
About Cambridge Associates
Cambridge Associates is a global investment firm with 50+ years of institutional investing experience. The firm aims to help pension plans, endowments & foundations, healthcare systems, and private clients achieve their investment goals and maximize their impact on the world. Cambridge Associates delivers a range of services, including outsourced CIO, non-discretionary portfolio management, staff extension and alternative asset class mandates. Contact us today.