Endowment Radar Study 2025: A Widening Divide


Endowments are more than just financial reserves—they are strategic resources that empower higher education institutions to navigate and adapt to mounting political and operational pressures. The 2025 Endowment Radar Study reveals a widening divide: well-endowed institutions have more capacity to deliver their mission, while those with smaller endowments face growing financial vulnerability. The Endowment Radar tool analyzes these dynamics, starting with the stories of institutions at the extremes—those most at risk and those best positioned to succeed. We then explore what these findings reveal for institutional medians and trends, and implications for institutions that are strong in some metrics but weaker in others. Lastly, we will illustrate how the Endowment Radar tool can guide critical financial decisions and strategic planning.
2025 Endowment Radar: Stories from the edges
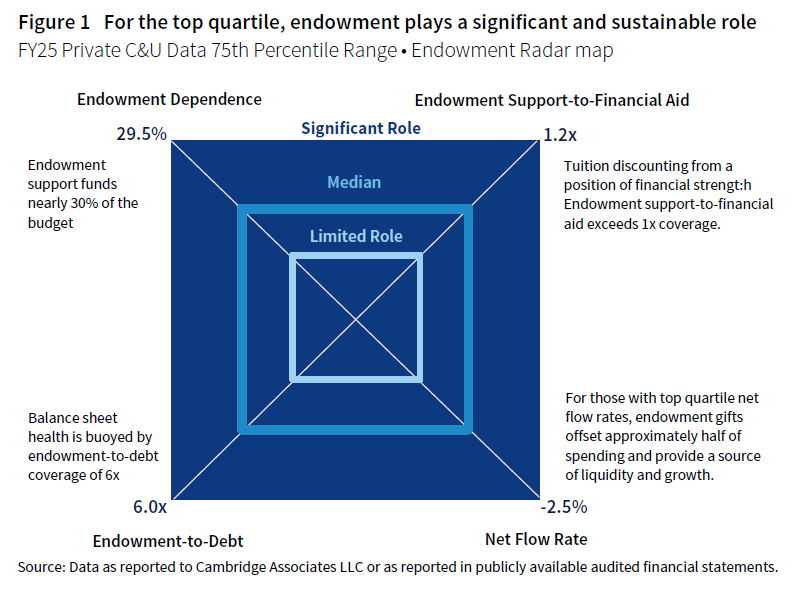
At the outer edge 1 of the Endowment Radar map, we show results for the most well-endowed institutions where the endowment plays a significant and sustainable role. Endowment distributions cover nearly 30% of the operating budget and exceed the tuition discounts awarded for financial aid and scholarships (Figure 1). A 6x endowment-to-debt ratio provides balance sheet ballast and capacity for strategic uses of endowment and long-term debt. For those with top-quartile net flow rates, the significant role of the endowment is sustainable, or may even expand, because the combined rates of spending and fundraising enable the endowment to grow with the enterprise.
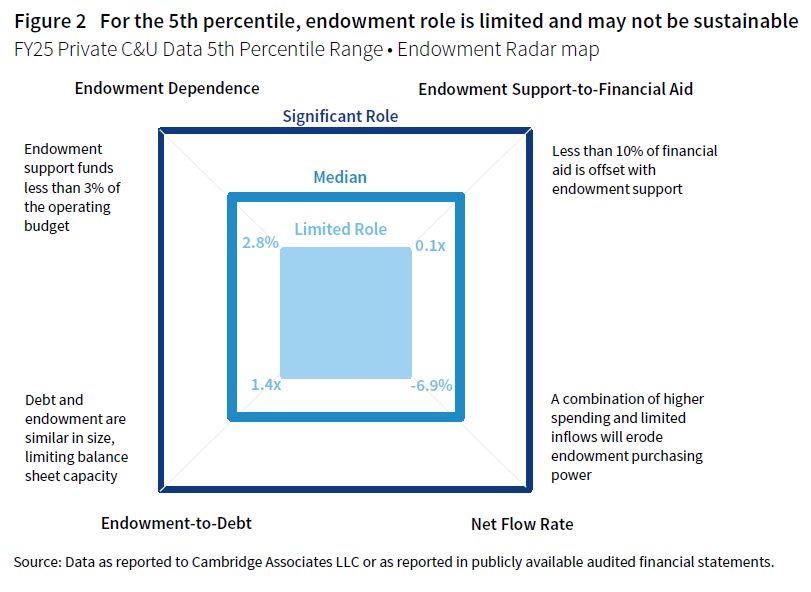
There is a very different story at the inner edge of the Endowment Radar map. At the 5th percentile, institutions have limited endowment support and net flow is stressed, compromising the endowment’s future role (Figure 2). Endowment spending supports less than 3% of the operating budget and replaces less than 10% of financial aid and scholarships. The endowment market value only slightly exceeds long-term debt at a ratio of 1.4x, limiting balance sheet capacity to absorb strategic initiatives. The -6.9% net flow rate reflects unsustainable spending levels and limited fundraising, which threaten long-term endowment purchasing power.
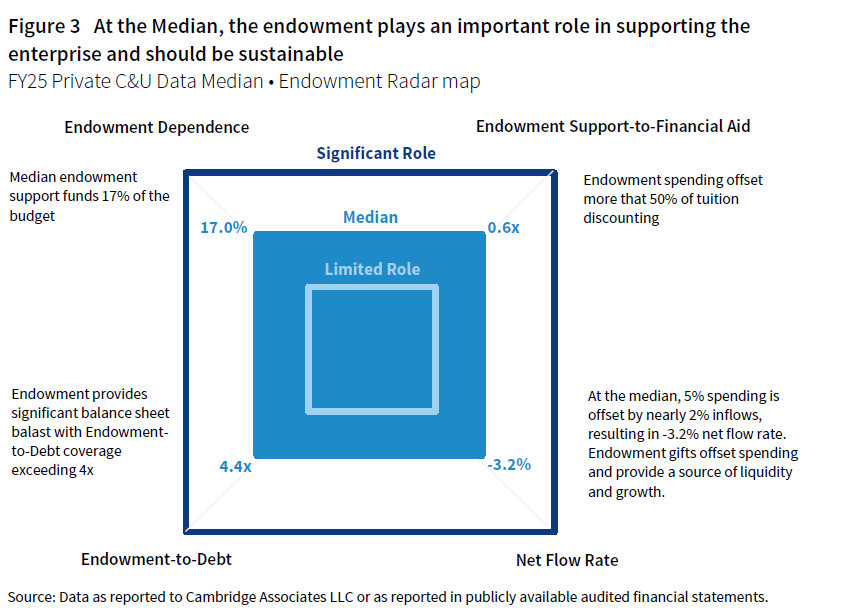
Median Endowment Radar metrics represent the midpoint, where the endowment plays an important and sustainable role. But this cohort does not enjoy the same level of flexibility and financial strength as the more well-endowed institutions in 75th percentile (Figure 3). Endowment spending funds 17% of operating expenses and offsets more than half of the tuition discounts. An endowment-to-debt ratio of 4.4x coverage indicates balance sheet health. The net flow rate of -3.2% indicates this role should be sustainable in the near term.
Notable shifts in 2025: The growing gap between revenue and expenses
Endowment Radar results in our study were relatively unchanged from 2024 to 2025, with two notable exceptions that highlight the growing wealth gap:
- An increase in median endowment dependence showed a growing reliance on endowment support for the operating budget.
- For the highest spending institutions, the rate of higher spending exceeded historic levels and threatened to erode endowment purchasing power.
Median endowment dependence grew from 16.3% to 17.0%. There are different individual reasons for higher reliance on the endowment. For some institutions, the growth may be explained by endowment growth generating higher levels of funding for the operating budget. For institutions with operating challenges, the growth in dependence may be due to higher spending rates that are needed to fund more of the budget.
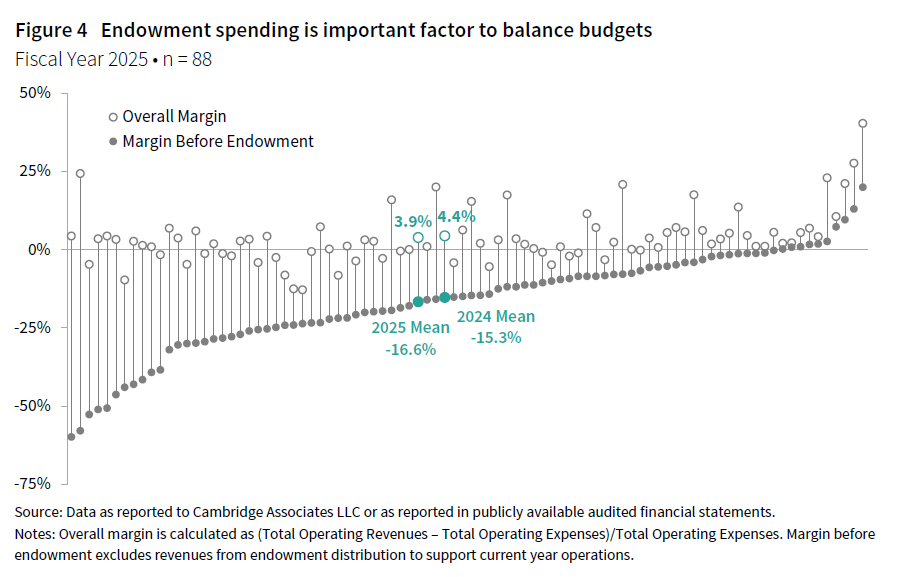
These varying results are shown when we review operating margins before and after endowment spending (Figure 4). While there is a wide range of margins across institutions, the pattern is consistent: endowment distributions provide a meaningful cushion that shifts operating results from deficit to modest surplus for many colleges and universities. When 2025 margins are compared to the prior fiscal year:
- The average margin before endowment fell from -15.3% in 2024 to -16.6% in 2025, suggesting the higher education business model is increasingly reliant on endowment spending to buffer operations.
- The average overall margin declined from 4.4% in 2024 to 3.9% in 2025, providing some cushion, but less than in 2024.
- The majority (72%) of institutions had a positive overall margin in 2025, while 28% broke even or had a negative overall margin.
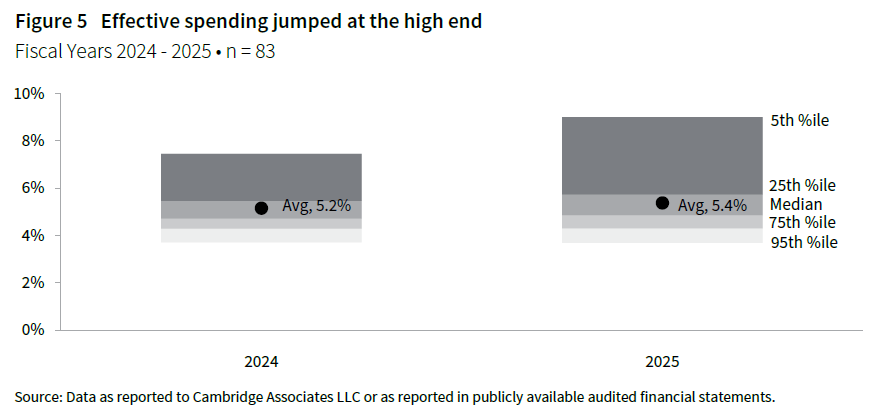
Some institutions relied on higher spending from the endowment to respond to operating challenges (Figure 5). Spending pressures became more pronounced at the highest spending quartile, where effective rates ranged from 5.7% to 9.0%. Spending at the 5th percentile jumped from 7.4% last year to nearly double digits this year. The upward shift in spending suggests continued operating headwinds, placing increased pressure on endowment assets as a source of liquidity and budgetary support.
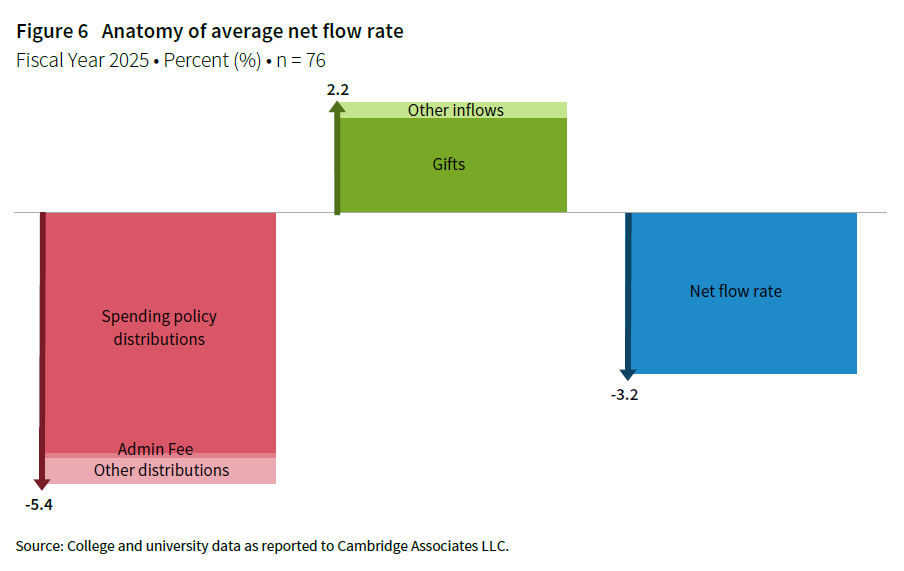
Spending directly impacts the purchasing power of existing endowment funds. Over time, high spending can erode this purchasing power if withdrawals outpace investment returns, while disciplined spending can help preserve and grow the endowment. However, spending is only part of the equation. The net flow rate (Figure 6) is an important component of the Endowment Radar because it captures the combined effect of both outflows (i.e., spending) and inflows (i.e., new gifts or contributions). By considering net flow, we gain a more complete picture of the endowment’s future role and sustainability. Positive inflows strengthen the endowment’s purchasing power and expand its capacity to support institutional priorities, making net flow a key indicator of the long-term role of the endowment.
Endowment Radar in action: Addressing strategic questions
Endowment Radar is designed to inform decisions about immediate needs and long-term priorities. The annual results provide a framework for discussions about financial sustainability and the role of the endowment in the future. We consider key questions raised by Endowment Radar case studies.
1. Do we have capacity on our balance sheet?
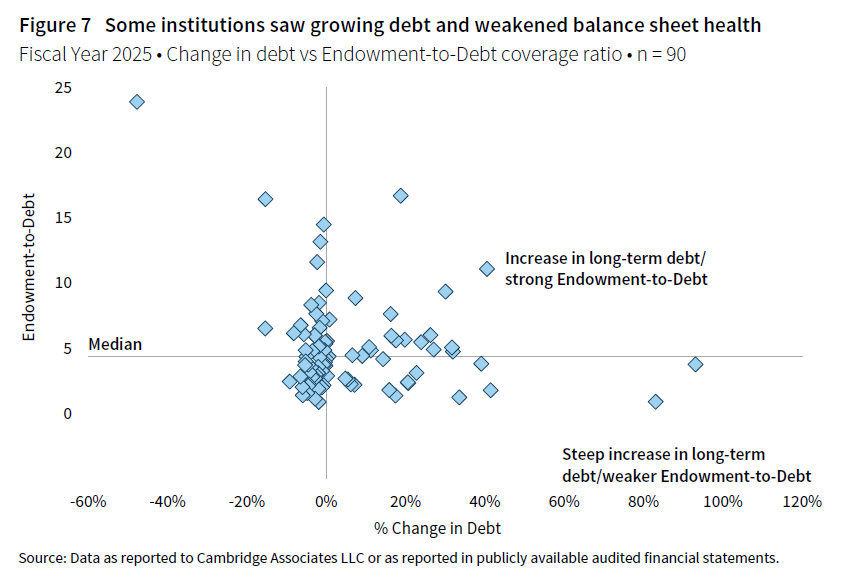
The endowment-to-debt ratio is an indicator of balance sheet strength and borrowing capacity. The ratio can inform discussions about the strategic use of debt in the near term and long term, as well as the role of the endowment required to support financing plans. Many institutions increased their long-term debt obligations in 2025 (Figure 7). Some borrowed more and continued to maintain a healthy endowment-to-debt ratio, whereas increased borrowing by others resulted in a less healthy ratio.
It is important for fiduciaries to understand the connections between the endowment and debt obligations, including future capital needs, debt repayment schedules, refinancing expectations, and key ratios and covenants that may involve endowment market values and/or liquidity.
2. Is our increased commitment to financial aid sustainable?
A well-endowed institution is in an enviable position, as the endowment plays a significant role in supporting the operating budget, financial aid strategy, and the balance sheet. Figure 8 shows the results for a university that increased its commitment to financial aid in 2025.
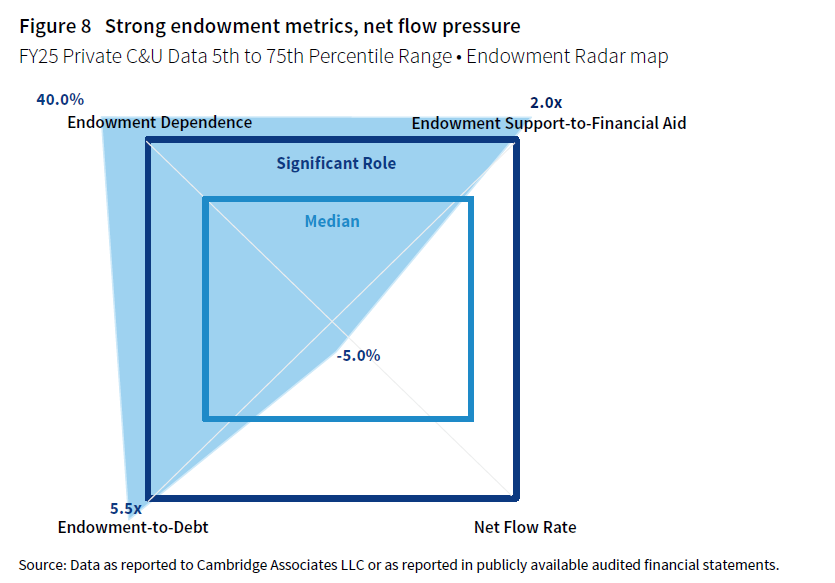
The institution maintained strong Endowment Radar metrics, but the growing role of the endowment required a 6% spending rate. With minimal inflows of 1.0%, the net flow rate was -5.0%. The results on the Endowment Radar map are designed to spur a discussion about the endowment’s capacity going forward. For example, will the endowment be part of an ongoing strategy to increase financial aid or will other funding contribute? Endowment Radar can be a communication tool with donors, who may be motivated to sustain this commitment with new endowment gifts or annual gifts.
3. Do we have a healthy reliance on the endowment?
Endowment support is an important source of operating funding, but overreliance on the endowment can jeopardize that support in future years. The Endowment Radar map in Figure 9 shows an institution under stress.
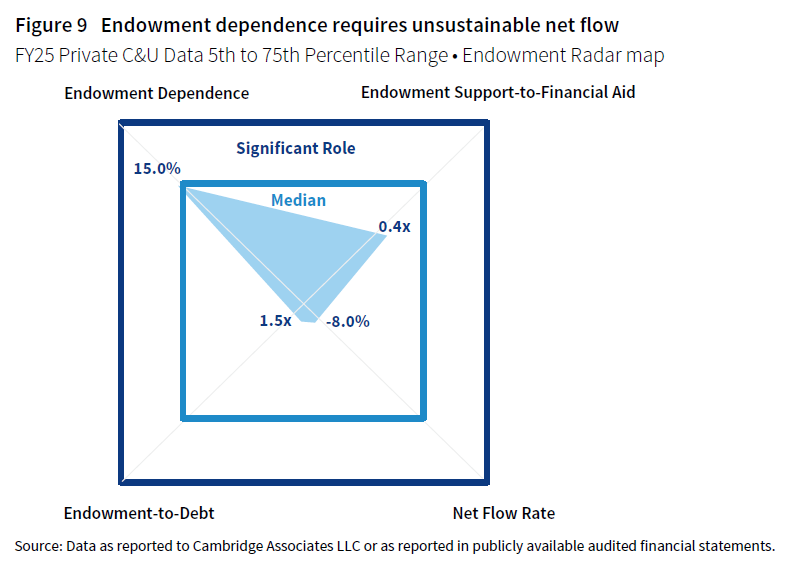
Endowment reliance of 15% comes with a weak endowment-to-debt ratio and unsustainable -8.0% net flow rate (10% spending offset by 2% inflows). Endowment support-to-financial aid also indicates that the endowment is not keeping pace with the university’s discount rate. This institution is under-endowed. A more sustainable financial equation will require greater reliance on other revenue sources, an infusion of endowment funds and/or cuts to expenses.
Conclusion
The 2025 Endowment Radar Study underscores the increasingly strategic role of the endowment as colleges and universities face persistent financial, political, and operational challenges. Endowment wealth has become a defining factor in institutional resilience and competitiveness. The Endowment Radar provides a snapshot of endowment health and impact. The map is designed to inform discussions about immediate funding needs and long-term priorities. Ultimately, it provides a framework for navigating a dynamic higher education environment and considering how endowment resources will empower institutions to fulfill their missions for generations to come.
Explore our Endowment Radar tool and request your free, customized endowment radar chart to discover how to maximize the success of your endowment here.
Geoffrey Bollier and Raul Najera Bahena also contributed to this publication.
Footnotes
Tracy Filosa - Tracy is a Managing Director and Head of CA Institute.
About Cambridge Associates
Cambridge Associates is a global investment firm with 50+ years of institutional investing experience. The firm aims to help pension plans, endowments & foundations, healthcare systems, and private clients achieve their investment goals and maximize their impact on the world. Cambridge Associates delivers a range of services, including outsourced CIO, non-discretionary portfolio management, staff extension and alternative asset class mandates. Contact us today.