Buying India’s Growth Story, But Not Today

India has garnered significant investor attention, given its recent economic and stock market outperformance, its large and growing population, and its rapid ascent as a manufacturing alternative to China. But should investors buy the hype surrounding Indian equities? We think India’s bright economic prospects have the potential to drive strong equity market returns in the long run; however, we do not think Indian equities offer a compelling overweight over a shorter-term, tactical horizon.
India’s Long-Term Growth Opportunity
India’s demographic tailwind is the keystone supporting its growth outlook. Fundamentally, economic growth is driven by labor force expansion and productivity. While the latter is notoriously difficult to forecast, the former is more clear-cut, and India’s demographics reign supreme. By some estimates, India is already the most populous country in the world, with its current size of 1.4 billion expected to continue growing to 1.7 billion over the next 30 years. Sheer size is one factor, but the underlying age distribution is the true source of optimism. Today, more than half of the population is under the age of 30. By 2050, the median age is expected to rise to only 38 years old, which is already the median age in the United States and China today.
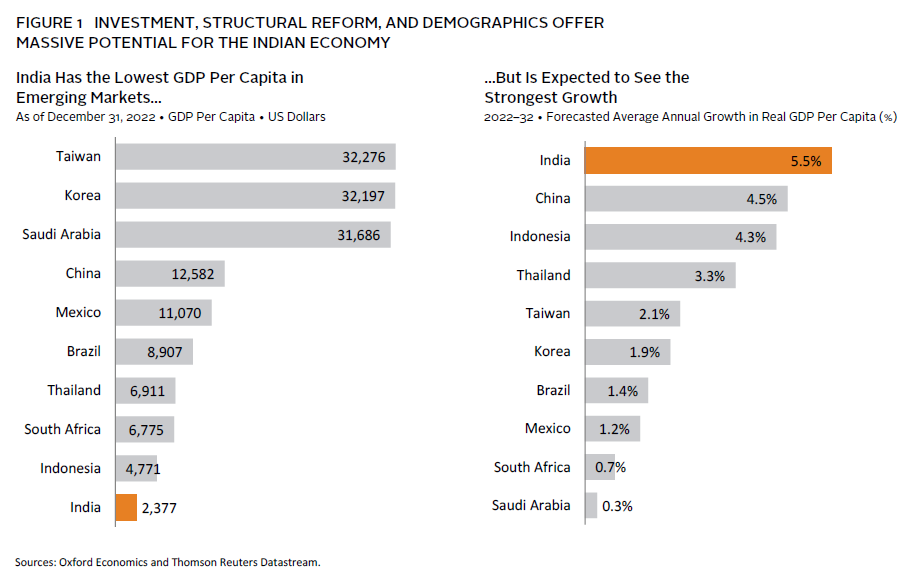
India is also transforming its economy to benefit from several emerging structural themes. Chief among them are major investments in infrastructure and manufacturing, which have been well-resourced by the government (Figure 1). The latest central government budget proposal included a more than 30% increase in investment spending to INR 10 trillion (3.3% of GDP), the highest share of investment spend to GDP in the last several decades. As firms look to diversify global supply chains, India has rolled out a Production-Linked Incentive Scheme to boost investment and output across several industries, including mobile phones, semiconductors, solar panels, and automobiles. In addition, the banking sector is on more solid footing compared to roughly five years ago, when banks faced high levels of non-performing loans. Credit growth expanded at the fastest clip in more than a decade in 2022, which is supporting the bourgeoning investment push.
Robust reforms pushed through over the past decade have improved the ease of doing business in India. These included the simplification of the tax code, liberalizing foreign investment regulations, demonetization, bankruptcy reform, and the recapitalization of state-owned banks, among others. In addition to reducing red tape and abating high levels of corruption, the reforms have catalyzed a shift in bringing “informal”—off-the-books—firms and enterprises into the formal and regulated economy. Despite these efforts, the informal economy still accounts for the vast majority of employment in India and makes up a hefty proportion of GDP by some estimates, suggesting significant further gains are available.
India’s economy operates through a unique and pervasive digital ecosystem. The country’s biometric ID system—Aadhaar—is the largest in the world, roughly half the population use smartphones, and data costs have dwindled to around $0.10 per gigabyte. This has greatly reduced economic frictions, from opening an investment account to executing digital payments, and is likely to yield significant dividends from a growing middle class and continued development of high-tech industries.
Risks to the Outlook
There are several factors that may pose a challenge to the structural Indian growth story. First, education and employment opportunities need to expand to meet the demands of the growing working-age population. In addition to new labor force entrants, many Indians are leaving the agriculture sector as the country becomes more urbanized. This places a high degree of execution risk around the country’s push to expand its manufacturing capabilities. Second, and related to the first point, income inequality in India is particularly stark. These two factors raise the risk of domestic instability. Third, climate change and more frequent bouts of extreme weather events have the potential to impact crop yields, which is a particularly material risk to inflation, as the food and beverages category makes up nearly 50% of India’s CPI basket. Finally, the reform agenda pushed through over the past decade has benefited from political stability, as Prime Minister Narendra Modi and his ruling Bharatiya Janata Party (BJP) have held onto power. With elections due in 2024, political risks appear elevated. Regardless of the result, we think the reforms of the past several years are here to stay. Although any change in leadership or parliamentary composition could slow progress, we doubt there would be an outright reversal of the reforms enacted to date.
The Near-Term Bear Case
The positivity surrounding India’s economy and equity markets is largely reflected in current valuations, which appear elevated. In addition, profitability remains challenged and recent outperformance has started to reverse. Looking through the current late-cycle economic environment, we see more attractively priced emerging markets (EM), where performance may benefit to a greater extent during an early cycle recovery. As such, we remain neutral on Indian equities over a three-year investment horizon.
Indian Equities Are Richly Priced. Indian equity valuations are elevated following their recent spate of outperformance. The market trades at 19.2x forward 12-month earnings compared to 15.7x and 11.6x for the developed and emerging benchmarks, respectively (Figure 2).
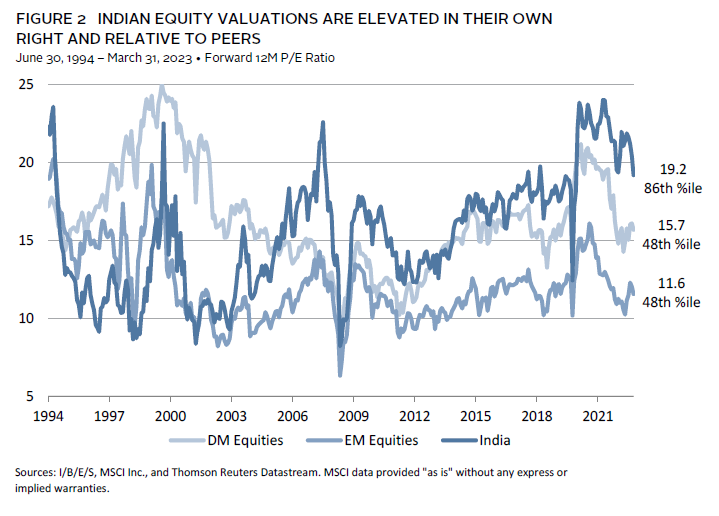
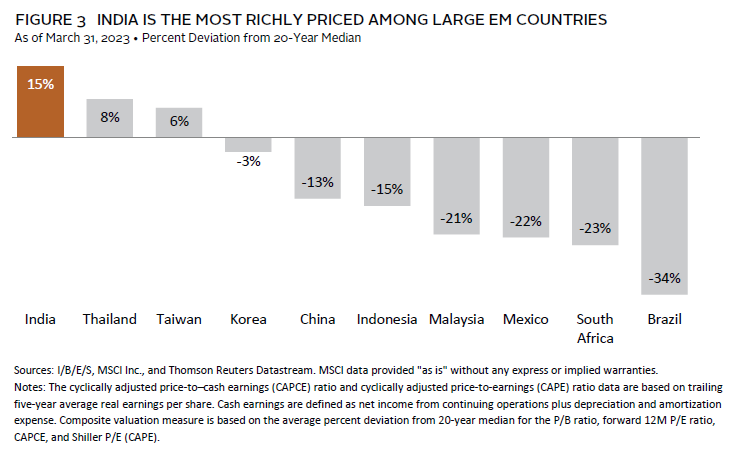
Although India typically trades at a premium to global stocks on this metric, the current relative valuation is well above median near the 90th percentile. Indian equities also trade at elevated levels across several other valuation metrics that we track, including the price-to-book ratio and normalized price-earnings multiples. Combined, India’s average valuation premium to the prior 20-year median across these metrics is 15% today, suggesting that Indian equity valuations are the most richly priced among major EM peers (Figure 3).
But are these valuations more reasonable when factoring in the market’s high growth expectations? To address this, we also track the price-earnings-to-growth ratio (PEG), 1 which gives an indication of the valuation per unit of expected growth. The current PEG ratio of 1.10 is only slightly elevated when compared to the median over the past ten years (1.02). But consider that today’s PEG ratio assumes real Indian earning per share (EPS) growth of roughly 13% annualized over the next five years, which appears lofty by historical standards. Since the mid-1990s, real EPS for Indian equities have expanded at a 3.8% clip per annum and the median real calendar year EPS growth over the past decade has been flat. Given that risks to forward earnings outlook appear skewed to the downside, we would caution against placing too much weight on the PEG ratio as a reliable indicator of lower valuations.
The Profitability Headwind. Corporate profitability in India remains challenged. India’s return-on-equity (ROE) has been on a downtrend since 2007, and at 14.2% today is roughly 10 percentage points (ppts) off peak levels from that time. The ROE for Indian equities has generally been higher than that of global peers, but is 2% below the global equity universe today. This has placed a stubborn drag on real EPS, which have yet to retake their peaks from 15 years ago, despite a growth-fueled expansion in sales (Figure 4).

There are several catalysts with the potential to drive profitability improvements. Authorities have cut corporate tax rates, which were previously among the highest in the region. The rate was lowered to an even greater extent for new manufacturing firms and those involved in electricity generation. India’s banks are in better health today and have the potential to boost the overall market, given their sizable index weight. Infrastructure investments, development of high-tech manufacturing, and ongoing structural reforms are an additional welcome sign, particularly in combination with India’s strong uptake of digitalization trends.
Momentum Is Turning. While India’s equity market performance has been exceptional in recent years, momentum has started to turn. Indian equities declined -8.0% in USD terms in 2022, outperforming broader developed markets (DM) and EM stocks by more than 10 ppts. India’s relative resilience last year built on a trend that developed in the COVID-19 era. Over the past three years through March 31, India returned 22.2% annualized in USD terms, compared to 16.4% for developed markets and 7.8% for emerging peers. Although weak EM performance over this period can be partly attributed to China’s 2.6% per annum decline, India still managed to outperform the MSCI EM ex China Index. However, recent performance has faltered, with shorter-term momentum relative to global stocks turning negative at the beginning of the year. Such turns in momentum have proven to be an unfruitful entry point for Indian equities in the past over tactical holding periods.
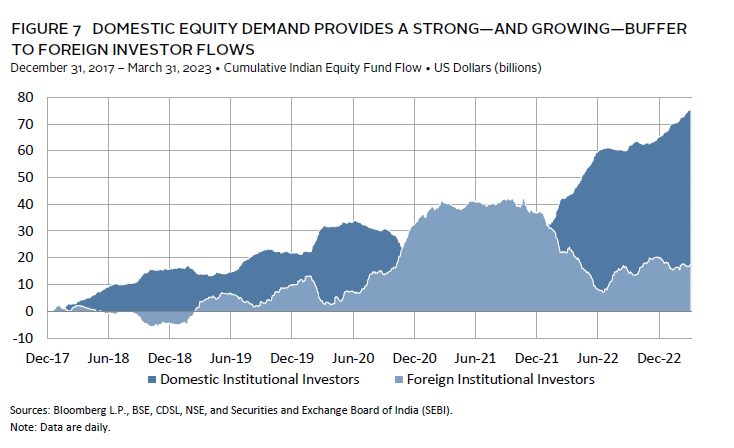
Addressing Adani. Adani Group developments have pressured Indian equities from two technical perspectives. First, the conglomerate accounted for more than 5% of MSCI India Index float-adjusted market capitalization at the end of last year. Second, the allegations of accounting fraud and stock price manipulation likely sapped foreign investor appetite over broader corporate governance concerns. However, these factors alone may not pose a meaningful drag on performance going forward. MSCI has announced plans to reduce the investable share count for several Adani-linked stocks this year, and foreign investors outflows have become neutralized by domestic inflows (Figure 7). In addition, active equity managers had largely avoided stocks tied to Adani, as the questionable business practices were widely understood. The primary concern going forward is how the government will respond to the allegations, which pose an important test of institutional credibility, given Adani’s seemingly close ties to Prime Minister Modi. As markets have shown, this question warrants a higher risk premium for Indian equities in the near term.
Limited Opportunity From China’s Reopening. India has arguably the least to gain among its Asian peers from China’s reopening. China accounts for less than 10% of India’s export demand, compared to nearly 30% for Taiwan and Korea. Measured in actual dollar values, Korea’s exports to China ($163 billion) were seven times greater than India’s ($23 billion). Valuations for these countries are less stretched, suggesting these markets have greater upside potential from China’s reopening. Finally, rebounding economic activity in China may end up boosting commodity prices—such as industrial metals and oil—which would further pressure India’s already record-wide current account deficit (Figure 5). This risk will become somewhat mitigated in the years ahead as India pushes to decarbonize its economy, but remains a material consideration in the near term.

The Near-Term Bull Case
India may prove to be more defensive than its EM peers in the current late-cycle environment of slowing global economic growth and tighter monetary policies from DM central banks.
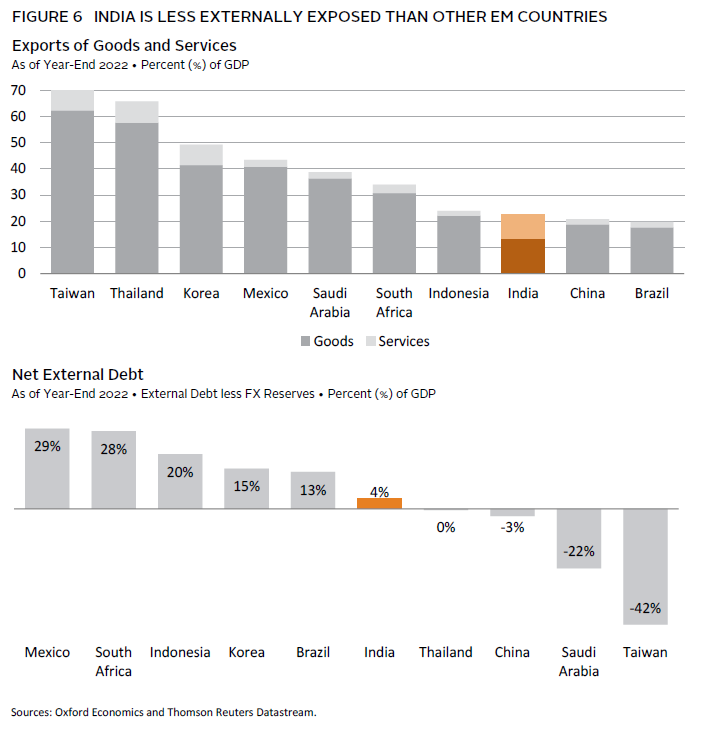
India is more domestically oriented relative to other EM peers. Goods exports as a percentage of GDP are the lowest among the major EM countries (Figure 6), while domestic consumption comprises a hefty 60% of GDP. The domestic impact is even more pronounced for the equity universe, as 70% of corporate sales are derived from within India. In addition, external debt today stands at just 19% of GDP and has fallen 4 ppts since its peak less than ten years ago. This compares to median external debt among the ten largest MSCI EM Index countries at 30% of GDP. And India’s relatively low external financing position is well-covered by its foreign exchange reserves. This structural setup makes India’s economy less exposed to slowing global economic growth and waning demand from external trading partners, reducing the risks from external shocks.
Indian equity markets enjoy strong—and growing—demand from domestic investors. Rising US interest rates and late-cycle economic environments are typically associated with capital flows out of EM. While India is not immune from this dynamic, domestic equity demand acts as an effective buffer when foreign investors head for the exits. In 2022, foreign institutional investors pulled more than $17 billion out of Indian equities, whereas net inflows from domestic sources reached more than $35 billion (Figure 7). The influence of domestic investors looks set to only increase from here. Pension schemes and provident funds are increasing their equity allocations, households are grossly underweight equities—parking only about 5% of their wealth in the stock market—while annual household savings have ballooned to roughly $700 billion. In addition, more Indian households are participating in Systematic Investment Plans, suggesting that retail investors will continue funneling savings into the stock market as income levels rise. Foreign direct investment and remittances from the Indian diaspora are another key source of capital flows, reaching $80 billion and $100 billion, respectively, in 2022.
Current inflation dynamics, particularly relative to some developed and emerging peers, are also supportive of the near-term outlook. The latest headline inflation reading of 5.7% year-over-year is in-line with the prior 30-year average and nearing the top end of the Reserve Bank of India’s (RBI) target range. In addition, the RBI repo rate (6.5%) has risen above the level of inflation, suggesting that the central bank is close to the end of its hiking cycle. A more momentous development is arguably that the inflation differential versus the United States has all but evaporated (Figure 8). In the past, this dynamic created a supportive environment for the rupee and limited the downside vis-à-vis the US dollar. Rupee depreciation is typically a material drag on equity performance for non-Indian investors but may become less of a headwind in the near term.

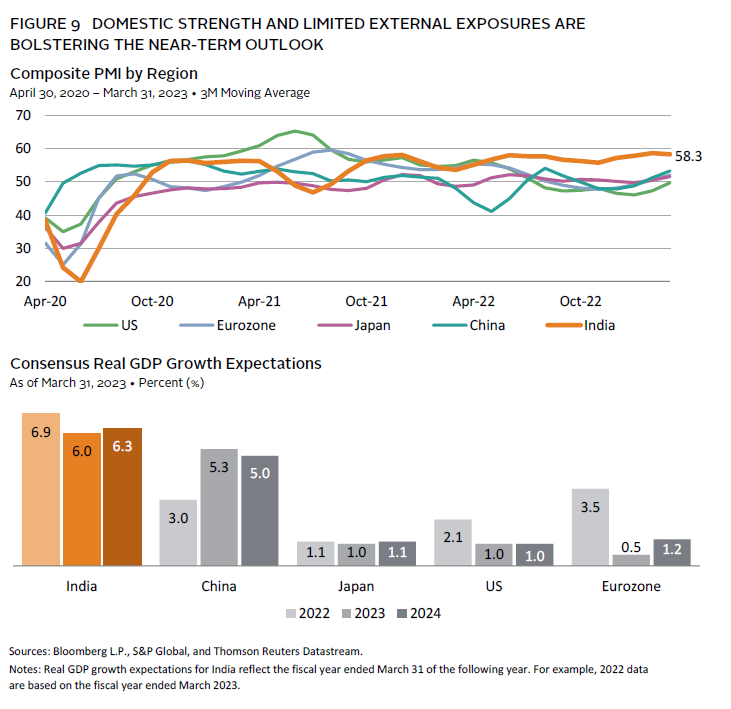
Shorter-term growth prospects are superior to global peers, owing in large part to domestic strength and limited external exposure (Figure 9). Looking ahead, analysts expect real GDP growth of 6.0% in the next fiscal year, which compares to expected calendar year 2023 growth of 4.1% and 0.8% for broader emerging and developed markets, respectively. This outlook is firmly supported by measures of business activity, such as purchasing manager indexes (PMI), which remain strongly expansionary for India. In contrast, PMIs across other major economies are near neutral levels, but were squarely in contractionary terrority earlier this year.
The strong economic outlook is also reflected in the earnings outlook, where growth is expected to exceed that of other regions and reach its highest clip in more than a decade (excluding the one-off COVID-19 rebound period in 2021) (Figure 10). As discussed above, although we see downside risks to the earnings outlook for India that may not support current valuations, the earnings picture for India is superior to other regions, which face similar risks to their forward earnings estimates.

Putting It Together
India has arguably the most compelling long-term growth opportunity in the global economy today. However, we don’t think Indian equities are an attractive overweight position on a tactical investment horizon. The long-term structural shifts in India’s economy will take years to play out, and the market appears fully priced for this reality with little margin of safety. While Indian equities certainly deserve a place in portfolios, we think allocations should be in-line with benchmark weightings. We would be more bullish on Indian equities over a tactical horizon if performance meaningfully corrects and valuations come down to more reasonable levels. Investors interested in India’s growth story from a strategic perspective should build allocations through high-quality public and private managers. On the public side, we favor and active approach over passive.
Index Disclosures
MSCI All Country World Index
The MSCI ACWI captures large- and mid-cap representation across 23 developed markets and 24 emerging markets countries. With 2,888 constituents, the index covers approximately 85% of the global investable equity opportunity set.
MSCI Emerging Markets Index
The MSCI Emerging Markets Index captures large- and mid-cap representation across 24 emerging markets countries. With 1,379 constituents, the index covers approximately 85% of the free float–adjusted market capitalization in each country.
MSCI Emerging Markets ex China Index
The MSCI Emerging Markets ex China Index captures large- and mid-cap representation across 23 of the 24 emerging markets countries excluding China. With 663 constituents, the index covers approximately 85% of the free float–adjusted market capitalization in each country.
MSCI India Index
The MSCI India Index is designed to measure the performance of the large- and mid-cap segments of the Indian market. With 114 constituents, the index covers approximately 85% of the Indian equity universe.
Footnotes
About Cambridge Associates
Cambridge Associates is a global investment firm with 50+ years of institutional investing experience. The firm aims to help pension plans, endowments & foundations, healthcare systems, and private clients achieve their investment goals and maximize their impact on the world. Cambridge Associates delivers a range of services, including outsourced CIO, non-discretionary portfolio management, staff extension and alternative asset class mandates. Contact us today.