Building Winning Portfolios Through Private Investments


Investors that have allocated to technology have seen their portfolios rewarded. Regardless of sector, nearly every business needs to become a tech company to succeed. Whether in digital transformation, data analytics, cybersecurity, or operational improvement, investments today will spur the economic growth of tomorrow. As families and family offices build portfolios, they should consider private equity (PE) and venture capital (VC) as leading ways to gain exposure to technological innovation. But, building a portfolio that incorporates both PE and VC investments is not straightforward. It requires skill and discipline. In this paper, we review recent private investment (PI) performance, discuss how these investments have benefited institutional portfolios, and provide some high-level tips on how to build winning portfolios.
2020: A Year to Remember
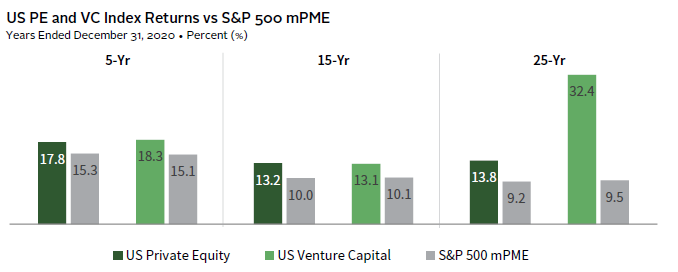
Private investments were among the top-returning asset classes in 2020. In fact, with last year’s performance, US PE and VC have outperformed US public equities over the last five-, 15-, and 25-year periods, using our modified Public Market Equivalent (mPME) methodology (Figure 1).
FIGURE 1 US PI OUTPERFORMED US PUBLIC EQUITIES IN 5-, 15-, and 25-YR PERIODS
Sources: Cambridge Associates LLC and Standard & Poor’s.
Notes: Private indexes are pooled horizon internal rate of return (IRR) calculations, net of fees, expenses, and carried interest. CA Modified Public Market Equivalent (mPME) replicated private investment performance under public market conditions. The public index’s shares are purchased and sold according to the private fund cash flow schedule, with distributions calculated in the same proportion as the private fund, and mPME NAV is a function of mPME cash flows and public index returns.
The greater PI return potential may be linked to a variety of factors including information advantages, general partner (GP)/limited partner (LP) alignment, or fund manager skill. Successful PE and VC managers may also be positioned to influence positive outcomes by serving as a guiding hand to early-stage VC-backed companies, as board members to later-stage companies, or as majority owners for buyout funds. Moreover, well-networked managers, whether emerging or established, may have a differentiated knowledge ecosystem that provides them insights into market trends and access to deal flow and entrepreneurial talent.
Institutions with Large PI Allocations Have Often Outperformed
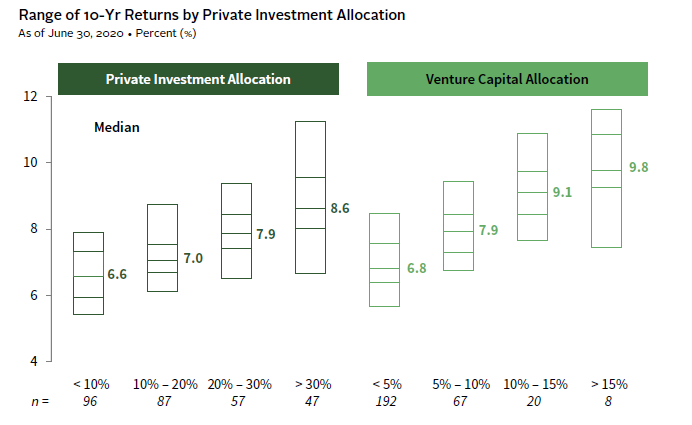
It is not surprising that some of the best-performing institutional portfolios maintain large PI allocations. For the ten years ended June 30, 2020, the median return for institutions with a PI allocation of 30% or more outperformed the median of those with an allocation of 10% or less by 200 basis points (bps). Further, the median return of the highest PI allocators was higher than the top return of those investors with PI allocations less than 10%. The differences are even more dramatic when looking at VC alone. The median return for those investors with a 15% or greater allocation to VC was 300 bps higher than the median return of those investors with VC allocations less than 5% (Figure 2).
To be sure, there is dispersion in total portfolio performance among both those investors with high PI allocations and those investors with low PI allocations. That dispersion is linked to different decisions, such as those related to PI strategy allocation, PI manager selection, and public asset allocation. While having a large PI allocation may not translate into outperformance, it has tended to be helpful historically.
FIGURE 2 INSTITUTIONS WITH PI ALLOCATIONS OF 30%+ HAD HIGHER MEDIAN RETURNS
Source: Endowment and foundation data as reported to Cambridge Associates LLC.
Note: Each institution’s private investment and venture capital allocation represents the mean for the 11 periods ended June 30 from 2010 to 2020.
What’s interesting is that the relationship between high PI allocations and high median returns has endured over the last decade (Figure 3). Early adopters of high PI allocations have been rewarded as this trend has persisted to date.
FIGURE 3 TOP ALLOCATORS TO PI ALSO HAD HIGHER MEDIAN RETURNS HISTORICALLY

Source: Endowment and foundation data as reported to Cambridge Associates LLC.
Notes: For the ten-year period ending 2020, each institution’s private investment and venture capital allocation represents an average across the 11 periods ended June 30 from 2010 to 2020. Data for historical periods are calculated according to the same method using the dates that pertain to each trailing ten-year period. The number of institutions varies across each of the ten-year periods. For the ten-year period ended June 30, 2020, there were 287 institutions included in the analysis.
Effective PI Programs
Building a robust PI program is challenging. Broadly speaking, investors have three main hurdles to overcome to help ensure success: forecasting and managing liquidity, committing to a target long-term allocation, and accessing potential top-performing managers. We expect that being thoughtful about each of these hurdles will likely lead to positive investment outcomes.
Forecasting and Managing Liquidity
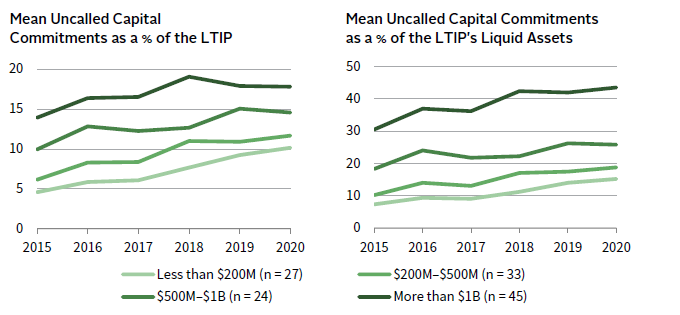
Endowments of all sizes have been increasing their commitments to private funds, weighing the trade-off of potential higher returns against liquidity requirements. Figure 4 shows the trend in uncalled commitments both as a percentage of total portfolio and a percentage of the liquid-only portion (long-only equity, fixed income, and cash). This chart suggests that most institutions have increased their commitments to private investments over the past five years at a pace that is greater than the growth rate of the total value of the portfolio.
FIGURE 4 UNCALLED CAPITAL COMMITMENTS TO PI FUNDS HAVE TRENDED UP
Source: Endowment data as reported to Cambridge Associates LLC.
Notes: Uncalled capital is the amount committed, but not yet paid in, to private investment funds. Liquid assets consist of all LTIP assets excluding hedge funds and private investments.
These institutions appear to have also become more comfortable increasing their percent of uncalled commitments relative to their liquid portfolios. The median growth rate in uncalled capital commitments was 82% over the last five years, while the median growth rate in the value of the total portfolio and the value of the liquid-only portion was 13% and 11%, respectively. Organizations with a historically higher allocation to private investments have understood that, over time, the PI program should become self-funding, whereby distributions more than offset the contributions required to meet commitments.
Maintaining appropriate liquidity is critical in any investment scenario; in times of crisis, market drawdowns on public securities can be substantial and correlations across investment strategies can converge. In this case, fixed income securities are often relied on as the primary source of liquidity. Comparing cash and fixed income relative to spending needs, including projected capital calls, can serve as a basic starting point in determining if there is adequate coverage to enable a greater allocation to illiquid investments. One key action we have recommended is for investors to sum up the portfolio assets that are liquid on a monthly or more-frequent basis. Then, they should stress-test that sum to determine the total value of these assets after market declines comparable to the global financial crisis. If that market-stressed value is less than three times the sum of annual required spending and capital calls, investors should consider taking immediate steps to boost their portfolio liquidity. Such analysis has the potential to enable private investors to pursue allocations to private investments more confidently.
Getting with the Program
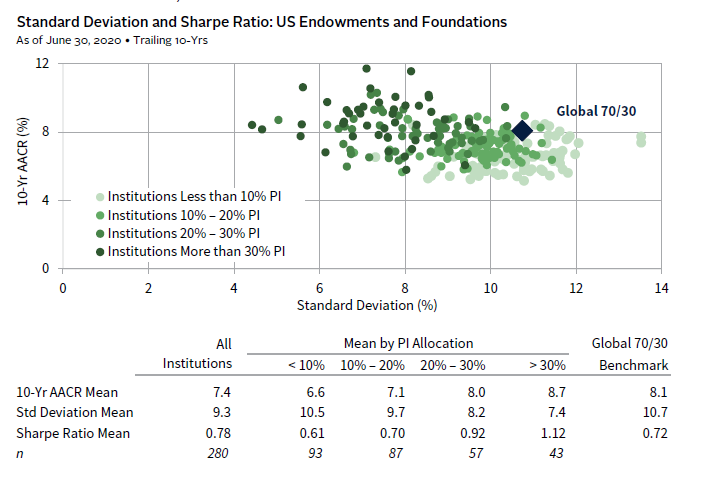
For many investors with long time horizons, a significant portion of the portfolio likely needs to be allocated to high-returning assets to generate returns consistent with objectives. Figure 5 may offer comfort for investors worried that the risk of a high PI allocation is too great for too little premium. Institutions with higher PI allocations experienced higher returns historically. And, those returns tended to be less volatile, which can be helpful for those investors that need added stability for spending purposes. It is important to note though, that the reduction in portfolio volatility is due to the infrequent pricing of private investments, not because the riskiness of the portfolio has necessarily fallen.
FIGURE 5 HISTORICALLY INSTITUTIONS WITH HIGHER PI ALLOCATIONS EXPERIENCED HIGHER, LESS VOLATILE RETURNS
Sources: Endowment and foundation data as reported to Cambridge Associates LLC. Index data are provided by Bloomberg Index Services Limited and MSCI Inc. MSCI data provided “as is” without any express or implied warranties.
Note: Each institution’s private investment allocation represents the mean for the 11 periods ended June 30 from 2010 to 2020.
When considering new growth opportunities in PE and VC, many private investors understandably prefer to first “dip their toe in the water” to get more comfortable with illiquidity risks and cash flow patterns. Rather than setting a net asset value (NAV) target as a percentage of the overall portfolio, investors often start with a small commitment pace. Yet, for two reasons, this approach has the potential to derail a program before it starts. First, when building a PI program, an investor experiences the “J-curve.” In other words, capital commitments are usually called over the first three to four years and returns are often negative in this period before any positive turn. A smaller initial commitment pace does not mitigate this J-curve effect. Second, the effort associated with building the program can consume the conversation in the face of the drag on returns, which can result in a “toe in the water” becoming a “toe drag” as the ability to get to a higher–allocation NAV target is jeopardized. Increasing the target at a future date almost inevitably extends the J-curve. Fully committing to a program from the outset can allow for an increased likelihood of success and requires an intentional long-term allocation target, a well-defined governance process, and a long-term horizon. Understanding and agreement by the investor’s investment committee (IC) that there will be no meaningful way to evaluate the performance of the total PI portfolio for several years is important. In fact, we found that funds typically take six to eight years to “settle” into their final quartile ranking and that the vast majority of funds have ranked in nearly all (or all!) quartiles at some point in their lives. Memorializing at the outset that there will likely be negative returns in the early years until the portfolio matures will serve as a lasting reminder to future decision makers of the program expectations.
Assembling the Right Line Up
The PI space has become increasingly competitive. While there was a dip in fundraising last year relative to 2019, which was linked to the pandemic, the amount of capital raised was still considerable. For instance, US PE managers raised more than $200 billion in 2020, which was the third highest annual amount. The large amounts of capital that have flowed into the PI space in recent years has been a factor in the rise of private company purchase price multiples, which are presently near record high levels. These realities make it essential that investors carefully assemble their PI manager line up.
For those investors that can dedicate material resources to vetting managers thoughtfully, rewards can be high (Figure 6). In fact, the dispersion of returns within major PI asset classes is often several times larger than comparable public asset classes. This is a key reason why investors with high private allocations tend to have higher returns than those investors with low allocations.
FIGURE 6 DISPERSION HAS TENDED TO BE HIGH AMONG PI MANAGERS
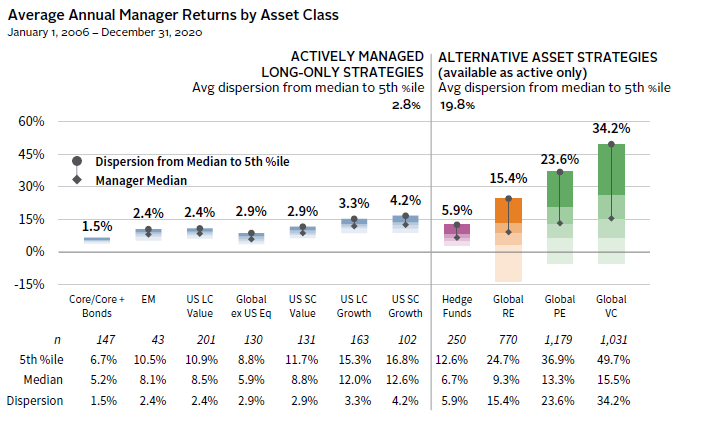
Source: Cambridge Associates LLC.
Notes: Returns for bond, equity, and hedge fund managers are average annual compound returns (AACRs) for the 15 years ended December 31, 2020, and only managers with performance available for the entire period are included. Returns for private investment managers are horizon internal rates of return (IRRs) calculated since inception to December 31, 2020. Time-weighted returns (AACRs) and money-weighted returns (IRRs) are not directly comparable. Cambridge Associates LLC’s (CA) bond, equity, and hedge fund manager universe statistics are derived from CA’s proprietary Investment Manager Database. Managers that do not report in US dollars, exclude cash reserves from reported total returns, or have less than $50 million in product assets are excluded. Performance of bond and public equity managers is generally reported gross of investment management fees. Hedge fund managers generally report performance net of investment management fees and performance fees. CA derives its private benchmarks from the financial information contained in its proprietary database of private investment funds. The pooled returns represent the net end-to-end rates of return calculated on the aggregate of all cash flows and market values as reported to Cambridge Associates by the funds’ general partners in their quarterly and annual audited financial reports. These returns are net of management fees, expenses, and performance fees that take the form of a carried interest. Vintage years include 2006–2017.
In previous research, we highlighted that value creation is not limited to a few well established, yet inaccessible, fund managers. New and developing funds are consistently in the top quartile, and, when identified early in their formation, can provide access for new investors. It is important to note that new and developing managers also comprise a high proportion of the lowest-quartile performers, making manager identification and selection a critical component of building the program.
Gaining Access, Venturing Forth
The VC space can deliver investors awareness of, and access to, cutting-edge technologies. All stages of venture—from seed capital and early-stage to late-stage—offer investors various entry points on the risk/reward spectrum. Additionally, VC offers exposure to innovative, impactful, and market-driven solutions to real world challenges, such as climate change, resource scarcity, and inequitable access to education, healthcare, and financial services. There is also a particularly robust opportunity in VC to back talented and diverse GPs who are, in turn, backing talented and diverse founders.
Having investment exposure to these emerging companies can provide insights into their impact on other asset classes and the dynamics of an evolving financial landscape. For example, hedge funds and public equity fund managers can offer so-called “hybrid funds,” which provide both public and private exposure. This can provide investors access to companies with high return potential and help them understand which existing companies stand to be significantly influenced by the emergence of new technologies.
The Decade Ahead
For investors that had a high allocation to private investments, 2020 was indeed a year to remember. Technology developments are likely to continue to transform the global economy. With billions of digitally connected devices, ever-increasing amounts of money spent on cloud computing and storage, and a large pool of experienced entrepreneurial talent—with plenty of capital—the next decade may offer promising innovations. Investors properly positioned in private investments may have many more years to remember ahead.
Index Disclosures
Bloomberg Barclays Aggregate Bond Index
The Bloomberg Barclays Aggregate Bond Index is market capitalization–weighted and includes Treasury securities, government agency bonds, mortgage-backed bonds, and corporate bonds. It excludes municipal bonds and Treasury inflation-protected securities because of tax treatment.
MSCI ACWI
The MSCI ACWI is a free float–adjusted, market capitalization–weighted index designed to measure the equity market performance of the full opportunity set of large- and mid-cap stocks across 23 developed and 27 emerging markets. It covers more than 2,900 constituents across 11 sectors and approximately 85% of the free float–adjusted market capitalization in each market. The developed markets country indexes included are: Australia, Austria, Belgium, Canada, Denmark, Finland, France, Germany, Hong Kong, Ireland, Israel, Italy, Japan, the Netherlands, New Zealand, Norway, Portugal, Singapore, Spain, Sweden, Switzerland, the United Kingdom, and the United States. The emerging markets country indexes included are: Argentina, Brazil, Chile, China, Colombia, Czech Republic, Egypt, Greece, Hungary, India, Indonesia, Korea, Malaysia, Mexico, Pakistan, Peru, the Philippines, Poland, Qatar, Russia, Saudi Arabia, South Africa, Taiwan, Thailand, Turkey, and the United Arab Emirates.
David Thurston - David Thurston is a Managing Director at Cambridge Associates.
About Cambridge Associates
Cambridge Associates is a global investment firm with 50+ years of institutional investing experience. The firm aims to help pension plans, endowments & foundations, healthcare systems, and private clients achieve their investment goals and maximize their impact on the world. Cambridge Associates delivers a range of services, including outsourced CIO, non-discretionary portfolio management, staff extension and alternative asset class mandates. Contact us today.