Benefits of Global Diversification


Investors are now grappling with the impact of the COVID-19 pandemic, which has sent global equities into bear market territory as the threat of a severe recession weighs on the global economy. These are challenging, uncertain times for equity markets; the full extent and severity of the crisis will not be known for some time. In such an environment, it can be tempting to pick winning countries (whether from the perspective of macroeconomics, corporate earnings strength, or even resilience to COVID-19), but this is a dangerous approach. We recommend investors reacquaint themselves with our process for weathering this uncertainty, discussed in VantagePoint: The Bear Awakens. As investors work to ensure their portfolios will be robust through this downturn and are positioned for the eventual rebound, we offer a review of the critical benefits of global equity diversification and examine considerations related to home bias, rebalancing strategies, and currency impacts.
Consider the following scenario: A thriving economy reaches the end of a decade of equity market dominance, supported by numerous key factors. Strong consumer spending and promising technological developments help support robust earnings growth at the nation’s innovative companies. Even with the tight labor market, inflation remains dormant. Consumer sentiment thrives, and equities reach all-time high levels. What this describes is the Japanese economy as it reached its apogee in the late 1980s, just before it took a nosedive and experienced a decade of equity market misery.
Japan’s experience is one specific example of a situation where a dominant equity market can sharply reverse course, highlighting the perils of complacency with equity allocations, to intentionally focusing on today’s strongest markets, or to letting winners ride without rebalancing. Such behavioral risks can be mitigated through global diversification, which helps ensure that investors have at least some exposure to the next winner when leadership changes. Investors can’t reliably predict which country will post the highest returns in the future (even if they knew in advance which country would have the strongest economic growth!), so building a global diversified portfolio is a logical, prudent strategy for those who wish to minimize downside risk and preserve wealth over the long term.
Global Equity Rotation
For decades, investors drank the equity-diversification Kool-Aid, minimizing home bias within their equity portfolios. But after the magnificent performance of the past decade, the United States has dominated all major equity markets, and some investors have again questioned the benefits of geographic diversification. Why should US-based investors bother diversifying into international equities when the S&P 500 Index trounced the returns of other global equity markets in the last decade (and given that equity strength combined with the greenback’s strength, the temptation to concentrate in the United States is not limited to US investors)? Indeed, US equities advanced more than 250% 1 from 2010 to 2019 in USD terms, with no other major developed or emerging equity market coming close. Some of this effect has come from a growing valuation gap that could collapse in coming years, but some has resulted from much better fundamentals in the United States than in many European and Asian markets. In hindsight, investors employing equity diversification would have been better served by concentrating on US markets.
But hindsight doesn’t predict future winners. Equity market leadership has shifted in every decade dating back to 1950. Figure 1 demonstrates the rotation of equity performance across ten different countries on a decade-by-decade basis, dating back to 1950. An equal-weighted portfolio across these ten regions with annual rebalancing would have outperformed the United States in five of the past seven decades. Due to the rotation in leaders and laggards, having exposures across all countries in one basket helps shield portfolios from the concentrated losses that individual markets can suffer in market downturns. For example, US-based investors feeling confident in the US equity market after its dominance in the 1990s would have been demoralized by performance in the 2000s. Australia and Canada posted excess returns of 37% and 27% for the decade, respectively, while the United States lagged significantly, losing 31%. An equal-weighted portfolio, on an excess return basis, would have lost only 15%, buoyed by the strong returns from Australia and Canada. In theory, the equal-weighted portfolio reduced volatility, but in practice, US-based institutional investors are not equally weighting ten different countries. A more common split, such as 50% US and 50% non-US, might be more applicable. Using these weights, the same result holds—this portfolio would have outperformed the US portfolio in five of seven decades.
FIGURE 1 RANKINGS OF EQUITY EXCESS RETURNS BY DECADE
1950–2019 • US Dollar
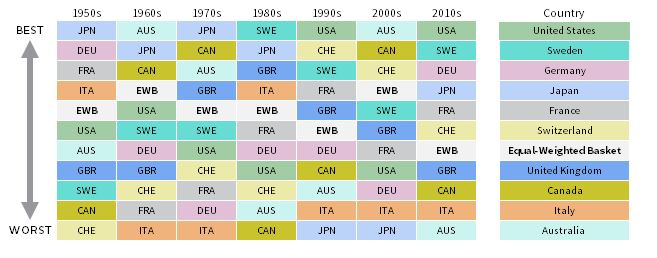
Source: Global Financial Data, Inc.
Notes: Countries are represented by the following indexes: Australia ASX Accumulation Index – All Ordinaries (Australia), Canada S&P/TSX-300 Index (Canada), France CAC All-Tradable Total Return Index (France), Germany CDAX Total Return Index (Germany), Italy BCI Global Return Index (Italy), Japan Topix Total Return (Japan), OMX Stockholm Benchmark Gross Index (Sweden), S&P 500 Total Return Index (United States), Swiss Performance Index (Switzerland), UK FTSE All-Share Return Index (United Kingdom). Total returns are calculated in excess of each government’s treasury bills. The equal-weighted basket assumes annual rebalancing.
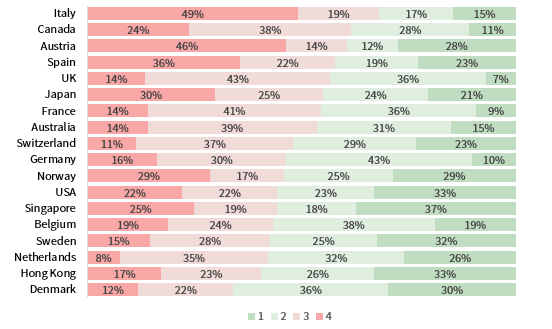
Perhaps more striking is just how much parity major equity regions have seen over the past 50 years. A basic analysis of 18 countries included in the MSCI World Index shows further evidence of the rotation effect (Figure 2). While this analysis does not account for the level of performance dispersion among countries, it indicates that five different countries spent more time in the top two quartiles than the United States. Over rolling three-year periods, US equities reached the top two quartiles among the 18 countries 56% of the time. This number is somewhat surprising; US equities had just slightly better than a 50/50 chance of finishing in the top half among major markets in any given three-year period. On the flip side, the three-year US equity returns fell into the bottom quartile 22% of the time among regions.
FIGURE 2 PERCENTAGE OF TIME SPENT IN RETURN QUARTILES
December 31, 1969 – December 31, 2019 • Rolling 3-Yr Total Returns • US Dollar
Sources: MSCI Inc. and Thomson Reuters Datastream. MSCI data provided “as is” without any express or implied warranties.
Notes: Data are sorted ascending by combined percentage of time spent in top two quartiles. For example, Denmark spent 66% of rolling three-year periods in the top two quartiles among countries. Totals may not sum to 100% due to rounding. Total return data for all MSCI indexes are net of dividend taxes.
History tells us that US equities have typically held up better than global equities during bear market periods, as stated in our fourth quarter 2018 edition of VantagePoint. Investors that don’t rebalance after such a run of outperformance could see even larger allocations to US equities by the end of the drawdown, particularly with manager structures employing regional or single-country strategies. Or investors might be tempted to concentrate on the markets where economies and/or earnings have held up best. Thus, the equity portfolio then essentially becomes a momentum strategy by chasing the recent winner. But this could be problematic for investors that don’t consider valuations. Starting valuations can be a useful guide in recovery phases after bear market drawdowns. For example, both US and developed ex US equities lost more than 50% peak-to-trough in the 2000–03 bear market period, but developed ex US equities bested US equities by a differential of about 60 percentage points in the subsequent three-year period. Developed ex US equities were trading at steep valuation discounts at the beginning of the period—near the bottom quartile of the relative valuation history. On the other hand, developed ex US equities lagged US equities in the aftermath of the global financial crisis (GFC), but there was no valuation discount at the beginning of that period. In fact, developed ex US equities were still slightly expensive relative to US equities in early 2009. After the market volatility in early 2020, the relative valuation (based on our cyclically adjusted price-to–cash earnings ratio) between developed ex US equities and US equities had moved to just the second percentile versus its history since 1979. This suggests that relatively cheap developed ex US equities could bounce back more sharply in a recovery. Still, valuations are not as explanatory for shorter-term outcomes, and have a stronger relationship with longer (seven- to ten-year) subsequent returns.
Japan and the Risks of Backing the Wrong Equity Horse
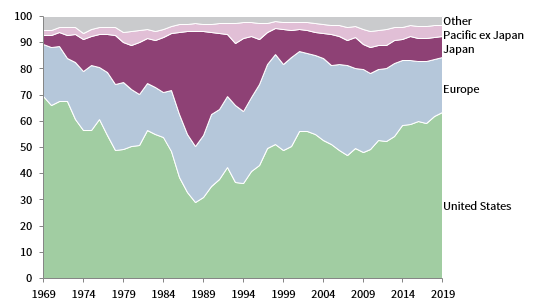
The Japanese equity market boom in the 1980s is now considered one of the greatest asset price bubbles of all time. Indeed, Japan held the largest weight in the MSCI World Index for several years in the late 1980s, at one point comprising 44% of the developed stock market. Two noteworthy factors could have contributed to this outsized position: MSCI’s weighting methodology was based on full float market capitalization—rather than free-float—at the time, and Japanese companies had a preponderance of cross-shareholdings, which may have artificially boosted market capitalizations. Still, on December 31, 1989, the four largest 2 companies in the world were Japanese banks, and Tokyo Electric Power and Toyota Motor Corporation also ranked among the top ten largest. The Industrial Bank of Japan was nearly twice the size of General Electric.
Japanese investors that chased their home market’s exuberance and piled hefty exposures into the Nikkei Index soon learned a hard lesson about the dangers of home bias. As the exuberance unfolded, the Japanese equity market reached its peak in 1989, both in local currency and USD terms. From late 1981 through early 1989, the domestic equity market surged by roughly 400% (800% in USD terms). Japan’s dominant run was followed by one of the worst decades on record across major regions. The MSCI Japan Index has still not recovered its 1989 peaks in local currency terms, as shown in Figure 3. Even from a USD-based investor standpoint, the Japanese equity market did not recover its 1989 peaks in USD terms until 2017—nearly 30 years.
FIGURE 3 MSCI WORLD INDEX COUNTRY BREAKDOWN
1969–2019 • Percent (%)
Sources: FactSet Research Systems, MSCI Inc., and Thomson Reuters Datastream. MSCI data provided “as is” without any express or implied warranties.
Notes: “Other” category includes Canada, Israel, Mexico, and South African Gold Mines. Malaysia is included in Pacific ex Japan from 1993 to 1997. Data are annual and as of calendar year-end.
Now, the global equity landscape looks much different. Of the top 20 companies by market cap, 18 are now US-listed, with the two exceptions being Swiss-based global companies. Does this imply that the US market will go the way of Japan? Not necessarily. 3 But this serves as a reminder that equity market dominance can shift, and investors should be prepared for that eventuality.
The Currency Factor
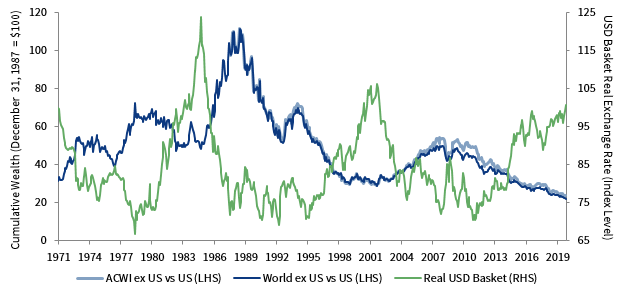
Dollar weakness tends to be associated with US equity underperformance and vice versa. Exposure to equities outside of the investor’s home country creates foreign currency risk, and for USD-based investors, that is true even when foreign currencies are pegged to the dollar. Investors must consider the outlook for the US dollar and, as part of this consideration, be mindful of the unprecedented fiscal stimulus taking shape in the United States right now. Even prior to the COVID-19 crisis, the US deficit had reached nearly $1 trillion in fiscal 2019 (running at 4.6% of GDP) due to tax cuts and a ramp up in government spending, coupled with a current account deficit that has been running between 2% and 3% for several years. Some projections indicate the fiscal deficit could reach nearly $4 trillion in 2020, making it the largest deficit in history, implying almost 20% of GDP. Such policies are likely to weigh on the dollar over the long term. The US dollar has enjoyed a prolonged period of strength and appears richly valued after enjoying a rally of more than 43% versus a fixed-weight basket of developed markets currencies since 2011 (Figure 4). The US dollar has typically rallied in periods of market stress and has been in high demand during the COVID-19 sell-off, but any signs of a reversal in dollar strength could be supportive factors for the non-US equity allocations of USD-based investors going forward. Unhedged non-USD–based investors must be cognizant of the key drivers that could have an impact on their domestic currencies, for example: risk of potential breakup in the Eurozone or UK sterling vulnerabilities related to twin deficits and Brexit.
FIGURE 4 GLOBAL EX US VS US EQUITIES RELATIVE CUMULATIVE WEALTH AND USD BASKET
REAL EXCHANGE RATE
June 30, 1971 – March 31, 2020 • US Dollar
Sources: Eurostat, MSCI Inc., OECD, and Thomson Reuters Datastream. MSCI data provided “as is” without any express or implied warranties.
Notes: The USD Basket is a weighted average of six currencies: the Australian dollar (10%), British pound (20%), Canadian dollar (10%), euro (30%), Japanese yen (20%), and Swiss franc (10%). Relative equity cumulative wealth series are rebased to December 31, 1987, the inception date of the MSCI ACWI Index. Total returns are gross of dividend taxes.
Whither Globalization?
Correlations have been secularly shifting upwards over the past five decades, and arguably the benefits of global equity diversification have fallen, particularly during drawdown periods. Indeed, the emergence of multinational corporations in various markets means that in recent decades, supply chains became more interconnected than ever, with companies increasingly reliant on foreign markets. However, this relationship could be changing. Even before the challenges stemming from the coronavirus outbreak, rising trade barriers between major trading partners began stifling longstanding trade relationships. The US-China trade conflict and the rise of nationalism had already threatened to undermine these growing relationships. The potential disruption between the United Kingdom and the EU also has the potential to reverse a longstanding trade partnership. Further disruption in the global supply chain stemming from the coronavirus spread could continue to lessen the increasing co-movements that these regions have seen in the past decade. In fact, rolling ten-year correlations have ticked lower since peaking during the GFC. Even if the overarching trend of globalization resumes in the future, investors should not assume that exposure to domestic companies with global operations equates to equity diversification. Indeed, it is important for domestic companies to have diversified sources of revenue, but the political, economic, regulatory, and currency risks of the home country cannot be entirely diversified away. Moreover, investors relying solely on a domestic portfolio risk becoming too concentrated in certain sectors while also forgoing opportunities to invest in leading companies domiciled in foreign markets.
Conclusion
As investors evaluate next steps in dealing with the unfolding effects of the COVID-19 crisis, it is time to review the benefits of global diversification. Regional leadership changes over time, as evidenced by 70 years of returns. The run up in US equities over the decade from 2010 to 2019 has quickly shifted the mentality of investors that have a short memory—specifically those that saw the benefit of diversification from 2000 to 2009, during which time global ex US equities led. The impressive performance of US equities is not unlike the exuberance experienced in Japan in the 1980s. Investors should avoid hefty country bets (whether intentional or due to complacency in rebalancing).
Many successful investors today benchmark their country and regional exposures to a global cap-weighted benchmark like MSCI All-Country World Index, rather than static weights, tactically deviating from benchmark allocations only when major valuation dislocations or other anomalies appear. Globalization could ebb in the future, setting the stage for global equity rotations. With these factors in mind, we believe that investors must ensure adequate diversification across equity regions, to ensure portfolios are robust in equity market crashes and in the ensuing recoveries and to lessen the risk of dramatically underperforming global benchmarks.
Index Disclosures
BCI Global Return Index
The BCI Global Return Index is calculated using the Bank of Italy Discount Rate for Italy 3-month Treasury Bill Yield, from January 1940.
CAC All-Tradable Total Return Index
The CAC All-Tradable index consists of all companies included in the Euronext Index Universe that fulfil a Minimum Trading Velocity requirement based on a combination of two rankings: (a) The value of Regulated Turnover observed over a 12-month period; and (b) The free float–adjusted market capitalisation on the Review Cut-Off Date.
CDAX Total Return Index
The CDAX is a German stock market index calculated by Deutsche Börse. It is a composite index of all stocks traded on the Frankfurt Stock Exchange that are listed in the General Standard or Prime Standard market segments.
FTSE All World Index
The FTSE All World Index is a market capitalization–weighted index representing the performance of the large and mid-cap stocks from the FTSE Global Equity Index Series and covers 90%–95% of the investable market capitalization. The index covers Developed and Emerging markets and is suitable as the basis for investment products, such as funds, derivatives, and exchange-traded funds.
MSCI All Country World Index
The MSCI ACWI Index is a free float–adjusted market capitalization–weighted index designed to measure the equity market performance of developed and emerging markets. The MSCI ACWI consists of 49 country indexes comprising 23 developed and 26 emerging market country indexes.
MSCI Japan Index
The MSCI Japan Index is a free float–adjusted, market capitalization–weighted index that is designed to measure the equity market performance of Japan.
MSCI World Index
The MSCI World Index represents a free float–adjusted, market capitalization–weighted index that is designed to measure the equity market performance of developed markets. It includes 23 developed market country indexes.
JPX-Nikkei 400 Index
The JPX-Nikkei Index 400 is composed of companies that meet global investment standards on criteria including efficient use of capital and investor-focused management perspectives. The index was jointly developed by Nikkei, the Japan Exchange Group, and the Tokyo Stock Exchange.
OMX Stockholm Benchmark Gross Index
The OMX Stockholm Benchmark Index (OMXSB) consists of a selection of the largest and most traded stocks, with representation from a majority of the supersectors. The weight of each constituent is based on a free float–adjusted market capitalization, which means that only the part of the share capital that is considered to be available for trading is included in the index.
Standard & Poor’s (S&P) 500 Index
The S&P 500 gauges large-cap US equities. The index includes 500 leading companies and captures approximately 80% coverage of available market capitalization.
S&P/ASX Accumulation Index – All Ordinaries
The S&P/ASX 200 is recognized as the institutional investable benchmark in Australia. Index constituents are drawn from eligible companies listed on the Australian Securities Exchange. The S&P/ASX 200 is designed to measure the performance of the 200 largest index-eligible stocks listed on the ASX by float-adjusted market capitalization.
S&P/Toronto Stock Exchange (TSX)
The S&P/TSX Composite is the headline index for the Canadian equity market. It is the broadest in the S&P/TSX family and is the basis for multiple sub-indexes but not limited to equity indexes, income trust indexes, capped indexes, GICS indexes and market cap–based indexes. The Toronto Stock Exchange (TSX) serves as the distributor of both real-time and historical data for this index.
Swiss Performance Index
The Swiss Performance Index (SPI) is a wide total-return index that tracks equity primarily listed on SIX Swiss Exchange with a free-float of at least 20%, and excluding investment companies. The index covers large, mid and small caps and is weighted by market capitalization.
Tokyo Stock Price Index (TOPIX)
The Tokyo Stock Price Index (TOPIX) is a free float–adjusted, market capitalizationweighted index that is calculated based on all the domestic common stocks listed on the Tokyo Stock Exchange First Section. TOPIX measures currentmarket capitalization assuming that market capitalization as of the base date (4 January 1968) is 100 points.
Footnotes
- S&P 500 total returns in US$ terms. This report is written from the perspective of US$-based investors.
- Based on float-adjusted market capitalization.
- Overvaluation in Japan during the 1980s was of a much greater magnitude on a P/E ratio basis than the United States today, even before the recent market sell-off. However, a significant portion of this differential was likely due to differences in accounting practices (Kenneth French et al., “Are Japanese Stock Prices Too High,” National Bureau of Economic Research, 1990).
Sean Duffin - Sean Duffin is a Senior Investment Director for the Capital Markets Research Team at Cambridge Associates.
About Cambridge Associates
Cambridge Associates is a global investment firm with 50+ years of institutional investing experience. The firm aims to help pension plans, endowments & foundations, healthcare systems, and private clients achieve their investment goals and maximize their impact on the world. Cambridge Associates delivers a range of services, including outsourced CIO, non-discretionary portfolio management, staff extension and alternative asset class mandates. Contact us today.