Retail is changing and some companies face challenges, but this theme has probably been overhyped, and implications for investors are limited.
- The retailing industry is experiencing significant change and traditional business models have been disrupted. The growth of e-commerce has dovetailed with ongoing store closures by some high profile retailers, leading to press reports about an ongoing “retail apocalypse.”
- We think implications for investors of these trends are limited, as the retail sector has a low weight in many indexes, pricing for many of the most troubled assets at least somewhat reflects these headwinds, and fundamentals (and thus share prices) for many large retailers have held up surprisingly well.
- One exception may be diverging trends in fundamentals for high and lower quality mall operators; skilled REIT managers may find opportunities during “baby thrown out with the bathwater” situations where pricing for shares of high quality assets diverge from underlying fundamentals.
A number of high-profile retailers shuttered their stores in 2017, prompting a flurry of articles about a looming “retail apocalypse.” The growth of e-commerce is often cited as the culprit, as are statistics about the “over-malling of America” and changing consumer tastes. Retail is changing and some companies face challenges, but this theme has probably been overhyped and implications for investors are limited. The retail sector has a low weight in many indexes, debt and equity trading levels for many of the most challenged companies reflect these threats, and investor exposure (based on market capitalization) to perceived “winners” from the online shift is likely much larger than to assumed “losers.” Given that fundamentals have not deteriorated as fast as pricing for asset classes, our contrarian take is that misplaced concerns about the retail sector may be creating (a few) opportunities for investors. One sector of particular interest is commercial real estate, as markets seem to have assumed the worst about some landlords without allowing for potential upside scenarios.
E-commerce Is Growing, But There Are Limitations
Total retail sales in the United States ended 2017 on a high note, rising 5.7% in the fourth quarter (year-over-year) to $1.3 trillion. Growth in e-commerce sales was particularly strong, rising 17% to $119 billion. For the full year, online sales reached $452 billion, around 9% of total retail sales and double the absolute level from just six years ago (Figure 1).
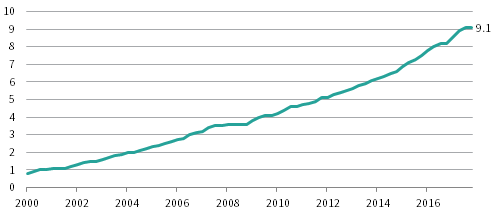
2000–17 • Percent (%)
Source: US Federal Reserve.
Note: E-commerce sales as a percent of total US retail sales are seasonally adjusted.
There are many factors behind the growth of e-commerce, including the convenience, choice, and pricing of online shopping. Amazon has been the undisputed winner in this shift, accounting for almost 44% of e-commerce sales (Figure 2), but brick-and-mortar retailers are competing in the online space by offering enhanced options such as same-day store pickup.
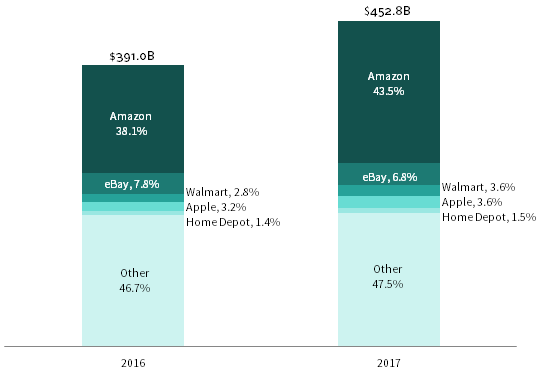
Source: eMarketer.
The growth in e-commerce has been impressive, but somewhat lost in the hyperbole is its scale relative to other categories, as well shifts that have already taken place. Americans spend a similar amount at gas stations ($457 billion) as they do online, and despite companies like Tesla popping up at some malls, the $1.2 trillion spent on cars and auto parts seems unlikely to rapidly move to the internet. From a different angle, annual spending at department stores ($152 billion in 2017) has already suffered a precipitous decline (down 25% over the past decade), arguably limiting how much further it has to fall. These statistics suggest why categories like grocery are becoming emerging battlegrounds for the struggle between e-commerce and brick-and-mortar, given the potential stakes (more than $640 billion in sales last year). E-commerce currently accounts for less than 5% of the overall grocery market, though undoubtedly this share will rapidly rise given recent trends, particularly with Amazon’s acquisition of Whole Foods.
Store Closing Figures are Not What They Seem
The growth of e-commerce has dovetailed with (and thus been linked to) a growing number of store closings in the United States. According to some reports more than 10,000 stores were shuttered last year, contributing to headlines about the retail apocalypse. Less discussed are the larger number of store openings: on a net basis around 4,100 stores were actually opened in 2017. Mass merchandisers (e.g., Dollar General, Dollar Tree), convenience stores, and supermarkets all opened a significant number of stores, counterbalancing large and highly publicized closures in categories like soft goods (apparel) and department stores. Payless, Rue 21, and Gymboree were notable contributors as over 3,000 soft goods stores were closed in 2017, while together Sears/Kmart and JCPenney closed nearly 500 department stores.
Official government statistics on retail stores also include restaurants and bars, leading some analysts to suggest that the openings data overstates the health of landlords that control assets like malls, community shopping centers, and strip malls. This argument has merit, but counterarguments can be offered. Even excluding the roughly 2,800 fast food and more formal restaurants that were opened last year, the net number of retail openings was positive. Secondly, the media focus on the shrinkage of department stores and apparel chains, but seldom mention the growth of other categories. Mobile phone carrier T-Mobile alone may open over 1,000 stores next year, and Apple is an increasingly important tenant in many high-quality shopping centers. Finally, and as discussed in more detail below, store closures are not necessarily a bad thing, as pruning weaker stores often leaves properties healthier and landlords with a better tenant mix.
E-commerce Is Not the Only Culprit
E-commerce certainly contributed to the decision of many management teams to close stores, but was far from the only headwind. Elevated debt burdens reduced the ability of some to adapt to changing customer tastes and tipped others into bankruptcy. Apparel companies have been hurt by the ability of “fast fashion” firms to quickly bring new items to market at lower prices, while department stores have been impacted by new specialized competitors in categories like cosmetics. Overall, traditional supermarkets and department stores also face new competition from discounters across categories, which appeal to price-sensitive shoppers that face rising prices in other categories like housing and health care.
From a real estate perspective, many retailers have been left poorly positioned for the growth of e-commerce, given an excess amount of store space in the United States. The United States currently has around 23.5 square feet of retail space per capita, while Canada and the United Kingdom have 16.4 and 4.6 square feet, respectively. Some bearish forecasters think this “over-malling” of America could lead to accelerated store and even mall closures; Credit Suisse has projected that as many as a quarter of the country’s roughly 1,200 malls could close over the next five years, with the brunt of the impact felt by Class B and Class C operators.
Many Investors Have Limited Direct Exposure to the Retail Sector
Whatever the ultimate result of recent trends in retail and their implications across asset classes, most investors have fairly limited exposure to the retail sector (Figure 3). The large-cap Russell 1000® equity index has a 7% weight for retail stocks in both the consumer discretionary and consumer staples sectors. Within discretionary, the sector can be further classified along subsectors like internet retailers, multi-line retailers (e.g., department stores), and specialty retailers (e.g., home improvement or auto stores), while consumer staples includes subsectors like food and drug stores. Exposure to the retail sector overall is even smaller in most credit indexes, but is slightly higher in loans and high-yield bonds than in investment grade. The sector weight in most real estate indexes is much higher, and would grow further if warehouses (part of the industrial subsector) used to facilitate e-commerce were included.
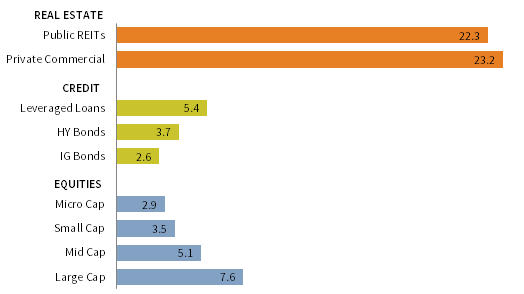
As of February 28, 2018 • Percent (%)
Sources: Barclays, Bloomberg L.P., BofA Merrill Lynch, FactSet Research Systems, Frank Russell Company, FTSE International Inc., ICE Data Indices LLC, J.P. Morgan Securities, Inc., and National Council of Real Estate Investment Fiduciaries.
Notes: Asset classes are represented by the following: FTSE EPRA/NAREIT US REITs Index for Public REITs, NCREIF Property Index for Private Commercial, J.P. Morgan Leveraged Loan Index for Leveraged Loans, BofA Merrill Lynch US High Yield Bond Index for HY Bonds, Bloomberg Barclays US Corporate Bond Index for IG Bonds, Russell Micro Cap® Index for Micro Cap, Russell 2000® Index for Small Cap, Russell Mid Cap® Index for Mid Cap, and Russell 1000® Index for Large Cap. Data for HY Bonds and Private Commercial Real Estate are as of December 31, 2017.
Equity Markets Have Taken the “Apocalypse” in Stride
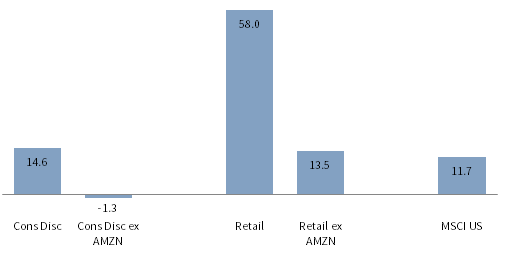
Retailers as a group have actually outperformed broad equity indexes in recent years (Figure 4), helped by rising profit margins across most sectors. Performance has been driven by the success of internet retailers (e.g., Amazon 1 ) but also by specialty retailing, where stores like Home Depot and Lowe’s are benefiting from rising consumer spending on categories like home improvement and furniture. Conversely, same-store sales have softened and margins have deteriorated for traditional department stores, but their limited market cap has muted the impact on overall index returns. Sears and JCPenney together have a combined market capitalization less than $1.5 billion, and Macy’s is barely more than 1% the size of Amazon. 2 Further limiting the impact on equity indexes is that many struggling apparel and specialty retailers (e.g., PetSmart and J. Crew) are owned by private equity firms, as is high-end retailer Neiman Marcus.
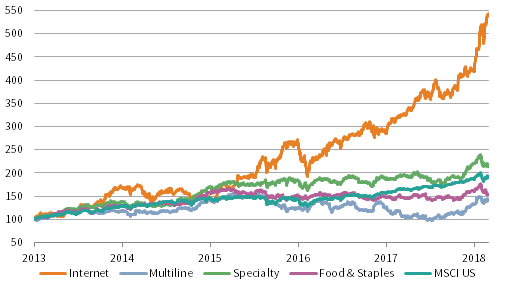
January 1, 2013 – February 28, 2018 • January 1, 2013 = 100
Sources: MSCI Inc. and Thomson Reuters Datastream. MSCI data provided “as is” without any express or implied warranties.
Note: Cumulative wealth is based on daily price level data.
Sector concentration must be considered when discussing valuations and performance. Amazon’s roughly $700 billion market cap accounts for more than 70% of the internet & direct marketing retail category (Figure 5), and Home Depot and Lowe’s together contribute nearly 60% of the specialty retail market $500 billion market cap (as of year end 2017).
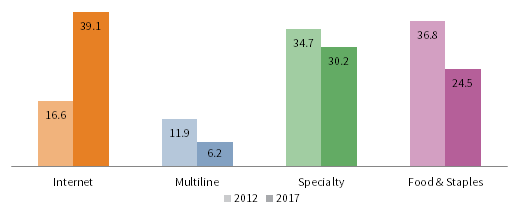
Percent (%)
Sources: FactSet Research Systems and MSCI Inc. MSCI data provided “as is” without any express or implied warranties.
Notes: Data are as of year end for 2012 and 2017. Percentages may not total to 100 due to rounding.
Consumer discretionary stocks currently look reasonably valued relative to the overall MSCI US Equity Index, and even more so if Amazon is excluded (Figure 6). Aggregate sector data mask a wide dispersion across individual companies. Multiples are elevated for companies like Amazon (which trades at around 150x expected 2019 earnings), but the company has many additional business lines (e.g., cloud services and entertainment). Some analysts believe its earnings are depressed by expensing what is effectively capital expenditure (e.g., research and development costs). In contrast, valuations are far lower for some department stores (e.g., Macy’s trades around 8x), but bearish analysts focus on discouraging trends in earnings and same store sales. 3
As of February 28, 2018 • Percent (%) Deviation from Median Forward P/E Ratio
Sources: FactSet Research Systems and MSCI Inc. MSCI data provided “as is” without any express or implied warranties.
Note: Median forward 12-month P/E is based on monthly data beginning from February 28, 1998.
Food and staples retailers, including drug stores, have also seen their index weight shrink, though the rebound in shares of index giant Walmart since the start of 2017 has slowed this process. Pure-play grocers have responded to competitive pressures through strategies like consolidation and rolling out white label goods, while diversified merchants are using a playbook that includes offering discounted shipping, acquiring online retailers, and leveraging physical stores. Less clear is how other categories will fare as Amazon continues to expand into new businesses; mergers (such as the recently announced CVS and Aetna tie-up) are one possible response.
The specialty retailing category, which includes sectors like home improvement and auto parts, has best withstood the pressure from e-commerce, supporting valuations. Skilled in-store staff is an advantage for brick-and-mortar players, as is the customization required in categories like building supplies. Discount apparel retailers have also retained their appeal, in part via a constantly updated product mix. Specialty retailers expect earnings growth in the low double-digits in 2018, reflected by a forward price-earnings ratio of over 17x, which is elevated relative to its historical average.
Prospects for 2018
Food & staples retailers and department stores underperformed last year, leaving some investors pessimistic about the sector’s prospects in 2018. Still, it may have been premature to write the obituary for the whole industry; improving sales and inexpensive valuations helped share prices for many retailers rebound in recent weeks. Recently the National Retail Foundation disclosed that 2017 holiday retail sales rose 5.5% year-over-year, above initial estimates. Retailers are getting a boost from the stronger US economy, and will be helped in several ways by recently passed tax reform. Lower personal income taxes could directly boost the buying power of many Americans, especially those in lower income brackets that have the highest marginal propensity to consume. Lower corporate tax rates should provide a particular bump to retailers, which have among the highest effective tax rates, as much of their revenue is domestic.
From an operating perspective, managers have several channels through which to improve performance and counter the e-commerce threat, including investing in their own online presence, culling leases and real estate holdings, and leveraging cross-selling opportunities. The trick for some is digesting their debt burdens as well as narrowing their focus to the most profitable malls and geographies (more on this later). Many are already far down this path, for example Sears has reduced its number of stores by more than 50% during the last five years to around 1,100. 4 Retail executives are also increasingly using mergers & acquisitions (M&As) to achieve efficiencies and introduce new strategies.
Is Real Estate the Most Vulnerable?
Worries over declining demand and (in some cases) weaker fundamentals have caused retail-focused public REITs to significantly underperform peers in recent years. Retail REITs returned -4.8% in 2017, underperforming the broader US REIT index by more than 1,300 basis points (bps) (Figure 7); over the past three years, retail REITs have effectively returned zero. Within the category, operators of so-called A malls have outperformed those of B malls and C malls, as earnings and fundamentals have held up better.
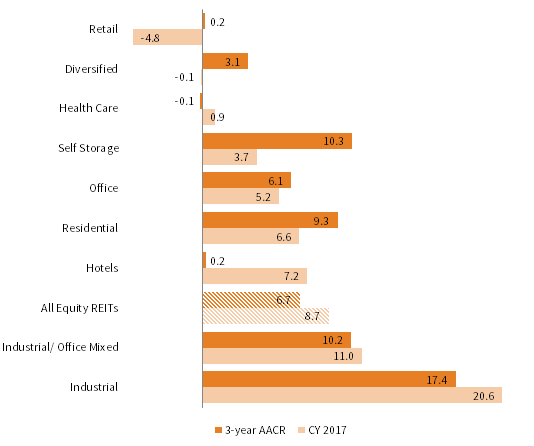
As of December 31, 2017 • Percent (%)
Sources: FTSE International Limited, National Association of Real Estate Investment Trusts, and Thomson Reuters Datastream.
REITs overall continue to look overvalued, but recent underperformance means valuations for retail REITs seem reasonable on a relative basis. Retail REITs traded at around 13 times funds from operations (FFO) at the end of February (Figure 8), well below their ten-year average and at a discount to the overall index. Within this industry average there is a wide dispersion of valuation. Some REITs that primarily control underperforming B and C malls now trade as low as two or three times expected 2018 FFO. In contrast, valuations for owners of predominantly A mall portfolios (e.g., Simon Property Group, General Growth Properties, Taubman) have also declined but remain much higher. Overall, retail REITs also have cheapened on a price-to-book basis, trading at 2.7 times book, 20% below their recent average, though valuations for some B and C operators have fallen to as low as half this level.
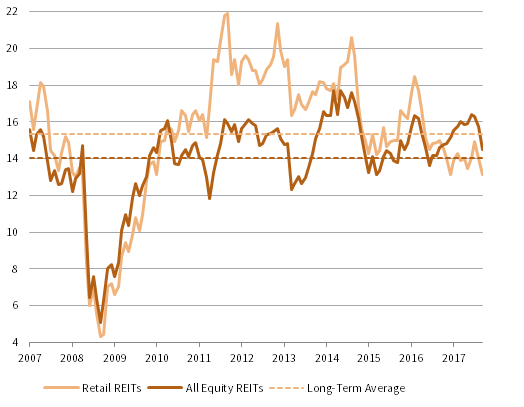
June 30, 2007 – February 28, 2018
Sources: MSCI Inc. and Thomson Reuters Datastream. MSCI data provided “as is” without any express or implied warranties.
Note: Data are monthly.
Fundamentals have held up better than might be inferred from this performance, but many trends across retail property types are diverging. For example, while vacancy rates overall for retail REITs have hovered around 5% in recent years, they are typically lower for A mall operators than B and C operator peers. Retail landlords as a group are having difficulty in increasing rents; Costar estimates retail rents increased by less than 1% (on an annualized basis) in third quarter 2017. Still, healthier locations and tenant mixes have allowed A mall operators to buck this trend; same store net operating income growth continues to be positive versus the contraction seen for landlords in weaker areas. Looking ahead reduced supply should prop up overall rents; the net amount of completed retail space in the United States has been growing by less than 1% per year since the financial crisis.
Share price declines for some A mall operators do not seem justified by ongoing positive growth in FFO, as well as projections for 2018. 5 In contrast, some B and C mall operators have seen even greater share price declines (in some cases by more than 50%), but these have accompanied significant drops in FFO as well as warnings about future growth. A “baby thrown out with the bathwater” situation may have developed for some higher-quality public retail REITs, possibly offering some value for investors. Figure 9indicates privately held retail assets seem to have held up much better. A variety of forces could be at play (including that more resilient grocery-anchored property is in private hands, meaning fundamentals have held up better), but it could also reflect landlords being slower to mark assets to market and, at a minimum, indicates fewer bargains are on offer.
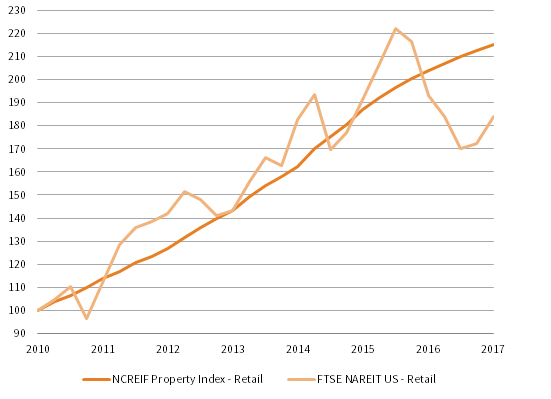
Fourth Quarter 2010 – Fourth Quarter 2017 • Fourth Quarter 2010 = 100
Sources: FTSE International Limited, National Association of Real Estate Investment Trusts, National Council of Real Estate Investment Fiduciaries, and Thomson Reuters Datastream.
Note: Cumulative wealth is based on quarterly total return data.
The downside case for mall operators has several aspects, including struggles to replace closing department stores and being forced to renegotiate lower rents when current leases are up. While some operators will be able to raise capital to help repurpose vacant spaces, levered balance sheets for others (especially certain B and C mall operators) will limit their options. Still, store closures are not universally bad for landlords as some large tenants pay below-market rents. For example, Sears pays $5 or less per square foot in some malls, less than one-third the rent that might be charged if its space was subdivided.
There is also an upside case. Some landlords have already closed or sold underperforming assets, booking losses, and over time further closures will occur, increasing the attraction of remaining assets. Landlords are focused on diversifying malls away from just shopping and into new categories like entertainment, fitness, and lodging (by adding hotels and/or apartments). M&A activity is rising (e.g., Brookfield’s bid for GGP and Unibail Rodamco’s bid for Westfield) and may also be a catalyst for greater operating efficiencies, but the scope will be limited by the potentially wide geographic footprint of the combined operations. Recently, some management teams have suggested positive earnings surprises may be in store for 2018 given improving growth, though with little impact (at least thus far) on share prices.
Impact on Credit Markets
The retail sector has slightly underperformed across credit markets over the past 12 months, as unlike in the equity market there were very few retailing “winners” to offset the headwinds to traditional names. The performance of high-yield retailers has been weaker on a relative basis (high-yield retailers have returned 3.1%, underperforming the broad high-yield index by around 100 bps), but a resurgence in 2018 has narrowed the differential. Investment-grade retailers have held up relatively better; their 1.9% return over the past year has only trailed the overall index by around 20 bps.
The impact of this underperformance on overall index performance was limited by the sector’s low index weight in both high-yield and investment-grade indexes (amounting to less than 4% of the former and around 3% of the latter, as shown in Figure 3). Pricing for the sector, particularly some of the most troubled names, also limits index weightings and may offer a cushion should headwinds strengthen. At 588 bps, the average option-adjusted spread for high-yield retailers is among the highest across sectors and is well above the 359 bps index average. Pricing for the most troubled companies is far cheaper. Some Sears bonds maturing next year trade around $0.40 on the dollar, reflecting limited prospects for quick turnaround. Similarly, with three-year bonds for troubled leveraged buyouts like that of high-end retailer Neiman Marcus trading below $0.70, investors can’t say there are no warning flags.
Weaker fundamentals for retailers help justify wider spreads. Net leverage for the high-yield retail sector has crept up in recent years and, at 4.6x, is around 50% above its long-term average, but is fairly close to the overall index leverage ratio. Meanwhile, the trailing 12-month issuer default rate among high-yield retailers has risen sharply to 6.7%, well above that of the broad index. This number is disproportionately impacted by large bankruptcies such as Toys “R” Us given the relatively small sector. The elevated distressed ratio (Figure 10) for the retail sector suggests little improvement is in sight, though the opportunity set may be limited for investors given the relatively small amount of paper involved (around $10 billion) and its concentration across a small group of borrowers (key names include PetSmart, JCPenney, and Neiman Marcus).
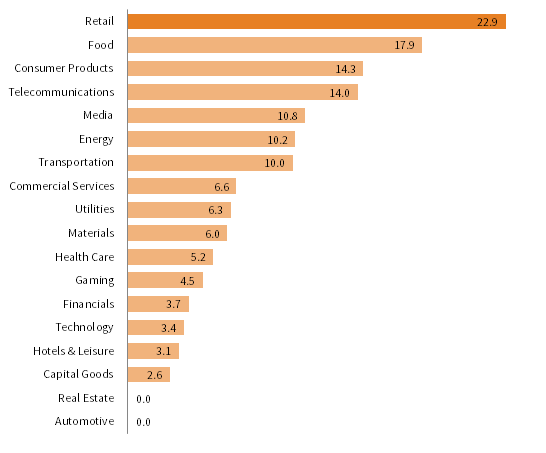
As December 31, 2017 • Percent (%)
Source: BofA Merrill Lynch.
Note: BofA Merrill Lynch defines high-yield distressed as an issuer spread of more than 1,000 basis points.
Looking forward, a rising economic tide and growing consumer confidence could help some retail credits. The flipside is that rising interest rates and weakening balance sheets could put pressure on credit ratings for some borrowers. The recently passed tax reforms may be a mixed bag, as macro benefits will be offset by policy changes for some of the weaker high-yield retail names (around 35%, according to JP Morgan). Highly levered retailers will be impacted by the reduced deductibility of interest expenses. Retailers overall are also typically less capital intensive, so these companies will benefit less from the enhanced deductibility of capital expenditures. Finally, the least profitable companies will see little benefit from a tax cut, but at the same time, will see the present value of their net operating losses reduced.
Conclusion
We think investors should take reports about the looming retail apocalypse with a grain of salt. Consumer preferences are changing and some stores are closing, but the big picture is that retail sales overall are rising, new businesses are emerging that benefit from these trends, and investor exposure to many of the most troubled firms is fairly limited. Summary financial reports for the impacted asset classes (equity, debt, real estate) do not suggest a significant worsening of fundamentals. This said, some apparel firms and department stores are struggling, and their landlords in less desirable locations may have limited options with which to replace them. Given limited shifts in valuations and small index exposures, we don’t think there are many obvious investment implications from the retail apocalypse for investors. One exception might be higher-quality mall operators that have been painted with the same brush as weaker peers; skilled active managers in the REIT space are the best implementation option to try and play this opportunity. On the credit side, pricing for bonds from certain troubled department stores reflects stressed fundamentals, limiting the distressed opportunity. While only one of many moving pieces, changes in tax policies could create some retail winners and losers, potentially also creating opportunities for skilled active managers.
Wade O’Brien, Managing Director
Nroop Bhavsar, Senior Investment Associate
Footnotes
- Somewhat confusing is that “internet retailing” also includes strongly performing companies some might not even think of as retailers (e.g., Expedia and Netflix).
- As of February 28, 2018.
- More encouraging is the potential value of Macy’s real estate holdings, which some analysts have placed at $16 billion or higher. See for example: Michael Corkery, “Grand Buildings Keep Macy’s Afloat”, New York Times (New York, NY), November 22, 2017.
- As of third quarter 2017, total includes 510 Kmart and 594 Sears stores.
- For example, SPG’s stock has fallen from around $200/share to $155, despite FFO rising from around $10 to $11.6 per share over the last two years.