Growth equity has matured and evolved into a distinct asset class with different characteristics from both venture capital and private equity, and may represent an attractive alternative for certain investors.
For those old enough to remember the commercials, U.S. growth equity could perhaps be called the Reese’s Peanut Butter Cup of the private investment world. “You got venture capital in my private equity!” “No, you got private equity in my venture!” Much like Reese’s at the time, growth equity has long had a bit of an identity problem. Growth equity does indeed incorporate elements—arguably the best elements—of both venture capital and private equity, but it is standing on its own two feet today. Growth equity has matured and evolved over the past several years to become a distinct asset class with different characteristics from both venture capital and private equity, and as such may represent an attractive alternative for certain investors.
So . . . What Is It?
If you were seeking to locate growth equity on a spectrum of private investment strategies, you would most likely place it somewhere between late-stage venture and leveraged buyouts—established companies that can benefit from additional capital to accelerate growth. Most portfolio companies will have a number (if not all) of the following traits:
- Founder-owned
- No prior institutional investment
- Proven business model (established product and/or technology and existing customers)
- Substantial organic revenue growth (usually in excess of 10%, and often more than 20%)
- EBITDA-positive or expected to be so within 12 to 18 months
Given that target companies have, by definition, grown materially over a number of years without needing outside institutional capital, why would they now take it on? There are several potential reasons, mostly including the desire to accelerate growth by investing in new product development, human capital, infrastructure, or new geographic regions; other reasons include making add-on acquisitions or to monetize a portion of management’s ownership.
Growth equity investments will typically be minority stakes using little if any leverage at investment, and often are expected to be the last round of financing needed. They often have built-in safeguards for investors as well.
It is instructive to contrast growth equity deals with buyout and venture capital transactions. Leveraged buyouts, for example, also typically involve companies with a stable earnings stream, perhaps growing less aggressively, and in this case used to facilitate the assumption of debt, which is expected to be a material contributor to the investment return. Venture capital investors, meanwhile, generally receive preferred equity positions similar to those given to growth equity funds, but because of the nascent stage of most venture-funded companies, the downside protections outlined above are typically lacking. Further, venture investors usually share control with a syndicate of other institutional investors that can have conflicting interests and priorities—a situation that growth equity investors often avoid.
How Does It Work? One Ringy Dingy
Growth equity investors must be particularly proactive when sourcing deals, as many candidates do not need to raise capital; the most attractive companies need to be found and convinced of the value proposition. As such, growth equity managers use a “cold calling” approach, with team members reaching out to management teams of potentially interesting companies to build a relationship, gain a better understanding of the company’s operations, and determine whether the company might be open to taking institutional capital. This effort is typically the responsibility of associate-level professionals. Associates mine industry news, databases, tradeshows, and other sources in search of potential investment targets, and use advanced customer relationship management systems to track efforts. The courting of a company often takes years and managers anecdotally report a success rate of 25% or less, but an effective cold-calling strategy has become a prerequisite for successful growth equity investing in an increasingly competitive market.
Importantly, the success of a cold-calling program should be measured not just on its ability to uncover “proprietary deals”—as markets become increasingly institutionalized, particularly for larger deals in North America, truly proprietary deals are becoming harder to find—but also on how often managers win a competitive deal due at least in part to a previously established relationship with the company.
Growth equity funds look similar to venture capital funds in terms of sector allocations, with significant exposure to technology (Figure 1). Between 1992 and 2008, nearly 50% of growth equity dollars were invested in technology, including media and communications companies, followed by consumer/retail (20%) and financial services (15%). This is fairly similar to venture capital, where over the same period 63% of total capital went into technology companies, followed by life sciences (27%). Buyout managers, on the other hand, tend to invest across a broader range of sectors, topped by technology (30%), consumer/retail (25%), and industrial and manufacturing-related sectors (14%).
Figure 1. Invested Capital by Sector
As of March 31, 2012

Source: Cambridge Associates LLC Private Investments Database.
It is perhaps in the area of capital loss ratios where growth equity shines most brightly. Between 1992 and 2008, growth equity investments generated an overall capital loss rate of 13%, compared to 35% for venture capital and 15% for leveraged buyouts (Table 1). The comparability of loss ratios between growth equity and leveraged buyouts is noteworthy. There is often a perception that buyouts, which invest in established companies with stable cash flow, should have superior downside protection. However, financial leverage applied to cyclical businesses adds a degree of risk not typically encountered in growth equity investments.
Table 1. Aggregate Capital Loss Ratios
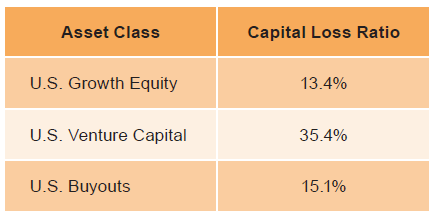
Source: Cambridge Associates LLC Private Investments Database as of March 31, 2012.
Notes: Analysis included 260 growth equity investments, 22,507 venture capital investments, and 5,188 leveraged buyout investments made between 1992 and 2008. Loss ratio is defined as the percentage of capital in deals realized below cost, net of any recovered proceeds, over total invested capital.
Show Me The Money!
All that is wonderful, of course, but how have growth equity managers performed? Growth equity managers typically target gross returns of 3x to 5x at the investment level, which falls between buyouts (up to 3x, although trending lower at present) and venture capital (potentially greater than 10x for early-stage deals). Taking into account expected losses, managers typically target fund-level returns of 2.5x to 3.5x for venture capital funds, 2x to 3x for growth equity funds, and 1.5x to 2.5x for buyout funds.
More importantly, actual performance has been strong over the past decade, with the caveat that reliable data on the asset class do not go back much further. Still, over three-, five- and ten-year periods, growth equity end-to-end net returns have outperformed venture capital and been competitive with leveraged buyouts (Table 2).
Table 2. End-to-End Returns

Source: Cambridge Associates LLC Private Investments Database as of December 31, 2012. Note: End-to-end asset class returns are pooled returns for each asset class, net to LPs.
Looked at in a slightly different way, from 1992 through 2008, growth equity deals generated a gross multiple of invested capital (MOIC) of 2.0, in line with venture capital and ahead of buyouts (1.7). However, as you might suspect, not all MOICs are created equal.
Figure 2. Total Value Gross Multiple of Invested Capital Dispersion
As of March 31, 2012

Source: Cambridge Associates LLC Private Investments Database. Notes: Data show the percentage of invested capital in deals based on a total value gross multiple of invested capita (MOIC). Analysis included 260 growth equity investments, 22,507 venture capital investments, and 5,188 leveraged buyout investments made between 1992 and 2008. Loss ratio is defined as the percentage of capital in deals realized below cost, net of any recovered proceeds, over total invested capital. * Total value = realized + unrealized.
The consistency of growth equity returns is further demonstrated in Figure 3, which plots the observation frequency of fund-level net internal rates of return between 1992 and 2008 for growth equity, venture capital, and leveraged buyout funds. Overall, growth equity has a taller and narrower curve, implying less variability in returns. Interestingly, when we exclude growth equity funds greater than $1 billion, the curve becomes shorter but also shifts slightly to the right. While a fair number of the large growth equity funds are still maturing and may generate additional upside performance, this suggests large fund sizes hinder performance, just as they do in venture capital (and as would be expected from common sense).
Figure 3. Distribution of Net Internal Rates of Return
As of June 30, 2012

Source: Cambridge Associates LLC Private Investments Database. Notes: Data show distribution of net IRRs for funds within each asset class between 1992 and 2008. Analysis included 106 growth equity funds, 559 leveraged buyout funds, and 1,044 venture capital funds. There were 24 growth equity funds raised that exceeded $1 billion in total commitments.
Finally, the growth equity asset class meaningfully outperformed the Russell 3000® Index in a public market equivalent analysis, beating it by greater than 300 basis points in all but five years between 1992 and 2008. While venture capital and leveraged buyouts also beat the index in most years—and venture capital had a sustained period of significant outperformance in the 1990s—both also had sustained periods of underperformance, with venture capital funds trailing for several years after the Internet bubble, while buyout funds suffered in the years leading up to the 2008 financial crisis (Figure 4).
Figure 4. PME Analysis: Net IRR Outperformance Versus Russell 3000® Index
As of June 30, 2012
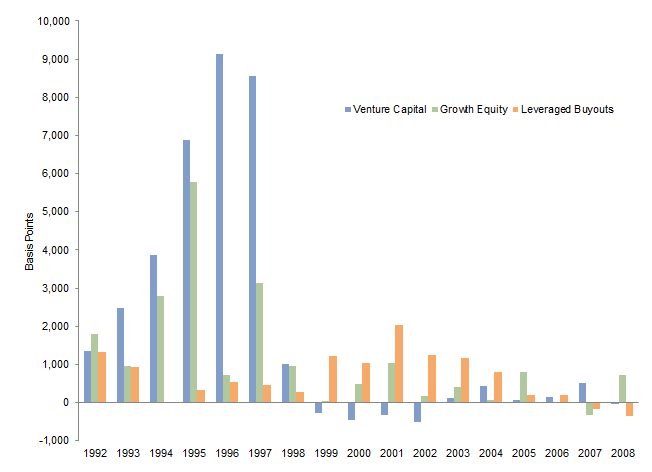
Sources: Cambridge Associates LLC Private Investments Database and Frank Russell Company.
Notes: Data represent the delta between the net IRR generated by the asset class in a given year and a Russell 3000® Index Public Market Equivalent (PME) return. PME is a private-to-public comparison framework that replicates pooled returns of each asset class under public market conditions. Russell 3000® Index shares are purchased and sold in accordance with the cash flows generated by each asset class.
New Kid in Town . . . or Last Kid Picked to Play?
Not surprisingly, given all these positive attributes—not to mention inconsistent returns in other strategies—the growth equity market has become increasingly competitive in recent years. Some traditional leveraged buyout managers, for example, look to growth equity during market cycles when leverage is less available, control positions are not on offer, or target sectors offer less supply, while venture capital managers are increasingly incorporating growth equity into their investment strategy—with some raising dedicated vehicles—to accelerate time to liquidity and minimize portfolio risk. It is notable that while buyout and venture capital fund raising both declined by varying degrees in the five-year period ending December 31, 2011, commitments to growth equity funds experienced a modest increase (Figure 5).
Figure 5. Funds Raised Over Time
As of June 30, 2012

Source: Cambridge Associates LLC Private Investments Database. Notes: Data represent aggregate commitments raised by funds within each asset class that have been tracked by C|A between 1992 and 2011. Analysis included 1,118 venture capital funds, 124 growth equity funds, and 598 leveraged buyout funds. Growth equity funds are defined as those that invested greater than 50% of commitments in growth equity deals, as defined in the report.
Purchase prices have also risen; anecdotally, we have seen many growth equity managers paying mid-teens EBITDA multiples for some companies in their most recent funds. (For comparison, average buyout multiples are currently about 8x.) While in some instances such prices may be warranted, investors should pay close attention to whether a prospective fund has exhibited pricing discipline over time. Many firms are also looking for opportunities outside the United States as competition increases. But the bottom line is that we still believe there are attractive opportunities within growth equity.
Conclusion
While growth equity shares some characteristics with other private investment strategies, its appeal clearly derives from more than simply “splitting the difference” between venture capital and private equity. Still, one could reasonably ask why, or whether, now is the right time to consider these strategies. As we see it, growth equity is currently attractive for at least three reasons:
- Reliance on Secular Growth. As noted, growth equity investors seek out companies with rapid organic growth, often in sectors growing faster than the overall economy, making it a particularly appealing strategy in a low-growth macroeconomic environment.
- Lower Risk Profile Relative to Buyouts and Venture. While growth equity investments are generally minority positions, they typically involve low or no leverage, are senior to management’s equity ownership, and have a full set of protective shareholder and governance provisions, thus mitigating downside risk. Growth equity portfolio companies also tend to have lower technology and/or adoption risk than earlier stage venture capital–backed companies.
- Strong Investment Performance. Since 2000, growth equity fund returns have been comparable to those of U.S. leveraged buyouts and stronger than U.S. venture capital; further, venture returns tend to be concentrated in a small number of managers. More importantly, conditions appear to be in place for managers to replicate their success going forward.
Not surprisingly, we are not the only ones to notice, and as a result the growth equity space has grown a bit more crowded, with dedicated managers seeing increased investor interest, while leveraged buyout and venture capital managers encroach into the space. Deals have consequently grown more competitive, with a growing number sourced through traditional auction processes. That said, we believe growth equity remains attractive, particularly for managers consistently focused on the space with well-established sourcing strategies.
In summary, while growth equity shares some characteristics with both venture capital and leveraged buyouts, it should be viewed as a separate strategy with its own risk-reward profile, distinguishable by its minimal use of leverage and portfolio companies with strong organic growth. Simply put, growth equity offers a similar return profile to leveraged buyouts but without the leverage, and could also be viewed as a low-octane venture proxy, with far less dispersion among company returns given the lower risk of loss, but also little chance for the fabled ten-baggers integral to venture’s long-term success.
Peter Mooradian
Andrea Auerbach
Michael Quealy